


Abstract
There is surprisingly little comparative published data on the bactericidal action of different sub-classes of β-lactams against aerobic Gram-negative rods, and the assumption is that all behave in the same way.
To describe a systematic investigation of a representative penicillin, cephalosporin, monobactam and carbapenem against Escherichia coli, Klebsiella pneumoniae, Acinetobacter baumannii and Pseudomonas aeruginosa.
Concentration-time-kill curves (TKC) were determined for three strains each of E. coli, K. pneumoniae, A. baumannii and P. aeruginosa. All strains were susceptible to the agents used. The antibiotics were piperacillin/tazobactam, ceftazidime, aztreonam and meropenem. The initial inoculum was 106 cfu/mL and TKC were determined over 48 h. The area-under-the-bacterial-kill curve to 24 h (AUBKC 24 log cfu·h/mL) and 48 h (AUBKC 48) were used to measure antibacterial effect (ABE). Population profiles before and after antibiotic exposure were recorded.
Against E. coli and K. pneumoniae meropenem had a maximal ABE at ≥MIC × 1 concentrations while piperacillin/tazobactam and ceftazidime had maximal effect at ≥MIC × 4 and aztreonam at ≥MIC × 8 concentrations. Ceftazidime, aztreonam and meropenem had less ABE against K. pneumoniae than E. coli. Against P. aeruginosa, meropenem was most bactericidal, with a maximum ABE at 8×/16 × MIC. Other β-lactams had notably less ABE. In contrast, against A. baumannii, ceftazidime and meropenem had the greatest ABE, with a maximal effect at ≥MIC × 4, concentration changes in population profiles were least apparent with E. coli.
β-Lactam sub-classes (penicillins, cephalosporins, monobactams and carbapenems) have different antibacterial effects against E. coli, K. pneumoniae, A. baumannii and P. aeruginosa. Extrapolation of in vitro pharmacodynamic findings from one species to another or one sub-class of β-lactam to another is not justified.
Introduction
Antimicrobial bacterial time–kill experiments have formed a key element of in vitro antimicrobial assessment for many years, allowing bacterial killing and growth in the presence of an antimicrobial to be followed as a function of time and drug concentration. As such, they provide additional information beyond that provided by an MIC, which employs only single growth and time points (inhibition of growth at 18–24 h).1
Time–kill curves are often used to compare drug classes and make inferences as to their bactericidal patterns of action, so, for example, β-lactams or aminoglycosides can be compared and classified as time- or concentration-dependent and β-lactams characterized as showing no increased kill beyond 4 to 5× the MIC.2,3 More complex mathematical approaches can also be used to determine bacterial growth rates, delay in kill, or area-under-the bacterial kill curve (AUBKC).4,5
Surprisingly, given the long history of such in vitro evaluation, there is little systematic data on the use of time–kill curves to compare the activity of different β-lactams (penicillins, cephalosporins, monobactams, carbapenems) against different genera and species of aerobic Gram-negative pathogens. This may be especially important given the increased use clinically of continuous or prolonged infusion β-lactam therapy.6
The objectives of this study were to: (i) define the concentration–effect relationships for various β-lactam sub-classes; and (ii) assess the risk of emergence of resistance using time–kill methodology.
Materials and methods
Bacterial strains
Three strains each of Acinetobacter baumannii (Southmead identification numbers 50602, 53615, 56079); Escherichia coli (56645, 56646, 56727); Klebsiella pneumoniae (41965, 41966, 55660) and Pseudomonas aeruginosa (38475, 39150, 55783) selected from clinical strains isolated at BCARE, Bristol, from 2007 were used. E. coli ATCC 25922 and P. aeruginosa ATCC 27853 were used as control strain. Bacterial isolates of the same species were shown to be independent strains by MLST analysis (data not shown).
Antimicrobials
Aztreonam, Lot No. PL0034/025, sourced from ER Squibb and Sons Ltd, Uxbridge, UK; ceftazidime, Lot No. 064M4754V, and piperacillin, Lot No. SLBJ0817V, were sourced from Sigma–Aldrich, Gillingham, UK; tazobactam, Lot No. 120900124AC, sourced from Cubist Pharmaceuticals, and meropenem, Lot No. 1401012110M, was sourced from Sequoia, Compton, UK.
Media
Mueller-Hinton Broth, Lot No. 1178727, and nutrient Agar Plates, Lot No. PO0155A, were sourced from Oxoid Ltd, Basingstoke, Hampshire, UK.
HPLC mobile phase constituents
ODS Hypersil column – ThermoFisher, Wade Rd, Basingstoke, Hampshire, UK RG 24 8PW; Ortho phosphoric acid, Lot No. 14A080500, sodium dihydrogen phosphate, Lot No. 102454R, and di-sodium hydrogen phosphate, Lot No. 13C12008, were sourced from VWR Chemicals, Lutterworth, Leicestershire, UK. Acetonitrile, Lot No. 15A121010, and methanol, Lot No. 15747634, were sourced from ThermoFisher, Basingstoke, Hampshire, UK. The composition of mobile phases and parameters for HPLC analysis of the analytes is shown in Supplementary data (Table S1, available as Supplementary data at JAC Online).
MICs
MICs of aztreonam, ceftazidime, meropenem and piperacillin/tazobactam were determined in triplicate for each strain using the ISO 20776-1:2006 broth dilution method.7 The modal MIC value (i.e. the most frequent) was taken as the absolute MIC value and used for determining the concentrations used in the time–kill curves and the change in population analysis profiles.
Time–kill curves
Overnight cultures of the test strains were diluted into fresh MHB to yield an inoculum of about 1 × 10⁶ cfu/mL in a total volume of 10 mL. Drug was added and incubation at 37°C in air for 48 h commenced. Drug concentrations tested were 0×, 0.5×, 2×, 4×, 8× and 16× the MIC of the test strain, plus AUC24h human exposures (fAUC; Table S2) divided by 24 h were employed, that is, aztreonam 28 mg/L, ceftazidime 30 mg/L, meropenem 8 mg/L and piperacillin/tazobactam 34 mg/L, respectively. One mL samples were taken at T0, 2, 4, 6, 8, 12, 24, and 48 h; aliquots (100 μL of neat and 10−3 dilution) were plated onto nutrient agar plates using a spiral plater (Don Whitley Scientific, Yorkshire, UK) and incubated for 24 h prior to counting. A broad-spectrum carbapenemase (provided by Dr J. Spencer, University of Bristol, Bristol, UK) was used to neutralize the antibacterial prior to bacterial counting. Aztreonam was not tested against A. baumannii.
Population analysis
Changes in population analysis profiles were assessed by plating a separate aliquot from each of the kill curve cultures (neat and 10−3 dilution) onto nutrient agar plates containing 1×, 2×, 4× or 8 × MIC concentrations of the test antibiotic using a spiral plater (as above) at times T0, 24 and 48 h. Plates were made approximately 24 h before use and stored at 4°C until use. Plates were incubated at 37°C for 18 h. Bacterial counts were performed and tabulated.
Data analysis
The log drop in viable count from the inoculum was calculated for each strain at time 2, 4, 6, 12, 24 and 48 h using Graph Pad Prism© San Francisco, USA. The individual strain data for each species were combined (Microsoft Excel, 2010) and the mean plus standard deviation showing the kinetics of antibacterial effect was displayed graphically. Changes in population profiles were tabulated over time. AUBKCs were calculated on Graph Pad Prism and the β-lactam MIC to AUBKCs were fitted to Sigmoid Cmax curves for each bacterial genus/species and β-lactam agent using the Boltzmann sigmoid equation.
Antibiotic assay
Aztreonam, ceftazidime, meropenem, piperacillin and tazobactam concentrations at t = 0 h and t = 24 h were measured by HPLC using isocratic methodology. Detection was by UV absorbance using a Dionex UltiMate 3000 variable wavelength detector and concentrations were determined using the external calibration method. Chromeleon™ 6.60 Chromatography Data System (CDS) (Dionex Corporation) software using manual integration was utilized. Aqueous samples for each analyte and concentration were prepared in singlicate, linearity was measured over a concentration range of 0 to 50 mg/L for aztreonam, ceftazidime and meropenem and 0 to 100 mg/L for piperacillin. Data (target versus measured observations) was plotted using GraphPad Prism, San Francisco, USA.
Results
MICs and drug concentrations
The modal MICs for E. coli, K. pneumoniae, A. baumannii and P. aeruginosa against aztreonam, ceftazidime, meropenem and piperacillin/tazobactam are shown in Table 1 and Table S3. All strains were sensitive to the agent tested by EUCAST clinical breakpoints and MICs were within the expected wild type distributions (www.eucast.org).
Modal MICs of representative β-lactams against E. coli, K. pneumoniae, A. baumannii and P. aeruginosa
| Strain | Modal MIC (mg/L) | |||
|---|---|---|---|---|
| Aztreonam | Ceftazidime | Meropenem | Piperacillin/tazobactam | |
| E. coli 56645 | 0.25 | 1.0 | 0.12 | 2 |
| E. coli 56646 | 0.25 | 0.25 | 0.03 | 2 |
| E. coli 56727 | 0.25 | 0.5 | 0.06 | 4 |
| K. pneumoniae 41965 | 0.25 | 2 | 0.06 | 8 |
| K. pneumoniae 41966 | 0.12 | 0.5 | 0.03 | 4 |
| K. pneumoniae 55660 | 0.12 | 0.5 | 0.03 | 4 |
| A. baumannii 50603 | – | 4 | 0.06 | 0.12 |
| A. baumannii 53615 | – | 2 | 0.06 | 0.12 |
| A. baumannii 59232 | – | 2 | 0.06 | 0.12 |
| P. aeruginosa 38475 | 4 | 1 | 0.06 | 4 |
| P. aeruginosa 39150 | 2 | 2 | 0.06 | 4 |
| P. aeruginosa 55783 | 8 | 2 | 0.06 | 4 |
Observed and target drug concentrations are shown in Figure S1. There was good agreement between target and observed at time zero and time 24 h for all agents.
Antibacterial effects
Changes in viable count
The plots of time–kill kinetics for E. coli against piperacillin/tazobactam, ceftazidime, meropenem, and aztreonam are shown in Figure S2. Similar graphs for K. pneumoniae (Figure S3); plots for A. baumannii (Figure S4) and P. aeruginosa (Figure S5) are also in the Supplementary data.
Area-under-the bacterial kill curves (log cfu·h/mL) were calculated at 24 h (AUBKC 24) and 48 h (AUBKC 48) for each agent and each bacterial genus or species (Tables 1 and 2).
With piperacillin/tazobactam the greatest change in AUBKC 24 for both E. coli and K. pneumoniae occurred between ×0.5 and ×2 MIC concentrations, while for A. baumannii and P. aeruginosa there was notably less killing at concentrations ≥MIC × 4 compared with the Enterobacterales. Ceftazidime’s antibacterial effect increased between ×0.5 to ×4 MIC concentrations against E. coli and K. pneumoniae, however, there was less antibacterial effect against K. pneumoniae. Similar to piperacillin/tazobactam, ceftazidime had less antibacterial effect against P. aeruginosa than Enterobacterales; however, it had more effect against A. baumannii. Meropenem’s antibacterial effect increased between concentration at ×0.5 to ×2 MIC for E. coli and K. pneumoniae. Again, activity was less against K. pneumoniae than E. coli (Tables 2 and 3). Meropenem activity against A. baumannii increased most between meropenem concentrations of ×0.5 and ×8 MIC and was greater than activity against P. aeruginosa, which was more similar to that on K. pneumoniae. Finally, aztreonam activity increased against E. coli up to concentrations of ×8 MIC and had notably greater activity against E. coli than either K. pneumoniae or P. aeruginosa.
Antibacterial effect of representative β-lactams against E. coli, K. pneumoniae, A. baumannii and P. aeruginosa
| AUBKC at 24 h (log cfu·h/mL) at drug concentrations as multiples of the pathogen MIC | ||||||
|---|---|---|---|---|---|---|
| ×0 | ×0.5 | ×2 | ×4 | ×8 | ×16 | |
| Piperacillin/tazobactam | ||||||
| E. coli | 146.3 ± 2.9 | 113.1 ± 9.3 | 26.9 ± 8.8 | 23.7 ± 4.9 | 19.2 ± 4.7 | 16.7 ± 6.2 |
| K. pneumoniae | 144.5 | 75.8 | 38.0 | 28.6 | 20.5 | 16.5 |
| A. baumannii | 139.4 ± 3.6 | 89.3 ± 21.6 | 76.6 ± 17.1 | 65.4 ± 8.9 | 54.5 ± 16.6 | 48.7 ± 6.8 |
| P. aeruginosa | 138.1 ± 4.0 | 131.7 ± 3.1 | 115.4 ± 6.6 | 78.4 ± 34.7 | 87.9 ± 29.8 | 85.0 ± 30.3 |
| Ceftazidime | ||||||
| E. coli | 147.7 ± 5.5 | 93.1 ± 45.8 | 40.0 ± 11.3 | 19.9 ± 4.8 | 26.6 ± 7.1 | 20.5 ± 6.9 |
| K. pneumoniae | 144.6 ± 1.6 | 101.2 ± 6.3 | 53.1 ± 5.3 | 35.6 ± 13.4 | 44.5 ± 9.5 | 44.1 ± 9.2 |
| A. baumannii | 139.4 ± 3.6 | 79.0 ± 36.5 | 51.8 ± 10.4 | 32.0 ± 8.4 | 27.5 ± 8.2 | 19.9 ± 3.0 |
| P. aeruginosa | 138.1 ± 4.0 | 133.6 ± 2.5 | 107.2 ± 16.5 | 104.2 ± 17.1 | 88.0 ± 20.9 | 78.6 ± 32.6 |
| Meropenem | ||||||
| E. coli | 149.0 ± 3.5 | 62.3 ± 45.2 | 27.1 ± 10.0 | 20.8 ± 10.4 | 25.7 ± 19.6 | 22.1 ± 22.3 |
| K. pneumoniae | 145.1 ± 1.1 | 119.4 ± 19.9 | 50.7 ± 16.5 | 46.4 ± 2.9 | 42.4 ± 6.8 | 34.3 ± 12.0 |
| A. baumannii | 139.4 ± 3.6 | 121.1 ± 18.5 | 69.5 ± 23.4 | 38.9 ± 11.5 | 23.8 ± 6.9 | 18.5 ± 1.3 |
| P. aeruginosa | 138.1 ± 4.0 | 103.6 ± 15.6 | 68.6 ± 18.0 | 41.8 ± 20.4 | 32.1 ± 10.0 | 27.6 ± 7.0 |
| Aztreonam | ||||||
| E. coli | 147.1 ± 5.5 | 132.3 ± 11.8 | 74.0 ± 36.5 | 50.0 ± 23.2 | 22.6 ± 3.7 | 20.3 ± 2.8 |
| K. pneumoniae | 144.8 ± 1.6 | 93.6 ± 3.4 | 73.0 ± 21.2 | 67.0 ± 18.9 | 61.8 ± 15.9 | 64.5 ± 20.1 |
| P. aeruginosa | 138.1 ± 4.0 | 129.5 ± 3.5 | 111.2 ± 11.5 | 99.9 ± 10.8 | 73.4 ± 25.3 | 63.4 ± 24.4 |
Antibacterial effect of representative β-lactams against E. coli, K. pneumoniae, A. baumannii and P. aeruginosa
| AUBKC at 48 h (log cfu·h/mL) at drug concentrations as multiples of the pathogen MIC | ||||||
|---|---|---|---|---|---|---|
| ×0 | ×0.5 | ×2 | ×4 | ×8 | ×16 | |
| Piperacillin/tazobactam | ||||||
| E. coli | 307.6 ± 9.3 | 263.5 ± 14.4 | 41.9 ± 14.8 | 23.7 ± 4.9 | 19.2 ± 4.7 | 16.7 ± 6.2 |
| K. pneumoniae | 303.6 | 149.2 | 52.8 | 54.6 | 31.8 | 25.0 |
| A. baumannii | 294.2 ± 6.3 | 213.2 ± 30.3 | 185.1 ± 26.2 | 168.5 ± 20.8 | 123.0 ± 56.1 | 123.3 ± 37.7 |
| P. aeruginosa | 291.2 ± 8.7 | 281.6 ± 1.6 | 251.1 ± 12.7 | 202.5 ± 75.9 | 191.2 ± 83.5 | 184.5 ± 83.1 |
| Ceftazidime | ||||||
| E. coli | 309.0 ± 11.1 | 208.6 ± 78.2 | 110.3 ± 49.2 | 42.9 ± 44.3 | 36.8 ± 16.2 | 20.5 ± 6.7 |
| K. pneumoniae | 305.5 ± 2.3 | 244.6 ± 9.2 | 154.5 ± 32.2 | 113.2 ± 16.9 | 140.9 ± 44.7 | 138.3 ± 47.2 |
| A. baumannii | 294.2 ± 6.3 | 188.7 ± 65.0 | 136.7 ± 35.8 | 75.8 ± 46.4 | 41.3 ± 30.5 | 27.9 ± 16.8 |
| P. aeruginosa | 291.2 ± 8.7 | 278.8 ± 7.8 | 259.2 ± 18.4 | 232.0 ± 32.1 | 207.3 ± 32.0 | 147.5 ± 68.0 |
| Meropenem | ||||||
| E. coli | 310.4 ± 8.9 | 152.2 ± 122.7 | 81.6 ± 64.0 | 208 ± 10.4 | 32.1 ± 30.4 | 28.4 ± 33.3 |
| K. pneumoniae | 305.7 ± 1.9 | 269.9 ± 26.4 | 162.8 ± 59.6 | 127.4 ± 96.9 | 144.7 ± 16.0 | 116.3 ± 16.3 |
| A. baumannii | 294.2 ± 6.3 | 262.8 ± 32.5 | 175.0 ± 60.3 | 193.7 ± 84.9 | 66.3 ± 45.9 | 46.3 ± 23.4 |
| P. aeruginosa | 291.2 ± 8.7 | 235.3 ± 21.3 | 193.2 ± 49.6 | 82.8 ± 65.1 | 32.2 ± 10.0 | 27.6 ± 7.0 |
| Aztreonam | ||||||
| E. coli | 309.0 ± 11.1 | 279.5 ± 17.5 | 192.5 ± 78.8 | 106.8 ± 84.5 | 33.7 ± 7.4 | 23.4 ± 4.0 |
| K. pneumoniae | 305.5 ± 23.0 | 235.7 ± 9.4 | 173.5 ± 108.1 | 165.8 ± 104.1 | 159.1 ± 98.6 | 163.6 ± 105.7 |
| P. aeruginosa | 291.2 ± 8.7 | 272.8 ± 7.7 | 227.5 ± 26.5 | 209.5 ± 10.0 | 133.9 ± 75.9 | 87.8 ± 66.7 |
Drug activity at 48 h (AUBKC 48; Table 3) was broadly similar to that at 24 h except that for ceftazidime. Meropenem and aztreonam activity was clearly poorer against K. pneumoniae than E. coli.
The drug exposure–response relationships to antibacterial effect measured by AUBKC 24 are shown with filled Sigmoid curves in Figure 1 with individual curve R2 values shown in Table S4. All except two R2 values were >0.8. Against E. coli and K. pneumoniae, meropenem had reached the maximum effect at MIC ×0.5 concentrations. For ceftazidime and piperacillin/tazobactam, maximum effect was reached by ×4 MIC concentrations while aztreonam produced less antibacterial effect against K. pneumoniae than it did against E. coli.
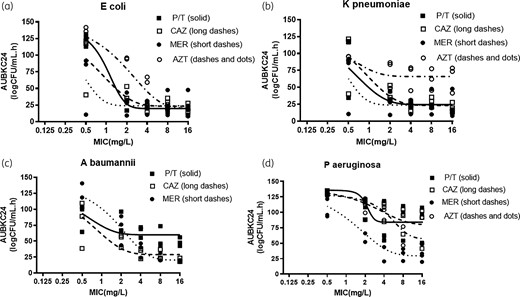
β-Lactam drug concentration killing effect relationships for (a) E. coli, (b) K. pneumoniae, (c) A. baumannii and (d) P. aeruginosa. P/T, piperacillin/tazobactam; CAZ, ceftazidime; MER, meropenem; AZT, aztreonam.
Piperacillin/tazobactam produced less bacterial killing against A. baumannii than either ceftazidime or meropenem, with piperacillin/tazobactam producing maximum kill at ×2 MIC concentration while for ceftazidime or meropenem maximum effects were observed at concentration of ×4 to ×8 MIC. Antibacterial count reductions followed a different pattern with P. aeruginosa, with either higher drug concentrations required for maximum kill or less kill being achieved overall. Meropenem produced the most kill, with MIC × 8 or ×16 concentrations needed for maximum effect. With the other three agents, poorer reductions in bacterial load were apparent and it is not clear if drug concentrations of ×32 or ×64 MIC would have produced a greater effect.
When the β-lactams were tested at human AUC24 (mg·h/L) divided by 24 h, the patterns of killing were broadly in line with the experiments using MIC multiples described above (Figure 2). While the kill kinetics of meropenem and piperacillin/tazobactam against K. pneumoniae were similar to those against E. coli for ceftazidime and aztreonam, grow-back occurred with K. pneumoniae but not E. coli. Bacterial killing was notably poorer with piperacillin/tazobactam and ceftazidime against Acinetobacter and P. aeruginosa than with E. coli.
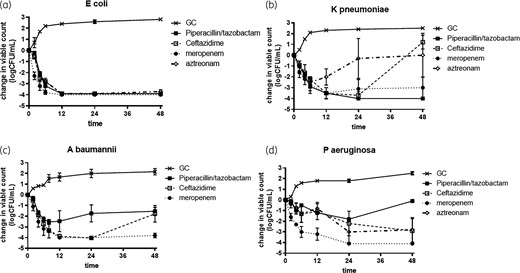
β-Lactam killing effects at drug concentrations equivalent to human drug AUC24 (mg·h/L). (a) E. coli, (b) K. pneumoniae, (c) A. baumannii and (d) P. aeruginosa. GC, growth control.
Changes in population profiles
The population profiles for each agent against each species after 48 h drug exposure are shown in Table 4. Little change in population profiles was observed with E. coli with any agent while for K. pneumoniae with ceftazidime and aztreonam, growth on plates containing MIC ≥ 4× concentration was observed. Population profiles of A. baumannii and P. aeruginosa indicated growth on MIC × 4-containing plates occurred with piperacillin/tazobactam, but not with ceftazidime or aztreonam.
Population profiles after 48 h exposure to β-lactams
| Drug concentration in media | Viable counts (log cfu/mL) | |||||||
|---|---|---|---|---|---|---|---|---|
| E. coli | K. pneumoniae | A. baumannii | P. aeruginosa | |||||
| MIC × 2 | MIC × 4 | MIC × 2 | MIC × 4 | MIC × 2 | MIC × 4 | MIC × 2 | MIC × 4 | |
| Piperacillin/tazobactam | ||||||||
| 2 × MIC | <2 | <2 | <2 | <2 | 7.4 (2)a | 7.4 (2) | 7.3 ± 0.7 (3) | 7.0 ± 1.1 (3) |
| 4 × MIC | <2 | <2 | <2 | <2 | 7.2 (2) | 7.2 (2) | 6.8 ± 1.6 (3) | 6.8 (2) |
| 8 × MIC | <2 | <2 | <2 | <2 | 6.1 (2) | 5.8 (2) | 6.5 (2) | 6.4 (2) |
| 16 × MIC | <2 | <2 | <2 | <2 | 6.3 (2) | 6.8 (2) | 6.2 (2) | 6.2 (2) |
| Ceftazidime | ||||||||
| 2 × MIC | 6.0 (2) | <2 | 7.2 (2) | 7.8 (1) | 5.8 (1) | 5.8 (1) | 7.0 (1) | 8.0 (2) |
| 4 × MIC | 4.7 (1) | <2 | 7.8 (1) | <2 | 2.0 (1) | <2 | 7.1 (1) | <2 |
| 8 × MIC | <2 | <2 | 7.8 (1) | 7.8 (1) | <2 | <2 | <2 | <2 |
| 16 × MIC | <2 | <2 | 7.4 (1) | 7.0 (1) | <2 | <2 | <2 | <2 |
| Meropenem | ||||||||
| 2 × MIC | 4.3 (1) | <2 | 7.8 (1) | 8.5 (1) | 8.0 (2) | 8.0 (2) | 7.0 ± 1.8 (3) | 8.0 (2) |
| 4 × MIC | <2 | <2 | 4.2 (1) | <2 | 5.8 (2) | 5.9 (2) | 7.1 (1) | <2 |
| 8 × MIC | <2 | <2 | 5.9 (2) | <2 | <2 | <2 | <2 | <2 |
| 16 × MIC | <2 | <2 | 3.3 (1) | <2 | <2 | <2 | <2 | <2 |
| Aztreonam | ||||||||
| 2 × MIC | 5.9 (2) | <2 | 8.3 (2) | 8.3 (2) | – | – | 7.5 (1) | 5.8 (1) |
| 4 × MIC | <2 | <2 | 8.0 (2) | 7.8 (2) | – | – | 6.7 (1) | <2 |
| 8 × MIC | <2 | <2 | 7.9 (2) | 7.7 (2) | – | – | <2 | <2 |
| 16 × MIC | <2 | <2 | 7.9 (2) | 7.6 (2) | – | – | <2 | <2 |
Number in parentheses indicates the number of experiments where colonies were recovered from antibiotic-containing media.
Discussion
Conventionally, β-lactam pharmacodynamics have been considered to be uniform, with little detail as to the differences between penicillins, cephalosporins and monobactams. In this regard carbapenems are often regarded as somewhat different.8 Increased killing is not observed once β-lactams exceed the pathogen MIC by a factor of 4–5-fold.9 Hence, β-lactams are classified as being time-dependent agents and efficacy is linked to fT > MIC as the dominant pharmacodynamics driver. fT > MIC targets may vary within the β-lactam family, being shortest for carbapenems, longer for penicillins, and longest for cephalosporins and monobactams.6fT > MIC targets may also vary between species, being shorter for staphylococci than aerobic Gram-negative rods.9,10
Our data provides additional information on comparative β-lactam pharmacodynamics, as well as underscoring that there are significant differences between different groups of β-lactams as well as between species of aerobic Gram-negative rods.
While for the two species of Enterobacterales tested (E. coli and K. pneumoniae) it is clear that bacterial killing is maximal by β-lactam concentrations of 4 × MIC, it is also clear that for meropenem maximum killing occurs by MIC × 1 concentrations, while for aztreonam total killing is less than for the other agents at similar MIC multiples. Similarly, meropenem appears to be more bactericidal against P. aeruginosa than piperacillin/tazobactam, ceftazidime or aztreonam, however, the MIC multiple at which maximum killing occurs is much greater than for Enterobacterales and may well be >16 × MIC. In contrast to the other species tested, meropenem does not appear to be more bactericidal against A. baumannii that the other β-lactams.
There are also differences between the two species of Enterobacterales, in which killing is much less marked with K. pneumoniae than E. coli, most specifically after 48 h exposures with ceftazidime, meropenem and aztreonam. This is perhaps related to the greater changes in population profiles with K. pneumoniae than E. coli, which are a marker for increased risk of emergence of resistance.11
As expected, bacterial killing was poorer with all the agents against P. aeruginosa than E. coli, with changes in population profiles being more common, perhaps arguing for the desirability of higher drug concentrations to meet pharmacodynamics targets.
The risk of emergence of resistance assessed by changes in pathogen population profile are rarely assessed in time–kill curves and it could be argued that only exposing pathogens to β-lactams for 48 h, as here, is a limitation. However, the data implies the risk of emergence of resistance is lower in E. coli that the other species tested. This is a further argument not to limit pharmacodynamic evaluation to this single species during drug development.
The conclusions of this work are clear in that caution should be exercised extrapolating from one species of aerobic Gram-negative rod to another in terms of pharmacodynamics. Most especially from E. coli to other species, as for this species β-lactam cidal action is greatest and risk of resistance lowest, giving the most optimistic assessment of drug value. In addition, extrapolation within the β-lactam family may be problematic as there are clear differences between penicillins, cephalosporins, carbapenems and monobactams, which in themselves may be species dependent.
Funding
This work was funded by AiCuris, Wuppertal, Germany.
Transparency declarations
None to declare.
Supplementary data
Tables S1 to S4 and Figures S1 to S5 are available as Supplementary data at JAC Online.
