


Abstract
Infections due to carbapenem-resistant Enterobacterales are considered urgent public health threats and often treated with a β-lactam/β-lactamase inhibitor combination. However, clinical treatment failure and resistance emergence have been attributed to inadequate dosing. We used a novel framework to provide insights of optimal dosing exposure of ceftazidime/avibactam.
Seven clinical isolates of Klebsiella pneumoniae producing different KPC variants were examined. Ceftazidime susceptibility (MIC) was determined by broth dilution using escalating concentrations of avibactam. The observed MICs were characterized as response to avibactam concentrations using an inhibitory sigmoid Emax model. Using the best-fit parameter values, %fT>MICi was estimated for various dosing regimens of ceftazidime/avibactam. A hollow-fibre infection model (HFIM) was subsequently used to ascertain the effectiveness of selected regimens over 120 h. The drug exposure threshold associated with bacterial suppression was identified by recursive partitioning.
In all scenarios, ceftazidime MIC reductions were well characterized with increasing avibactam concentrations. In HFIM, bacterial regrowth over time correlated with emergence of resistance. Overall, suppression of bacterial regrowth was associated with %fT>MICi ≥ 76.1% (100% versus 18.2%; P < 0.001). Using our framework, the optimal drug exposure could be achieved with ceftazidime/avibactam 2.5 g every 12 h in 5 out of 7 isolates. Furthermore, ceftazidime/avibactam 2.5 g every 8 h can suppress an isolate deemed resistant based on conventional susceptibility testing method.
An optimal drug exposure to suppress KPC-producing bacteria was identified. The novel framework is informative and may be used to guide optimal dosing of other β-lactam/β-lactamase inhibitor combinations. Further in vivo investigations are warranted.
Introduction
Carbapenem-resistant Enterobacterales (CRE) are considered urgent public health threats by the CDC. Patients using foreign devices and taking prolonged courses of some antibiotics are at increased risk for CRE infections. Estimated cases of hospitalized patients with CRE in the USA totalled 13 100 in 2017, which was associated with 1100 deaths and US $130 million in estimated attributable healthcare cost.1 The most common infections caused by CRE are bloodstream, respiratory and urinary tract infections.2 A significant proportion of CRE are due to carbapenemase-producing Enterobacterales, and the most common type globally (including in the USA) are KPC-type carbapenemases (47%).3
Preferred treatment options for infections outside of uncomplicated cystitis due to KPC-producing Enterobacterales include β-lactam/β-lactamase inhibitor combinations such as ceftazidime/avibactam, meropenem/vaborbactam and imipenem/cilastatin/relebactam.4 Data comparing these agents head to head are limited. A multicentre retrospective cohort study of 131 patients with CRE infections (of which >70% were positive for KPC) showed similar clinical success between ceftazidime/avibactam and meropenem/vaborbactam (62% versus 69%; P = 0.49).5 However, upon exposure to either agent, the emergence of ceftazidime/avibactam resistance was more common than the emergence of meropenem/vaborbactam resistance based on available evidence.4,5 Currently, ceftazidime/avibactam is available and administered as a fixed dosing combination in a ratio of 4:1,6 but it is unknown whether the current fixed dosing strategy has optimized the pharmacokinetics/pharmacodynamics (PK/PD) of the drugs to achieve optimal efficacy and resistance suppression. The objectives of this study were to improve understanding of the PK/PD of ceftazidime/avibactam and to provide insights on the optimal dosing target against KPC-producing Klebsiella pneumoniae.
Materials and methods
Antimicrobial agents and bacteria
Ceftazidime was purchased from Chem-Impex International (Wood Dale, IL, USA). Avibactam was procured from BOC Sciences, Inc. (Shirley, NY, USA). Meropenem was acquired from Tokyo Chemical Industry Co., Ltd. (TCI) (Portland, OR, USA). Ertapenem was obtained from Merck (Rahway, NJ, USA). The drug stock solutions were prepared in sterile water and stored at −80°C before use.
Seven clinical isolates of K. pneumoniae were examined. Carbapenem resistance and the presence of genes encoding various KPC variants were previously confirmed.7,8 The relatedness of the isolates was assessed in triplicate using Fourier-transform infrared spectroscopy (FTIR), according to the instructions from the manufacturer (Bruker, Billerica, MA, USA).
Susceptibility studies and effect prediction
For each isolate, the susceptibility of meropenem was determined by the broth dilution method recommended by CLSI.9 In addition, ceftazidime susceptibility (MIC) was determined using escalating concentrations of avibactam (e.g. 0–64 mg/L) in duplicate. Reductions in ceftazidime MIC were characterized as a function of avibactam concentration using an inhibitory sigmoid Emax model:
In this modelling framework, MIC and MIC0 represent the MIC in the presence and absence of avibactam, respectively, Imax represents the maximum inhibitory effect (i.e. reduction in MIC), H is the sigmoidicity coefficient, I is the avibactam concentration and IC50 is the avibactam concentration that results in 50% of the maximal reduction in MIC. Using best-fit parameter values, the Emax model was conditioned with unbound concentrations of ceftazidime and avibactam associated with different clinical dosing regimens. Theoretical instantaneous MIC (MICi) profiles were derived, which were reflective of changing susceptibilities to ceftazidime as avibactam concentrations fluctuate within each dosing interval. Subsequently, the %fT>MICi for each isolate was evaluated as detailed previously.10
Experimental validations in hollow-fibre infection models (HFIMs)
An in vitro HFIM was used to evaluate bacterial response to selected ceftazidime/avibactam dosing regimens. The primary endpoint of the study was sustained bacterial suppression (i.e. >2 log reduction in bacterial burden and a lack of regrowth) throughout the duration of the experiment. Regrowth was defined as bacterial burden exceeding that observed in an earlier timepoint, typically after an initial reduction of bacterial burden (with active treatment). Schematic details regarding the experimental setup have been previously outlined.11 Fresh bacterial colonies grown to log phase in CAMHB were inoculated in the pre-clinical infection model. A baseline inoculum (20 mL) of approximately 1.0 × 10⁸ cfu/mL was used for all isolates. Changes in bacterial density were monitored for up to 120 h by serially sampling (two independent samples were taken at each sampling) from the bioreactor cartridge. Samples were centrifuged, washed with saline to reduce drug carry-over, serially diluted and plated quantitatively on Mueller–Hinton agar (MHA) plates. Viable colony counts were then determined following 24 h incubation at 35°C. A secondary endpoint was to detect the emergence of resistance; MHA plates supplemented with ceftazidime/avibactam (at 3× the baseline MIC, based on ceftazidime component) were also used to quantify bacterial subpopulation(s) with reduced ceftazidime/avibactam susceptibility.
Drug assays and pharmacokinetic modelling
Various concentration–time profiles mimicking different ceftazidime/avibactam dosing regimens were simulated in the pre-clinical infection model. A first-order elimination half-life of 2.5 h was targeted for both ceftazidime and avibactam. Serial samples were obtained from the central compartment to verify the simulated drug exposures. Ceftazidime and avibactam concentrations in the samples were assayed using a validated LC-MS/MS method, as detailed previously.12 Ertapenem was used as the internal standard. The observed concentration–time profiles were characterized by a one-compartment pharmacokinetic model with zero-order input (over 0.5 h), using the ADAPT 5 software program.13 The pharmacokinetic simulations were considered acceptable if the best-fit peak concentrations and elimination half-lives were both within 20% of target values.
Determination of the threshold for optimal drug exposure
Using a pair of isogenic isolates (KP1438 and KP1491) recovered from the same patient as reference, a broad range of ceftazidime/avibactam dosing regimens (corresponding to %fT>MICi from 33% to 100%) were initially evaluated in the pre-clinical infection model. The dose ratio of ceftazidime/avibactam was kept at 4:1 in all experiments, but the dosing intervals could be either every 8 or 12 h, with different target peak concentrations corresponding to 0.625, 1.25, 2.5 or 5 g. Based on the initial results, subsequent investigations for the other five KPC-producing isolates focused on a more selective %fT>MICi range. Instead of evaluating all possible dosing regimens against the isolates indiscriminately, only selected dosing regimens were examined strategically, as guided by computer simulations. The goal was to investigate the effect of %fT>MICi where the drug exposure–response relationship was the most sensitive. Experimental outcomes observed in the pre-clinical infection model were classified as sustained suppression versus regrowth. The association between %fT>MICi and bacterial suppression was assessed using logistic regression. The threshold of %fT>MICi to prevent bacterial regrowth (i.e. breakpoint target) was identified by classification and regression tree (CART) analysis. Subsequently, the relationship between %fT>MICi (above and below the breakpoint target) and regrowth was compared using Fisher’s exact test. A P value of <0.05 was considered statistically significant. For comparison, a similar analysis was also performed with %fT>MIC using conventional MIC (i.e. ceftazidime MIC with a fixed concentration of avibactam at 4 mg/L). All statistical analyses were performed with Systat 13 (Inpixon, Palo Alto, CA, USA).
Resistance confirmation
In selected experiments showing regrowth under suboptimal drug exposures, 4–6 random isolates were recovered from drug-supplemented media plates at the end of the experiment. Meropenem and ceftazidime/avibactam susceptibility testing was repeated as detailed above. In order to provide insights on the resistance mechanism(s), the hydrolytic activity of selected resistant isolates (using a spectrophotometric assay with ceftazidime as the substrate) was also determined and compared with their respective parent isolates, as detailed previously.14 Finally, isolates with confirmed resistance to ceftazidime/avibactam were analysed by WGS methods. Isolates were prepared as previously described,15,16 and sequenced on the Illumina NextSeq platform. Genomes were assembled using SPAdes 3.1416 and annotated using Prokka.17 SNPs, insertions and deletions within β-lactamase and porin genes were confirmed using SnapGene 6.0 (Insightful Science, San Diego, CA, USA). For SNP analysis, SNPs located at repetitive or prophage regions of the genome were excluded and pairwise comparisons between parent isolates were made. Illumina read data have been deposited in NCBI and are available under BioProject PRJNA836572.
Results
Drug susceptibility and effect of avibactam
Pertinent isolate characteristics are shown in Table 1. As expected, all KPC-producing isolates were resistant to meropenem. All but one isolate (KP1491) were susceptible to ceftazidime/avibactam; the exception was due to a greater hydrolytic activity of ceftazidime.14 Compared with KP1438, a point mutation (V240G) was detected in the blaKPC gene of KP1491. The corresponding sequence was thus reclassified from KPC-3 to KPC-8. The clonality analysis by FTIR revealed three isolates (KP1438, KP1491 and KP1587) recovered from the same institution were deemed to be related (Figure 1).
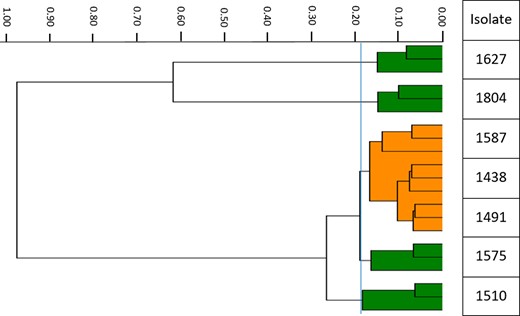
Dendrogram of the clinical isolates examined. Each bacterial isolate (labelled on the y-axis) was assessed in triplicate. The isolates were displayed according to their relative uniqueness (x-axis); closely related isolates are clustered together. The vertical blue line depicts the most discriminatory cut-off value (0.188) generated by the software algorithm. Isolates KP1438, KP1491 and KP1587 were deemed to be related and are displayed together using the same colour (orange). This figure appears in colour in the online version of JAC and in black and white in the print version of JAC.
Known KPC variants and susceptibility (MIC) of the isolates examined
| Isolate | KPC variant | MIC (mg/L) | ||
|---|---|---|---|---|
| MEM | CAZ | CAZ/AVIa | ||
| KP1438 | KPC-3 | 64 | >512 | 2 |
| KP1491 | KPC-8 | 16 | >512 | 16 |
| KP1510 | KPC-2 | 256 | 512 | 1 |
| KP1575 | KPC-3 | 512 | >512 | 4 |
| KP1587 | KPC-3 | 32 | 512 | 1 |
| KP1627 | KPC-3 | 32 | >512 | 1 |
| KP1804 | KPC-2 | 512 | 512 | 1 |
MEM, meropenem; CAZ, ceftazidime; AVI, avibactam.
MIC determined with 4 mg/L of avibactam.
For all isolates, the relationship between ceftazidime susceptibility and avibactam concentrations was reasonably characterized by the inhibitory sigmoid Emax model (r2 >0.99). Notably, a considerable reduction in ceftazidime MIC (>100×) could be achieved with increasing avibactam concentrations within the clinically relevant range. These insights are critical in the design of optimal ceftazidime/avibactam dosing regimens.
HFIMs and pharmacokinetic modelling
The target peak concentrations and elimination half-lives were reasonably well simulated in the infection models. The impact of different drug exposures on the bacterial density over time are shown in Figure 2. As previously noted, bacterial regrowth over time was associated with selective amplification of bacterial subpopulation(s) with reduced susceptibility to ceftazidime/avibactam.18
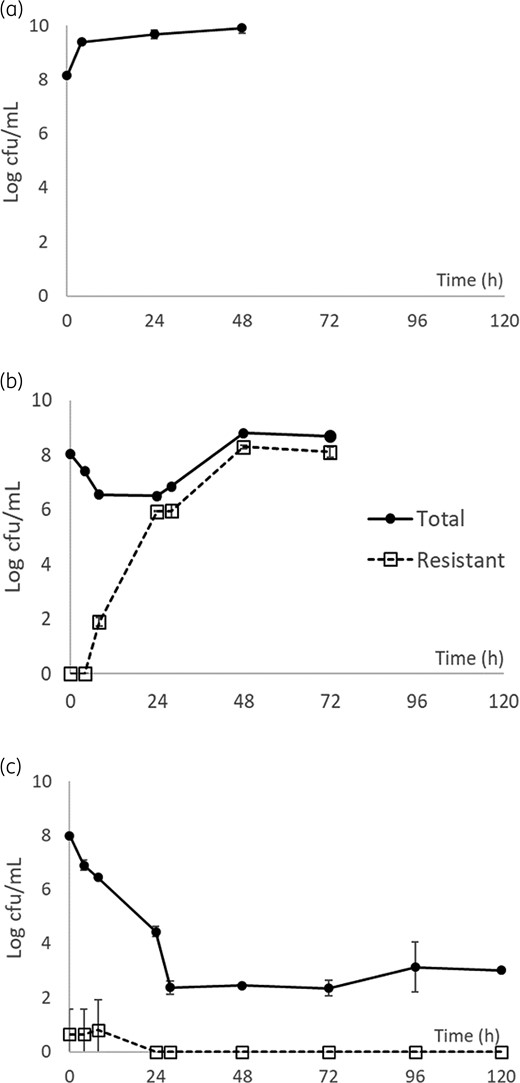
Killing profiles of ceftazidime/avibactam against KP1575 with no drug control (a); 1.25 g every 8 h (%fT>MICi = 68.8%) (b); and 2.5 g every 8 h (%fT>MICi = 100.0%) (c). Data are shown as mean ± SD.
Determination of the threshold for optimal drug exposure
Based on our preliminary results, investigations with the HFIM were mostly confined to %fT>MICi of 40%–80% (Table 2). Overall, suppression of bacterial regrowth was observed in 11 out of 20 drug exposures. These experimental observations were consistent with our expectations that higher magnitudes of %fT>MICi were associated with suppression of bacterial regrowth (P = 0.042) (Figure 3). The AUC of the receiver operating characteristics (ROC) curve was 0.960. The most significant threshold was found to be when %fT>MICi was ≥76.1% (100% versus 18.2%; P < 0.001). However, we did not see an association between %fT>MIC (using conventional ceftazidime/avibactam MIC) and suppression of bacterial regrowth (P = 0.265). Notably, in 5 out of 7 isolates, the optimal drug exposure could be achieved by the projected systemic exposure of ceftazidime/avibactam 2.5 g every 12 h.
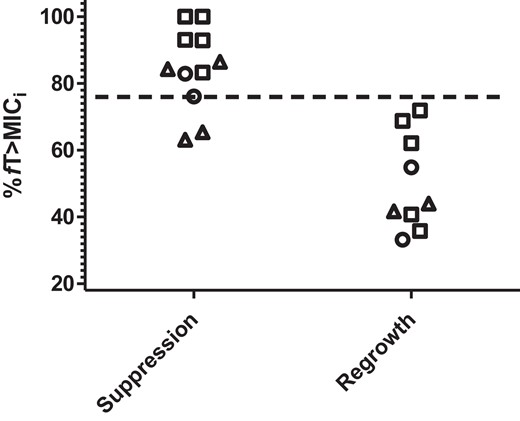
Ceftazidime/avibactam exposures (%fT>MICi) stratified by outcomes. Each data point represents an experiment. The breakpoint target (%fT>MICi = 76.1%) is depicted by the horizontal dashed line. Open triangles, KPC-2; open squares, KPC-3; open circles, KPC-8.
Projected %fT>MICi for different ceftazidime/avibactam dosing regimens
| Isolate | Ceftazidime/avibactam dosing (g) | Dosing intervals (h) | %fT>MICi |
|---|---|---|---|
| KP1438 | 2.5 | 8 | 100.0 |
| 1.25 | 8 | 93.1 | |
| KP1491 | 5 | 12 | 76.1 |
| 2.5 | 8 | 82.9 | |
| 2.5 | 12 | 54.9 | |
| 1.25 | 12 | 33.2 | |
| KP1510 | 2.5 | 12 | 84.3 |
| 1.25 | 12 | 63.1 | |
| 0.625 | 12 | 41.7 | |
| KP1575 | 2.5 | 8 | 100.0 |
| 1.25 | 8 | 68.8 | |
| 0.625 | 8 | 35.8 | |
| KP1587 | 2.5 | 12 | 92.9 |
| 1.25 | 12 | 71.9 | |
| KP1627 | 2.5 | 12 | 83.3 |
| 1.25 | 12 | 62.1 | |
| 0.625 | 12 | 40.7 | |
| KP1804 | 2.5 | 12 | 86.5 |
| 1.25 | 12 | 65.4 | |
| 0.625 | 12 | 44.0 |
Resistance confirmation
All isolates (n = 16, from experiments of 4 clonally diverse isolates) recovered from drug-supplemented media plates were found to have reduced susceptibility to ceftazidime/avibactam (i.e. MIC ≥ 64/4 mg/L), which could not be attributed to accelerated ceftazidime hydrolysis (data not shown). However, partial restoration of ceftazidime MIC (to the susceptible range) was still possible with higher avibactam concentrations. Consistent with published data, there was a ≥8-fold reduction in meropenem MIC compared with the parent isolates.19 WGS analysis of the four parent isolates (KP1510, KP1575, KP1627, KP1804) confirmed clonal diversity (median core-genome SNP difference = 494; range 162–807). When compared with parent isolates, the majority (13/16) of the isolates recovered from drug-supplemented media plates demonstrated major disruptions in blaKPC genes (Table 3). Insertions were introduced most commonly between Ambler amino acid positions 266 and 279, which includes position 272 that differentiates KPC-2 from KPC-3.20 Insertions within this region in addition to ompK36 mutations resulted in co-resistance to both ceftazidime/avibactam and meropenem. Insertions in blaKPC among isolates with WT ompK36 genes demonstrated lower meropenem MICs. Notably, treatment-emergent mutations that have been reported in patients receiving ceftazidime/avibactam were also encountered,7 specifically a tyrosine-for-aspartic acid substitution at position 179 (D179Y), as well as other mutations within the omega loop region. Additional mutations in other β-lactamase (blaSHV-11, blaTEM-1, blaOXA-9) or porin genes (ompK35, ompK37) were not identified.
Susceptibility testing results and nucleotide differences in resistance genes
| Isolate | MIC (mg/L) | blaaKPC | ompK36b | |
|---|---|---|---|---|
| CAZ/AVI | MEM | |||
| KP1510 | 1 | 256 | WT (KPC-2) | IS5 promoter ins |
| KP1510 R1 | 64 | 16 | 5 bp ins at 272 and 7 bp ins at 275 | IS5 promoter ins |
| KP1510 R2 | 128 | 16 | 29 bp ins at 273 and 16 bp ins at 283 | IS5 promoter ins |
| KP1510 R3 | 128 | 16 | 9 bp ins at 273 (DDK duplication) | IS5 promoter ins |
| KP1510 R4 | 64 | 16 | 5 bp ins at 272 | IS5 promoter ins |
| KP1575 | 4 | 512 | WT (KPC-3) | DG duplication |
| KP1575 R1 | 64 | 32 | Indeterminant | DG duplication |
| KP1575 R2 | 128 | 2 | G→T at 179 (D179Y) | DG duplication |
| KP1575 R3 | 128 | 1 | G→T at 179 (D179Y) | DG duplication |
| KP1575 R4 | 128 | 1 | 12 bp deletion at 167 (LELN del) | DG duplication |
| KP1627 | 1 | 32 | WT (KPC-3) | WT |
| KP1627 R1 | 128 | 2 | 27 bp ins at 279 | WT |
| KP1627 R2 | 128 | 2 | 27 bp ins at 279 | WT |
| KP1627 R3 | 64 | 4 | 9 bp ins at 273 (DDK duplication) | WT |
| KP1627 R4 | 64 | 2 | 9 bp ins at 273 (DDK duplication) | WT |
| KP1804 | 1 | 512 | WT (KPC-2) | DG duplication, S296Y |
| KP1804 R1 | 64 | 16 | 15 bp ins at 266 | DG duplication, S296Y |
| KP1804 R2 | 128 | 32 | 15 bp ins at 266 | DG duplication, S296Y |
| KP1804 R3 | 64 | 16 | 15 bp ins at 266 | DG duplication, S296Y |
| KP1804 R4 | 64 | 16 | 15 bp ins at 266 | DG duplication, S296Y |
CAZ/AVI, ceftazidime/avibactam; MEM, meropenem; del, deletion; fs, frameshift; ins, insertion.
Location of insertions or substitutions are shown as the amino acid position. Where applicable, amino acid changes are shown in parentheses.
ompK36 mutant genotypes are defined as an IS5 insertion in the gene promoter (IS5), an insertion encoding glycine and aspartic acid at amino acid positions 134 and 135 (DG duplication) and a tyrosine-for-serine substitution at amino acid position 296 (S296Y).
Discussion
β-Lactam/β-lactamase inhibitor combinations such as ceftazidime/avibactam have promising in vitro activity against KPC-producing bacteria, and they are increasingly used clinically for severe infections due to CRE.21 While the PK/PD of β-lactams are well established, the optimal dosing strategy for β-lactam/β-lactamase inhibitor combinations remains somewhat controversial. Studies have yielded conflicting results regarding the efficacy of ceftazidime/avibactam in clinical settings.22,23 Treatment failure has been attributed (at least in part) to pharmacokinetic issues such as inadequate dosing.24,25
The pharmacodynamics of clinically relevant ceftazidime/avibactam dosing regimens were previously investigated in two KPC-2-producing K. pneumoniae isolates.26 However, the findings may not be widely applicable for all CRE infections, as different KPC variants and/or production levels in different isolates may render avibactam less effective. Consequently, our study could be thought of as an extension of the study by Drusano et al.,26 by examining a broader range of clonally diverse isolates with different KPC variants. To facilitate an improved pharmacological understanding of ceftazidime/avibactam, our investigator group proposed a modelling framework that explicitly accounted for the effect of the β-lactamase inhibitor over a concentration range to be expected in vivo. The unique concentration–response relationship between a β-lactamase inhibitor and β-lactam MIC reduction could be leveraged for maximal efficacy. Under this more comprehensive framework, it is noteworthy that isolates with the same conventional ceftazidime/avibactam MIC (i.e. ceftazidime MIC with a fixed concentration of avibactam at 4 mg/L) may or may not have the same %fT>MICi.
Consistent with previous findings, the systemic exposures of clinically relevant ceftazidime/avibactam dosing regimens were associated with bacterial suppression. Despite genetic diversity, we also found that ceftazidime/avibactam 2.5 g every 12 h was projected to be effective in suppressing bacterial regrowth in 5 out of 7 isolates examined in this study. Furthermore, the projected %fT>MICi associated with ceftazidime/avibactam 2.5 g every 8 h would be effective in suppressing all seven isolates. Clinicians should exercise caution interpretating these findings, as the systemic drug exposures may not always be readily achieved at the infection site(s) (e.g. in epithelial lining or abdominal fluid), and a microbiological endpoint was used in this study. For a specific site, the probability of achieving the optimal target in a patient could also be dependent on the intersubject variability around the representative drug exposures used in this study. These issues are beyond the scope of this study.
Nevertheless, these findings are important. Based on the conventional susceptibility testing method (using avibactam at a fixed concentration of 4 mg/L), KP1491 was determined to have a ceftazidime/avibactam MIC of 16 mg/L, classified as ‘resistant’ per the current CLSI breakpoints. In response, a clinician would most likely avoid using ceftazidime/avibactam in this scenario. However, our framework suggests that ceftazidime/avibactam 2.5 g every 8 h would be able to achieve suppression of bacterial regrowth of KP1491, with a projected %fT>MICi of 82.9%. Therefore, ceftazidime/avibactam would actually be deemed a reasonable option for the clinician to consider. In other words, the conventional susceptibility testing method does not appear to be optimal in guiding dosing regimens or determining ‘true’ susceptibility of some isolates. An alternative PK/PD framework is more informative and promising.
In our previous work using a similar approach, we showed that a threshold %fT>MICi of 73.6% was needed to suppress the growth of different ESBL-producing bacteria, using different β-lactam/β-lactamase inhibitor combinations.12 In this study with different KPC-producing bacteria, a somewhat consistent trend was observed; the threshold %fT>MICi of 76.1% was identified. Regrowth and emergence of ceftazidime/avibactam resistance was observed in association with drug exposures below the threshold (i.e. suboptimal) exposure. It was interesting to note that ceftazidime/avibactam resistance could be mediated by different mechanisms. Unlike KP1491 (which was the isogenic mutant from KP1438), we did not see enhanced hydrolytic activity in ceftazidime/avibactam-resistant isolates recovered from the infection models. However, restoration of ceftazidime MIC was still possible with avibactam concentrations, which may be attributed to competitive substrate binding with higher concentrations or intrinsic antibacterial activity of avibactam.27 As reported previously, insertions within blaKPC were common among characterized isolates and may impact avibactam binding.28 Our data also recapitulated prior clinical reports showing the emergence of KPC mutants with D179Y substitutions that led to conformational changes in the enzyme structure and a ‘trapping’ effect associated with improved ceftazidime hydrolysis.29,30 Characterized isolates also harboured blaSHV-11, blaTEM-1 or blaOXA-9, and varying mutations in ompK36 porin genes known to impact carbapenem and ceftazidime/avibactam susceptibilities;31 however, no additional mutations were identified following exposure to ceftazidime/avibactam.
Our study has several limitations. Only a handful of KPC-producing isolates were evaluated, and our proposed dosing framework should be further examined in other KPC-variant- and metallo-carbapenemase-producing bacteria (e.g. VIM, NDM). For logistic convenience, we did not specifically evaluate the duration of drug administration (0.5 versus 2 h), as the impact (relative to doubling the dose) is expected to be small. The projected %fT>MICi values associated with different clinical dosing regimens (using prolonged infusion) are expected to be on the conservative side. Finally, the in vivo relevance of our findings should be validated. Future studies will evaluate the utility of this PK/PD framework in guiding dosing against additional isolates with reduced susceptibility to ceftazidime/avibactam, and matching a β-lactamase inhibitor to different β-lactam backbones with discordant pharmacokinetics.
In conclusion, the optimal drug exposure to suppress KPC-producing bacteria was identified using a more informative PK/PD framework. Our experimental data support the notion that clinical treatment failure could be attributed to inadequate ceftazidime/avibactam dosing when PK/PD targets are not met. In contrast to conventional susceptibility testing, more robust dosing guidance of ceftazidime/avibactam could be provided by capturing avibactam concentration-dependent changes in ceftazidime MIC.
Acknowledgements
We thank Kimberly R. Ledesma for technical assistance with the hollow-fibre experiments.
Funding
This study is supported by the National Institutes of Health (R01AI140287-04 to V.H.T. and R21AI151363-02 to R.K.S.).
Transparency declarations
V.H.T. has received consultant fees from Taxis Pharmaceuticals, Inc. R.K.S. has received consultant fees from Cidara, Shionogi, Menarini, Melinta, Merck, Entasis, Utility and Venatorx, and has received investigator-initiated grants from GenMark, Merck, Melinta, Shionogi and Venatorx. All other authors: none to declare.
