


Abstract
Temocillin plasma protein binding (PPB) in healthy individuals is reported to be ∼85% but had not been studied in patients.
To obtain normative data on temocillin PPB in patients in relation to infection and impact of co-medications widely used in ICU.
Plasma was obtained from healthy individuals (Group #1), non-ICU patients with UTI (Group #2), ICU patients with suspected/confirmed ventriculitis (Group #3) or with sepsis/septic shock (Group #4). Total and unbound temocillin concentrations were measured in spiked samples from temocillin-naive donors (in vitro) or in plasma from temocillin-treated subjects (in vivo). The impact of diluting plasma, using pharmaceutical albumin, or adding drugs potentially competing for PPB was tested in spiked samples. Data were analysed using a modified Hill–Langmuir equation taking ligand depletion into account.
Temocillin PPB was saturable in all groups, both in vitro and in vivo. Maximal binding capacity (Bmax) was 1.2–2-fold lower in patients. At 20 and 200 mg/L (total concentrations), the unbound fraction reached 12%–29%, 23%–42% and 32%–52% in Groups #2, #3, #4. The unbound fraction was inversely correlated with albumin and C-reactive protein concentrations. Binding to albumin was 2–3-fold lower than in plasma and non-saturable. Drugs with high PPB but active at lower molar concentrations than temocillin caused minimal displacement, while fluconazole (low PPB but similar plasma concentrations to temocillin) increased up to 2-fold its unbound fraction.
Temocillin PPB is saturable, 2–4-fold lowered in infected patients in relation to disease severity (ICU admission, hypoalbuminaemia, inflammation) and only partially reproducible with albumin. Competition with other drugs must be considered for therapeutic concentrations to be meaningful.
Introduction
Temocillin, a β-lactam originally described as showing stability to many β-lactamases, is a useful carbapenem-sparing drug in the context of widening ESBL-mediated resistance in Enterobacterales.1 It shows high plasma protein binding (PPB; 80%–85%), a prolonged half-life (∼4 h), adequate penetration and activity in extravascular spaces.2–4 Its high and self-saturable PPB at clinically achievable concentrations,5,6 however, complicates dose optimization based on pharmacokinetic/pharmacodynamic (PK/PD) concepts, as only the unbound forms of β-lactams are generally considered active.7 The high PPB reported for temocillin, however, came from a single study with healthy volunteers,2 while clinical studies with ICU patients documented much lower mean values (approximately 45%) but high interpatient variability.8,9 This situation is shared by flucloxacillin, another β-lactam with high PPB.10
Our aim was therefore to characterize temocillin PPB in detail and to contribute to establishing the reasons for interpatient variability. To reach this goal, we analysed samples from healthy subjects and patients with infections of increasing severity. We developed an equation for estimating drug-binding parameters that takes ligand depletion into account.11–14 We then used it to describe temocillin PPB in our samples, in relation to the degree of infection severity and inflammation of the subjects. We also examined the potential impact on temocillin-binding parameters of other drugs frequently administered to ICU patients and with variable degrees of PPB. In a nutshell, we found that (i) the binding capacity of temocillin is markedly decreased in infected patients, probably due to inflammation and ensuing hypoalbuminaemia; (ii) pharmaceutical albumin does not allow reproduction of the saturable character of temocillin binding in plasma; and (iii) drugs with high PPB cause only minimal displacement when tested at their clinically relevant concentrations if these are lower than those of temocillin.
Materials and methods
Drugs and reagents
Temocillin was provided by EUMEDICA S.A. (Manage, Belgium) as Negaban®.15 All other drugs or reagents were of suitable quality and obtained from traceable origins (see details in the Supplementary Materials and methods, available as Supplementary data at JAC Online).
Collection of samples
Samples were collected from healthy individuals (Group #1), patients with urinary tract infection (UTI) hospitalized in common wards [Group #2; Algemeen Ziekenhuis Delta (AZ-Delta), Roeselare, Belgium] and ICU patients (Cliniques universitaires St-Luc, Brussels, Belgium) with documented/suspected brain ventriculitis (Group #3) or with sepsis/septic shock (SOFA score >6;16 Group #4). Biological parameters are shown in Table 1 and Table S1. Half of the samples were obtained from temocillin-naive donors [used for spiking studies (in vitro)], and the other half from 14 volunteers (8 participating in a previous temocillin PK study;6 6 recruited in Austria with authorization from the ethical committee) or from temocillin-treated patients (see Figure S1 for doses and schedules).
Plasma total protein, plasma albumin and CRP concentrations in study populations
| Parameter | Study populations | |||
|---|---|---|---|---|
| Healthy individuals | General ward patientsa | ICU patientsa | ||
| Group #1 | Group #2 | Group #3 | Group #4 | |
| Proteins | ||||
| Donors (unexposed to temocillin; samples used for spiking experiments) | ||||
| Number | 14 | 7 | 9 | 7 |
| Plasma total protein (g/L)b | 77.1 ± 4.58 (A;a) | 63.3 ± .28 (B;a) | 63.8 ± 4.65 (B;a) | 37.7 ± 5.10 (C;a) |
| Plasma albumin (g/L)c | 47.42 ± 3.547 (A;a) | 33.7 ± 3.49 (B;a) | 34.8 ± 2.89 (B;a) | 17.9 ± 1.90 (C;a) |
| Subjects [having received temocillin (healthy volunteers) or treated with temocillin (patients)] | ||||
| Number | 14d | 12 | 7 | 14 |
| Plasma total protein (g/L)b | 70.9 ± 3.04 (A;b) | 64.7 ± 6.59 (B;a) | 64.5 ± 4.35 (B;a) | 48.9 ± 8.90 (C;b) |
| Plasma albumin (g/L)c | 43.9 ± 2.51 (A;b) | 31.1 ± 4.26 (B;a) | 32.6 ± 4.52 (B;a) | 19.1 ± 3.98 (C;a) |
| CRP | ||||
| Number | e | 11 | 7 | 14 |
| Median (min–max) | 82.4 (13.5–328) | 74.0 (14.7–131) | 179 (50.9–550) | |
| log10 mean ± SD (mg/L)f | 1.86 ± 0.358 (B) | 1.73 ± 0.31 (B) | 2.23 ± 0.339 (C) | |
Statistical analysis by row: comparing all values, unpaired ordinary analysis of variance [ANOVA (with P value at the end of each row)] followed by post hoc Tukey’s multiple comparison test [values with different upper-case letters (A, B, C) are significantly different from each other (P < 0.001)]; if with the same letter, the difference is not significant (P > 0.05). In Table 1, A is always given to the data in the left column. Statistical analysis by column: unpaired t-test comparing in vitro and in vivo data. Values with different lower-case letters (a, b) are significantly different from each other (highest P value observed: <0.02); if with the same letter, the difference is not significant (P > 0.05). In Table 1, a is always given to the data closest to the top of the table.
Patients with documented UTI hospitalized in the Department of Urology of the AZ Delta Ziekenhuis (Group #2); patients hospitalized in ICU at Cliniques universitaires St-Luc with suspected/documented ventricular infection (Group #3); or sepsis/septic shock (Group #4) (see Table S1).
Local normal values: 64–83 g/L (Cliniques universitaires St-Luc).
Local normal values: 35–52 g/L (Cliniques universitaires St-Luc).
This includes the eight volunteers enrolled in a pharmacokinetic study6 plus six volunteers recruited in Austria (with suitable modification of the protocol accepted by the Ethical Committee).
No assay was made for healthy individuals but local normal and published values17 are <5 mg/L.
Untransformed values showed inconsistent results in test for normality of distribution. Log-transformed data showed normality and were therefore used for further statistical analysis.
Preparation and handling of samples; biochemical assays
Plasma was collected after blood centrifugation and frozen at −80°C. After thawing, its pH was at or very close to 7.2. For in vitro studies, samples from donors were mixed with small volumes (≤3% of total) of concentrated temocillin solutions (plus a competing drug in dedicated studies) to reach the desired final concentrations and incubated at 37°C for 30 min before assay. Sample preparation for experiments looking at matrix dilution effects is explained in the Supplementary Materials and methods. Validated automated methods (see details in Supplementary Materials and methods) were used for the assay of total proteins, albumin or C-reactive protein (CRP).
Determination of total, unbound and bound temocillin concentrations
Total and unbound temocillin concentrations were measured after protein precipitation with methanol and on centrifuge-generated ultrafiltrates (exclusion: 30 kDa), respectively, using a previously validated HPLC-MS/MS method for analysis in serum18 or plasma6 samples. All temocillin-spiked samples were incubated at 37°C for 30 min (a time sufficient to reach equilibrium of drug PPB11 and used in most studies).19 Lack of binding of temocillin to surfaces of the ultrafiltration devices and negligible influence of temperature during the centrifugation step [at 25°C (as in all published studies with temocillin PPB) versus 37°C (often selected in PPB studies for other drugs)] were demonstrated using matrix analysis approaches (see Supplementary Materials and methods, Table S2 and Figure S2A–C). Bound concentrations were calculated as the difference between total and unbound concentrations, and the unbound fraction as the ratio between the unbound and the total concentrations.5,13
Impact of drugs with high PPB, and of tacrolimus and fluconazole, on temocillin PPB
Diazepam, midazolam, propofol and pantoprazole, all reported as highly protein bound [>95%; low dissociation constant (<10−4 M); see Table S3], were selected based on their frequent use in patients hospitalized in ICU (based on local hospital pharmacy data). Tacrolimus was added because of reported interferences with anti-infective therapy, and fluconazole as a drug with lower PPB (see Table S3 for additional details). To ensure clinical significance, drugs were added at their clinically pertinent concentration20 to plasma from Group #1 donors together with temocillin (see Supplementary Materials and methods for more details).
Model for the study of temocillin binding
The Hill–Langmuir equation (H–Le), used in most ligand–receptor studies undertaken in a molecular pharmacology context, plots the bound and unbound ligand concentrations as dependent and independent variables. It assumes that binding is minimal and that the free concentration is almost equal to the total concentrations.21 None of these conditions are met in temocillin PPB studies. First, the H–Le is invalid in situations of ligand depletion, which takes place when binding is not minimal and when the unbound concentration becomes much lower than the total concentration, a situation known as ligand depletion. Second, the bound concentrations of drugs are never measured in drug PPB studies and the difference between the total and unbound concentrations is used as a surrogate. Inspired by previous pharmacological studies,22 we developed an explicit form of the H–Le in which the temocillin bound concentration remains the dependent variable but is expressed as a function of its total concentration (Equation 1):
Data and statistical analysis
All datasets (and their transformants, if suitable) were checked for distribution normality before performing parametric statistics or regressions and curve-fitting analyses (details in Supplementary Materials and methods). Non-parametric statistics were used for analysis of non-normal distributions or in the case of uncertainties. Differences were considered as significant for P values of <0.05. Prism version 9.2/9.4 (GraphPad Software, San Diego, CA, USA) was used throughout.
Ethical approval and study registration
The ad hoc authority of each clinical institution approved and registered the study protocol [AZ Delta: Commissie medische ethiek (no. B403201938914); CU St-Luc: Comité d’Ethique hospitalo-facultaire (no. 1737/2015); Medical University of Vienna: Ethic Committee (no. 1737/2015)], which was then globally approved and given a unique Belgian registration no. (B403201629439) by the Comité d’Ethique hospitalo-facultaire of the Health Sciences Sector of the Université catholique de Louvain. The study protocols were registered at ClinicalTrials.gov (NCT03440216 and NCT03557840) and EudraCT (number 2015-003457-18).
Results
Unbound temocillin in plasma: in vitro and in vivo studies
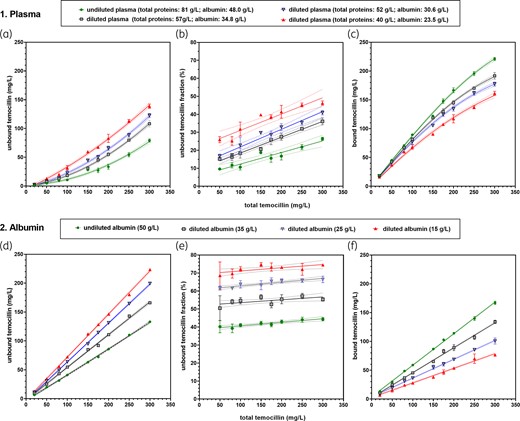
We first measured the concentration of unbound temocillin as a function of its total concentration in plasma samples obtained from (i) donors and spiked with temocillin (in vitro studies); and (ii) subjects having received temocillin prior to collection (in vivo studies). All samples were stratified into four groups, based on their health status (from healthy to critically ill patients; see Table 1 and Table S1 for details). Results are shown graphically in Figure 1 (numerical data and analyses in Table 2 and Table S4.1).
![Binding of temocillin in plasma samples. (a–c) In vitro studies (spiked samples); data are shown as mean ± SD (number of individuals = 14, 7, 9 and 7). (d–f) In vivo studies (samples from subjects or patients having received temocillin). Each data point corresponds to a unique sample, but samples obtained from individuals in each of the four groups (n = 14, 12, 7 and 14) share the same symbol and colour. Abscissa: total temocillin concentration; ordinate: (a) and (d): unbound temocillin concentration (measured); (b) and (e): unbound fraction (percent of total); (c) and (f): bound temocillin concentration calculated from the difference between the respective total [for each series of replicates (c) or for each sample (f)] and unbound concentrations (for each data point). Data were used to fit by non-linear regression analysis: (i) in (a) and (d), a quadratic (second order) polynomial function; (ii) in (b) and (e), a linear function; and (iii) in (c) and (f), the SBCALD equation. (b), (c), (e) and (f) curves are shown with 95% CI; (f) dotted lines are extrapolations beyond the last experimental point up to an abscissa value of 350 mg/L. For (b) and (e), data corresponding to an abscissa value <20 mg/L were not used because the low values compared with background yielded unreliable data for foolproof curve-fitting analysis. Values of the best-fit parameters and pertinent statistical analyses: see Table 2 and Table S4. This figure appears in colour in the online version of JAC and in black and white in the printed version of JAC.](https://oup.silverchair-cdn.com/oup/backfile/Content_public/Journal/jac/77/10/10.1093_jac_dkac286/1/m_dkac286f1.jpeg?Expires=1750293207&Signature=Ie-X1qbsa8P3i4RIQ4-yhJEIQTWOvrJJ0Va~YB2sSCYrfbVAXE9rDyb4nJ1vqEnf5eJ9NOwAgeCKktjlf7eGZAN1aHI3tyXxavOc7eUpryJcjIUjKCG8BgdA2LLWwt57gFAltVk3i8KlKWVKWOVFHHrmtwMjhTad37ad4uT2XJUaUM9KphTx9cjpn93gJA~i6SLaRL~nw5gXubC6ydDzKd3B9nZYZ71ZwwsGgfy4boNZQA3I6xYjbtUCuYwQKZMo24rBBwhkF8Ji0kWHjtEG8b1wRTn8QkwfG5NpGXtT~qnF-IOmrtCwGljeod38qbW8bPDskp2~RwN3LeSdSQAOSA__&Key-Pair-Id=APKAIE5G5CRDK6RD3PGA)
Binding of temocillin in plasma samples. (a–c) In vitro studies (spiked samples); data are shown as mean ± SD (number of individuals = 14, 7, 9 and 7). (d–f) In vivo studies (samples from subjects or patients having received temocillin). Each data point corresponds to a unique sample, but samples obtained from individuals in each of the four groups (n = 14, 12, 7 and 14) share the same symbol and colour. Abscissa: total temocillin concentration; ordinate: (a) and (d): unbound temocillin concentration (measured); (b) and (e): unbound fraction (percent of total); (c) and (f): bound temocillin concentration calculated from the difference between the respective total [for each series of replicates (c) or for each sample (f)] and unbound concentrations (for each data point). Data were used to fit by non-linear regression analysis: (i) in (a) and (d), a quadratic (second order) polynomial function; (ii) in (b) and (e), a linear function; and (iii) in (c) and (f), the SBCALD equation. (b), (c), (e) and (f) curves are shown with 95% CI; (f) dotted lines are extrapolations beyond the last experimental point up to an abscissa value of 350 mg/L. For (b) and (e), data corresponding to an abscissa value <20 mg/L were not used because the low values compared with background yielded unreliable data for foolproof curve-fitting analysis. Values of the best-fit parameters and pertinent statistical analyses: see Table 2 and Table S4. This figure appears in colour in the online version of JAC and in black and white in the printed version of JAC.
Parameters of temocillin PPB based on assay of unbound and total temocillin
| Parametera | Healthy individuals | General ward patients | ICU patients | |
|---|---|---|---|---|
| (Group #1)b | (Group #2)b | (Group #3)b | (Group #4)b | |
| (a1) Binding in spiked plasma samples from donors not exposed to temocillin (in vitro)c (analysis of data from Figure 1c) | ||||
| R2 (fit goodness) | 0.998 (n = 126) | 0.986 (n = 42) | 0.961 (n = 63) | 0.919 (n = 49) |
| Kdd (mg/L) ± sSDe (95% aCI)f | 26.7 ± 1.31 (A;a;α) (24.2–29.4) | 58.6 ± 9.91 (B;a;α) (42.0–83.7) | 57.6 ± 9.35 (B;a;α) (42.0–79.8) | 39.1 ± 8.41 (C;a;α) (25.6–58.7) |
| Bmaxg (mg/L) ± sSD (95% aCI) | 294 ± 4.46 (A;a;α) (285–305) | 240 ± 15.5 (B;a;α) (215–280) | 179 ± 10.1 (C;a;α) (161–202) | 108 ± 5.90 (D;a;α) (97.2–120) |
| Mean molar Bmax/[albumin] ratioh | 1.00 | 1.13 | 0.83 | 0.96 |
| (a2) Binding in plasma samples from subjects having received temocillin (in vivo)i (analysis of data from Figure 1f) | ||||
| R2 (fit goodness) | 0.993 (n = 145) | 0.9650 (n = 84) | 0.950 (n = 65) | 0.792 (n = 146) |
| Kd (mg/L) ± sSD (95% aCI) | 23.0 ± 2.72 (A;b) (18.5–29.2) | 33.9 ± 6.29 (A;b) (23.0–49.6) | 77.8 ± 22.0 (B;b) (47.4–156) | 84.9 ± 15.3 (B;b) (59.5–124) |
| Bmax (mg/L) ± sSD (95% aCI) | 351 ± 17.5 (A;b) (322–392) | 221 ± 17.8 (B;a) (193–268) | 231 ± 39.5 (B;a) (176–372) | 170 ± 14.7 (C;b) (141–206) |
| Mean molar Bmax/[albumin] ratio | 1.15 | 1.13 | 1.17 | 1.37 |
| (b) Binding in diluted spiked plasma samples from healthy donors not exposed to temocillin (in vivo study)j (analysis of data from Figure 3c) | ||||
| Plasma from healthy individuals | ||||
| undiluted | diluted | |||
| [Total protein]/[albumin] (g/L) | 81/48.0 | 57/34.8 | 52/30.6 | 40/23.5 |
| R2 (fit goodness) | 0.998 (n = 27) | 0.997 (n = 27) | 0.996 (n = 27) | 0.992 (n = 27) |
| Kd (mg/L) ± sSD (95% aCI) | 32.3 ± 3.72 (A;β) (26.6–44.3) | 43.8 ± 4.30 (B;β) (35.9–53.8) | 55.4 ± 5.82 (C;α) (44.9–69.2) | 106 ± 16.0 (D;β) (73.89–148.5) |
| Bmax (mg/L) ± sSD (95% aCI) | 312 ± 13.3 (A;α) (288–344) | 266 ± 9.83 (B;β) (248–289) | 257 ± 11.0 (B;β) (236–285) | 275 ± 21.7 (B;β) (238–332) |
Statistical analysis by row: ordinary one-way ANOVA with Tukey multiple comparison test (assuming equal standard deviations); similar results were obtained using Brown–Forsythe ANOVA or Welch’s ANOVA with Dunnett’s multiple comparison post hoc test (not assuming equal standard deviations) except for Kd in samples from individuals having received temocillin where values different from each other are flagged with different upper-case letters (P < 0.05). In Table 2, the data in the left column always received a letter A, the next (from left to right) with a significant difference received a B, and so on. Statistical analysis by column: unpaired two-tailed t-test comparing in vitro versus in vivo data and values with the same lower-case letter (a or b) are not significantly different from each other. The same test was also used to compare in vitro data from donors in each group [#1, #2, #3 or #4] with in vitro data generated by spiking temocillin in undiluted or diluted plasma obtained from donors of Group #1. The comparison is based on similar albumin concentrations between plasma of donors of Group #1 versus undiluted plasma (47.42 versus 48 g/L), Group #2 and diluted plasma (33.7 versus 34.8 g/L); Group #3 and diluted plasma (34.8 versus 30.6 g/L); Group #4 and diluted plasma (17.9 versus 23.5 g/L), and values with the same lower-case Greek letter (α or β) are not significantly different.
Determined by fitting Equation 1 (SBCALD) to the data using non-linear regression (least squares; no handling of potential outliers, no weighing of the data; convergence criteria: five iterations in a row changing the sum of squares by <0.0001%; each replicate (n = 3) considered as an individual point). Raw data (unbound versus total concentrations) are those shown in Figure 1 (a–c and d–f: in vitro and in vivo studies, respectively).
See Table 1 for description of Groups #1 to #4.
Number of concentrations tested: 6–9; number of replicates for each concentration: 7–14; degrees of freedom: 40–138.
Drug plasma protein dissociation constant.
Means ± symmetrical standard deviation (sSD); representing the effect of unsystematic errors.
Asymmetrical 95% CI (aCI95); profile likelihood; addressing the combined effect of unsystematic errors and systematic bias, calculated using a consistency standard error and an agreement standard error.23
Maximal binding capacity.
Calculated using a molecular weight of 66.5 kDa for albumin and concentration values from Table 1.
Number of data points: 55–145; no replicate (all independent) degrees of freedom: 53–143.
Number of concentrations tested: 9; number of replicates for each concentration: 3; degrees of freedom: 25.
In vitro [Figure 1(a–c)], unbound temocillin concentration could be related to its total concentration using a quadratic polynomial function, demonstrating a saturable character of temocillin PPB in spiked samples from all four groups (Figure 1a). Unbound temocillin concentration increased stepwise from Groups #1 to #4, with statistically significant and consistent increases of the regression parameters of the fitted quadratic functions (Table S4.1.A.1). The temocillin unbound fraction increased linearly as a function of its total concentration (Figure 1b). Slopes (B1 parameter) were close to each other, but offset values (B0 parameter; starting at a total concentration of 20 mg/L) increased in a statistically significant, stepwise and consistent fashion from Group #1 to #4 (Table S4.1.B.1), with unbound fractions reaching, respectively, 5%–18%, 18%–35%, 25%–45% and 35%–58% for Groups #1, #2, #3 and #4, for 20–200 mg/L total concentrations. Figure 1c shows the fitting of the proposed SBCALD function to the data from each group (Table 2.a1 for calculated binding parameters). Kd was increased 1.4–2.2-fold in patients compared with healthy individuals but with no relation to the type of infection. Conversely, Bmax consistently decreased from 294 mg/L in Group #1 to 240, 179 and 108 mg/L in Groups #2, #3 and #4, with statistically significant differences between each group.
In vivo [Figure 1(d–f)], similar observations were made, namely (i) saturation of temocillin PPB in samples from all four groups; (ii) stepwise and consistent increases of the unbound temocillin concentrations when moving successively from Group #1 to #2, #3 and #4 (Figure 1d); and (iii) linear increase of the unbound fraction as a function of the total temocillin concentration with values close to those measured in vitro (Figure 1e), again with similar slopes among the three groups of patients but stepwise and statistically significant increases of the offset values of the fitted functions when moving successively from Group #1 to #2, #3 and #4 (Table S4.1.A2 and S4.1.B2). Unbound fractions reached, respectively, 4%–13%, 12%–29%, 23%–42% and 32%–52% for the four groups for 20–200 mg/L total concentrations. A high correlation was noticed between slopes and offset values from in vitro and in vivo samples [r: 1.000 and 0.979, respectively (Pearson’s correlation coefficients); P values <0.05 and 0.01]. Lastly, in vivo data could be successfully used for fitting the SBCALD function (Figure 1f). Table 2.a2 shows that Bmax parameters for Groups #1 (351 mg/L) and #4 (170 mg/L) were significantly the highest and the lowest, while the values for Groups #2 (221 mg/L) and #3 (231 mg/L) were intermediate but not significantly different from each other. Conversely, changes in Kd were more consistent, with stepwise, statistically significant increases when moving from Group #1 (23 mg/L) to #2 (34 mg/L), #3 (78 mg/L) and #4 (85 mg/L). The in vitro and in vivo data were, however, not fully superimposable; when comparing binding parameters, we observed that Bmax was significantly more elevated for in vivo samples from Groups #1 and #4 only, while Kd values were significantly different for all groups and significantly more elevated for Groups #3 and #4. Nevertheless, simulation studies (Figure S3A) showed that the observed changes in Bmax could account for the bulk of the differences in temocillin PPB seen between groups in vivo, while those observed for Kd had only a minor impact, yielding a global message similar (though not entirely identical) to that obtained from the analysis of the in vitro data. Of note, the molar ratio Bmax/[albumin] was close to 1 in all groups for both in vitro and in vivo samples.
CRP concentration, hypoalbuminaemia and temocillin unbound fraction
No difference was evidenced in total plasma proteins, albumin and CRP concentrations between samples from donors and subjects (Table 1). There was a major and progressive decrease in total proteins in samples from Group #1 (>70 g/L) to Groups #2 and #3 (∼64 g/L) and then to Group #4 (<50 g/L), essentially due to decreases in albumin concentration. CRP levels were globally elevated in patients with a statistically significant difference between Groups #2 and #3 taken together versus Group #4, but with an important overlap.
The relationship between albuminaemia, CRP concentration and temocillin unbound fraction is shown in Figure 2 for in vivo samples. Based on clinical scoring of hypoalbuminaemia related to mortality,24,25 all patients in Group #4 had both severe hypoalbuminaemia (<25 g/L) and the most elevated mean CRP level (>200 mg/L; left panel). Conversely, albuminaemia remained within normal limits in all subjects of Group #1. The largest proportion of patients from Groups #2 and #3 had mild hypoalbuminaemia (<35 g/L) and moderate CRP levels (<200 mg/L), with some spread to the other two categories. There was a highly significant correlation between the decrease of albumin level and the increase of temocillin unbound fraction (right panel).
![Albumin plasma levels versus CRP concentration and correlation between plasma albumin levels and temocillin unbound fraction in the different groups of samples. Left panel: samples from subjects of Group #1 (healthy individuals; green symbols) and from subjects of Groups #2, #3 and #4 (patients; black, blue and red symbols, respectively) were taken for routine measurement of albumin and CRP within the first 24 h of enrolment (Group #1) or of hospitalization (Groups #2, #3 and #4). Results are shown as a bubble graph where each circle represents one individual and is centred on coordinates respective to its albumin level (ordinate) and CRP concentration [abscissa; logarithmic scale (see Table 1 footnote e)] while the area of each circle is proportional to the CRP concentration of that sample. CRP and albumin concentrations were single determinations. For CRP, no sampling of healthy subjects was made; a value of 4 mg/L [international and local normal values: <5 mg/L; vertical dotted line] was attributed for graphing purposes. Right panel: correlation between albumin level (abscissa) in the same samples and the unbound temocillin fraction (ordinate). The graph shows the correlation parameters as determined using non-parametric (Spearman) statistics. Since temocillin binding was saturable, each value of unbound concentration was recalculated for a common total temocillin concentration of 200 mg/L using the SBCALD function fitted to the data of in vivo samples (Figure 1f) and the corresponding binding parameters of each group (see Table 2), allowing comparable unbound fractions for all individuals included in the analysis to be obtained. For both panels, each sample was also categorized according to the degree of hypoalbuminaemia into three groups (severe: <25 g/L; mild: from 25 to <35 g/L; or normal: 35 g/L or more) using the criteria proposed to clinicians to assess the mortality risks of patients experiencing hypoalbuminaemia.24,25](https://oup.silverchair-cdn.com/oup/backfile/Content_public/Journal/jac/77/10/10.1093_jac_dkac286/1/m_dkac286f2.jpeg?Expires=1750293207&Signature=zTGSa--zTJ5oGXozyK3OQZh3SD~AGNxn4vnzTlD-jqao~iWvJE9LFBFhTCmeoEUqeDh2KrHSN7YVvQWUjYfYGKMVNGHju6sKVl3w0Vy8WdFI71gG5jy9wkVecQyvFRQkNbKJchtO0VJz-RhOMndt5yA1GJL~OvhFFIKuKKEhrR9X-mW~dAE34r21FV6-vDI8hznhgRe3ZJt-QG~66u03j2nEV05eM2zCuZw7zTOyeVI64OueLUbWlzVDjDbgm9jB9uFXSJLrrxNcNT5UQowJ6RsIzFboJEt9GC5l3Y~5dtVqu72yryyxIvqK5DN1eQ8dYA35~uY2CdeZLm9juDdVhw__&Key-Pair-Id=APKAIE5G5CRDK6RD3PGA)
Albumin plasma levels versus CRP concentration and correlation between plasma albumin levels and temocillin unbound fraction in the different groups of samples. Left panel: samples from subjects of Group #1 (healthy individuals; green symbols) and from subjects of Groups #2, #3 and #4 (patients; black, blue and red symbols, respectively) were taken for routine measurement of albumin and CRP within the first 24 h of enrolment (Group #1) or of hospitalization (Groups #2, #3 and #4). Results are shown as a bubble graph where each circle represents one individual and is centred on coordinates respective to its albumin level (ordinate) and CRP concentration [abscissa; logarithmic scale (see Table 1 footnote e)] while the area of each circle is proportional to the CRP concentration of that sample. CRP and albumin concentrations were single determinations. For CRP, no sampling of healthy subjects was made; a value of 4 mg/L [international and local normal values: <5 mg/L; vertical dotted line] was attributed for graphing purposes. Right panel: correlation between albumin level (abscissa) in the same samples and the unbound temocillin fraction (ordinate). The graph shows the correlation parameters as determined using non-parametric (Spearman) statistics. Since temocillin binding was saturable, each value of unbound concentration was recalculated for a common total temocillin concentration of 200 mg/L using the SBCALD function fitted to the data of in vivo samples (Figure 1f) and the corresponding binding parameters of each group (see Table 2), allowing comparable unbound fractions for all individuals included in the analysis to be obtained. For both panels, each sample was also categorized according to the degree of hypoalbuminaemia into three groups (severe: <25 g/L; mild: from 25 to <35 g/L; or normal: 35 g/L or more) using the criteria proposed to clinicians to assess the mortality risks of patients experiencing hypoalbuminaemia.24,25
Temocillin binding in diluted plasma and pharmaceutical albumin
Figure 3 shows the results of additional experiments using spiked specimens made (i) in diluted plasma from Group #1 donors [Figure 3(a–c)] or (ii) in pharmaceutical albumin [Figure 3(d–f); see Table 2b, Table S4.2 and Figure S3B for numerical data and additional analyses]. Together with undiluted plasma, this yielded four binding curves, ordered so as to compare each of them with one of the four curves observed for donors of Groups #1, #2, #3 and #4 spiked with temocillin [compare Figure 1(a–c) and Figure 3(a–c)]. This showed total concentration-dependent saturation together with stepwise increase of unbound temocillin concentrations when moving from undiluted to increasingly diluted plasma (Figure 3a), a linear relationship between temocillin unbound fraction and total concentration (Figure 3b) and adequate fitting of data describing binding in diluted plasma to the SBCALD function (Figure 3c). Simulation studies suggested here that changes in both Kd and Bmax parameters played a critical role (Figure S3B). Dilution of plasma to mimic the changes in albumin concentrations seen in samples from the different groups failed to fully reproduce the changes in unbound temocillin concentrations, and all values were systematically lower (Figure S4). Replacing plasma by pharmaceutical albumin resulted in still less temocillin binding and in a loss of saturation (Figure 3d). The SBCALD function could not be fitted to the data, a linear relationship being observed between total and bound concentration in this matrix all over the range of investigated concentrations (Figure 3f). A linear relationship was also maintained between unbound and total concentrations, but with slopes much lower and offset values much higher than in diluted plasma (Figure 3e versus 3b; Table S4.2.B and Table S4.3.B).
Binding of temocillin in diluted plasma and pure albumin. (a–f) Spiked samples from healthy subjects. (a–c) Spiking in undiluted and diluted plasma. (d–f) Spiking in undiluted and diluted pharmaceutical albumin (ALBUREX®). The dotted lines above and below each solid line show the confidence band (95% CI) of each of the corresponding fitted functions. Abscissa: total temocillin concentration; ordinate: (a) and (d): unbound temocillin concentration (measured; raw data); (b) and (e): calculated unbound temocillin fraction (percent of total); (c) and (f): bound temocillin concentration, calculated as difference between total (common to each series of replicates) and unbound (specific to each replicate) concentrations. For (b) and (e), data corresponding to an abscissa value ≤20 mg/L were not used to avoid fooling the curve-fitting analyses with intrinsically unreliable data due to low experimental readings. Data are shown as means ± SD of three (plasma) or four (albumin) replicates for each total concentration. (a) A second-order polynomial (quadratic) equation was fitted to the data. (c) The SBCALD function was fitted to the data. (f) The SBCALD function could not reliably be fitted to the data and linear functions were used for fitting. This figure appears in colour in the online version of JAC and in black and white in the printed version of JAC.
Impact of combining drugs with high PPB on temocillin PPB
Figure 4 (with additional analyses in Figure S5) shows that the effects of all competitor drugs on temocillin binding were minimal, with fluconazole causing a larger increase of unbound temocillin concentration than any of the other drugs, although it was the drug showing the lowest PPB among those tested here. This change in unbound fraction can be predicted using a modified SBCALD equation taking into account the dissociation constant of each drug from plasma proteins (Figure S6). Simulation studies also showed that this unexpected ranking observed when comparing diazepam with fluconazole was essentially due to differences in concentration ratios of the two drugs to temocillin when used at the clinically relevant plasma concentrations (Figure S7).
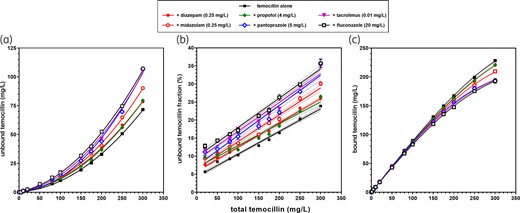
Impact of co-medications on the binding of temocillin to plasma proteins. (a–f) Spiked plasma samples from healthy subjects. Abscissa: total temocillin concentration; ordinate: (a) unbound temocillin concentration (measured); (b) unbound temocillin fraction (percent of total); (c) bound temocillin concentration, calculated from the difference between the respective total and unbound concentrations. Data are shown as mean ± SD (not visible if smaller than the symbols) of replicates (three for each experimental point). Data were used to fit a quadratic polynomial function (a); a linear function (b); the SBCALD function (c). The dotted lines above and below each solid line in (b) and (c) show the confidence band (95% CI) of each of the corresponding functions. For (b), data were filtered to exclude those with an abscissa value <20 mg/L from the analysis to avoid fooling the curve-fitting analyses with intrinsically unreliable data due to low experimental readings. This figure appears in colour in the online version of JAC and in black and white in the printed version of JAC.
Discussion
Temocillin shows high PPB, calling for attention to individual and/or local unbound concentration when attempting to optimize its activity. However, the scarce and often disparate studies published so far do not provide the basic data that are needed to apprehend the clinical importance of this binding. We therefore addressed several key questions in a progressive but comprehensive fashion, including the characterization of the saturation of temocillin PPB in infected patients, the impact of inflammation and ensuing hypoalbuminaemia, the reproducibility of plasma data with pure albumin, or potential interferences of co-medications with high PPB. By using a combination of in vitro and in vivo approaches, and enrolling homogeneous classes of patients with respect to the severity of their infection and a cohort of healthy volunteers as control, we were able to make key observations that may pave the way for future research.
First, we showed that the binding capacity of plasma proteins for temocillin (Bmax) is reduced in patients, in a proportion that is directly correlated with the increase in CRP and inversely correlated with the concentration of plasma albumin, two markers of inflammation and of increasing mortality risk.24–26 This information may be of critical importance to clinicians who need to adapt dosing regimens accordingly. Decreased temocillin PPB in infected patients had been noted but was either not studied8,9 or was considered in infected patients as a single heterogeneous group, leading to incomplete and therefore suboptimal information.27 The design of our study, with objective stratification of patients into three cohorts with increasing severity of infection and little overlap between them, and a cohort of healthy volunteers, allowed us to mitigate this issue. Group #1 (healthy volunteers) was missing in the recent flucloxacillin PPB study,27 for which the model also excluded critically ill patients,28 but was important for providing needed baselines (regrettably missing for our CRP assays). A decrease in plasma albumin is a well-known feature of infection29 and clinical categories of hypoalbuminaemia are associated with major differences in mortality.24,25 Infection triggers inflammation, which is thought to cause albumin escape through increased capillary permeability30 and to also shorten its half-life,31 providing a rational, though probably incomplete, explanation for infection-associated hypoalbuminaemia.32 Although causality remains to be documented, the available data clearly point to hypoalbuminaemia as the rational link between infection severity and decreased temocillin PPB. Yet, a maximal load of about one molecule of temocillin per molecule of albumin is maintained, as previously decribed.33,34 Similar correlations have already been described for other antibiotics with large PPB.35–37 Cirrhosis and ensuing hypoalbuminaemia have also been associated with decreased PPB of many highly protein-bound antibiotics.38 Here, we also show by multilinear regression analysis that albumin decrease and CRP increase account for most of the observed effect.
It is commonly accepted that the unbound concentration prevailing at the infected site is critical for activity and therapeutic success of most antibiotics including β-lactams,39 although clinical evidence remains scarce.40,41 Infected sites are most often extravascular,42 but measuring unbound concentrations in tissues or extravascular fluids is not a routine investigation in clinical practice. The unbound plasma concentration of antibiotics is often used as a surrogate for predicting activity at the infection site.43–45 There is much evidence that this concept fully applies to β-lactams,46–48 as these drugs do not accumulate in deep compartments.49,50 A rapid equilibrium of the unbound concentrations of temocillin between plasma and extracellular sites is indeed expected to occur, with the bound drug acting as a reservoir favouring the diffusion of the antibiotic to the site of infection,51 as was originally proposed for and observed with temocillin.4,52,53 We know that it is the time during which the unbound concentration remains above the MIC of the causative organism (%fT>MIC)54 that predicts β-lactam activity55–57 and prevents the emergence of resistance.58 However, the impact of protein binding on PK/PD is complex.59 For example, increasing the unbound-to-bound ratio of a protein-bound drug will also cause an increase in its volume of distribution (Vd). As a consequence, its unbound concentration in the plasma will decrease. This adverse effect will be all the more important in patients with severe infections due to their hypoalbuminaemia.35 Moreover, increasing the unbound fraction of a drug will also enhance its renal clearance.60,61 Altogether, these factors might cause a decrease rather than an increase in %fT>MIC. This is likely to occur in the absence of therapeutic drug monitoring (TDM)-based dose adjustments. Further documentation of the relationship between infection severity and increase in unbound temocillin concentrations will be essential, as it may help to design predictive diagnostic tools needed for optimal initiation of the therapy.56
Second, we show that pharmaceutical albumin binds temocillin but to a lesser extent than anticipated and, most intriguingly, fails to show saturation. Our study, however, did not provide new information on the mechanisms responsible for temocillin PPB. We noticed that the dissociation constant Kd tends to increase for in vivo samples from ICU patients versus volunteers or non-severely ill patients. We cannot exclude a lower affinity of albumin from ICU patients,62 but our modelling studies (Figure S3) suggest that the overall binding of temocillin is essentially influenced by the Bmax values. The lack of quantitative similarity of the effects exerted by a decrease in plasma albumin caused by infection versus mere plasma dilution, and the fact that replacing plasma albumin by pharmaceutical albumin yielded a much lower and non-saturable binding, suggest a role for other proteins or plasma constituents. It is also possible that diluting plasma with 0.9% NaCl introduced changes in albumin-binding properties. Moreover, we cannot rule out that the pharmaceutical albumin used here did not maintain all key properties critical for drug binding.63–67 In this context, differences between brands could explain why clinical trials examining the improvements in organ function brought by albumin supplementation in severely ill patients yielded confusing results, leading to variable clinical recommendations.68–71
Third, we document that the co-administered drugs with high PPB only cause marginal increases in unbound temocillin concentration if from a class for which activity develops at lower molar concentrations than temocillin. Conversely, drugs with low PPB may trigger interferences if their active concentration is similar to that of temocillin. This can probably not be ascribed to a difference in the binding site between temocillin and competitors, since benzodiazepines or propofol bind to the drug binding site I of albumin, but pantoprazole, as well as some β-lactams, to its drug binding site II.72 The simplest alternative explanation is that we tested these drugs widely used in ICU at the concentrations at which they exert their pharmacological effect, which are, on a molar basis, much lower than those of temocillin. Conversely, our data with fluconazole may warn clinicians about unanticipated effects of drugs with low protein binding if these require therapeutic plasma concentrations to reach values close to those of temocillin.
Beside its direct impact for the better appraisal of the parameters affecting protein binding and its consequence in the clinics, this work also offered us the opportunity to reassess the H–Le equation and its applicability in the context of ligand depletion often seen in pharmacological situations. Many studies, including recent ones,4,14,27,28,60 use the H–Le equation forgetting that it was developed for ligand–receptor studies run under conditions of minimal binding, but not for conditions of high ligand concentrations causing substrate depletion. This condition invalidates the H–Le equation and all similar functions,73,74 and is specifically not recommended if the unbound ligand concentration is <90% of its total concentration,23 which was the case here. Moreover, bound drug concentrations (i.e. the dependent variable in H–Le) were not measured. In general, these are calculated as the difference between total and unbound concentrations. However, the H–Le would become implicit in these conditions, requiring both specific calculation methods and providing initial values for the parameters to be determined by curve-fitting analysis.23 Based on previous work addressing the ligand depletion issue in pharmacological studies,22 and on previous studies with ceftriaxone13 and temocillin,75 we developed an explicit equation that takes ligand depletion into account and uses the total temocillin concentration as independent variable. Of note, both the total and unbound concentrations are experimentally measured in clinical samples (and thus both accompanied by an experimental error), while total concentration is known in in vitro samples. This may possibly contribute an explanation for the higher variability observed in binding parameters calculated for in vivo versus in vitro samples.
In conclusion, our data show that PPB of temocillin is lower in infected patients than in healthy subjects, the difference being correlated with the degree of severity of their infection and commensurate decrease in plasma protein levels. In a broader context, it suggests the importance of studying drug PPB in the target patient populations. Because in vivo temocillin PPB could not be fully reproduced in vitro, our study highlights the importance of monitoring the unbound concentration in vivo. We also show that studying the potential interactions of any drug with temocillin PPB should focus on therapeutically pertinent concentrations in order to ensure clinical relevance. Our data also warn against indiscriminate use of pure albumin or plasma from healthy volunteers in the study of PPB of drugs.
In a broader context, this comprehensive work of temocillin PPB may be considered as a normative study, which not only provides a pharmacological model to estimate bound concentrations based on total concentrations and binding parameters, but also highlights for the clinician some key parameters to take into account to establish rational dosing for highly protein-bound drugs, as well as to select optimal conditions for treatment in the clinic, especially when TDM is performed.76
Acknowledgements
We would like to thank S. Renard, C. Berghe, M.-F. Dujardin and L. Gielens for their assistance in patient recruitment, and S. Asta for help in HPLC-MS/MS analysis. This paper is dedicated to the memory of Professor Dr Johan W. Mouton, who actively participated in the first steps of this investigation and whose untimely death will be very much regretted.
Funding
This study was funded in part by EUMEDICA S.A., Belgium, which also provided useful information for the selection of the Belgian clinical centres participating in the study. However, the sponsor played no role in launching, performing and ending of the study. It was not involved in data analysis or data interpretation, or in the decision to submit the results for publication. The collection of clinical data, the performance of analytical studies, handling and analysis of the results, and preparation of the present paper were part of the PhD thesis of P.N.P., whose work was supported by the Université catholique de Louvain. No specific funding was set forth or required by the other participants, whose work was supported by the general budget awarded to their clinical or laboratory units by their institutions and considered as being part of their normal academic and/or clinical activities.
Transparency declarations
P.N.P. is an employee of the Université catholique de Louvain. X.W. and P.-F.L. are employees of the Cliniques universitaires Saint-Luc, and S.V. and L.G. of the AZ Delta Ziekenhuis. F.V.B. is Research Director of the Fonds de la Recherche Scientifique (F.R.S.-FNRS). P.M.T. is an Emeritus Professor and was unpaid. The laboratories and/or clinical units of F.V.B., P.M.T., A.E.M., M.Z. and P.-F.L. have received research supporting grants and/or honoraria from various industries for research work and/or presentations unrelated to the topic of the present paper. All other authors declare no conflicts of interest.
Supplementary data
Supplementary Materials and methods, Tables S1 to S4, Figures S1 to S7 and the Appendix are available as Supplementary data at JAC Online.
References
Author notes
Deceased (9 July 2019).
