


Abstract
The aim of the study was to assess the impact of the COVID-19 pandemic on antimicrobial consumption (AMC) in the hospital sector in Croatia by analysing data reported to the European Surveillance of Antimicrobial Consumption Network (ESAC-Net) between 2016 and 2020.
AMC was measured as the number of DDDs/1000 inhabitants/day and as the number of DDDs/100 bed days. To assess trends, linear regression was performed. To assess the impact of the pandemic on AMC, the compound annual growth rate was calculated for the years preceding the pandemic based on which AMC for 2020 was forecasted and compared with the actual consumption.
While hospital AMC expressed as DDDs/1000 inhabitants/day between 2019 and 2020 decreased by 17%, when expressed as DDDs/100 bed days, an 8% increase was observed. Hospital consumption of antibacterials for systemic use in the 5 year period did not significantly change when expressed as DDDs/1000 inhabitants/day, while it statistically significantly increased when expressed as DDDs/100 bed days. An increasing trend in consumption of broad-spectrum antimicrobials was found.
During the pandemic there was an increase in hospital AMC with a shift towards broad-spectrum antimicrobials requiring further in-depth qualitative analysis based on patient-level data. Contrasting results obtained using different denominators indicate that the metric DDDs/1000 inhabitants/day is not sensitive enough to evaluate hospital AMC. When assessing hospital AMC, the population under surveillance should be relevant for healthcare context. Antimicrobial stewardship remains one of the most important strategies to tackle antimicrobial resistance and antimicrobial surveillance methods must be as sensitive as possible.
Introduction
Coronavirus disease 2019 (COVID-19) was declared a pandemic by the WHO and an epidemic by the Croatian Ministry of Health on 11 March 2020.1,2 At the beginning of the COVID-19 pandemic, as different therapeutic strategies were explored, antibiotics were used in most COVID-19 patients.3–5 It was later reported that only a minority of patients had a secondary bacterial infection requiring antibiotic treatment.6 There was also a hope that a macrolide antibiotic, azithromycin, could have beneficial effects in COVID-19 patients due to in vitro antiviral and anti-inflammatory properties and was widely prescribed.7,8 However, its efficacy in COVID-19 patients was later disproved.9–11
It has recently been shown that hospital antimicrobial consumption (AMC) in the EU/EEA has decreased from 1.64 DDDs/1000 inhabitants/day in 2019 to 1.57 DDDs/1000 inhabitants/day in 2020 (4.5%).12
However, reports on the consumption of antimicrobials from individual hospitals during the pandemic compared with the pre-pandemic period show an increased consumption expressed as DDDs/100 bed days.12–17
To the best of our knowledge, there are no studies published on the impact of COVID-19 on hospital AMC at national level. The objective of this study was to assess the impact of the COVID-19 pandemic on AMC in the hospital sector in Croatia in 2020 when compared with the previous 4 years using different denominators.
Methods
Data sources
The analysis was performed based on data reported to the European Surveillance of Antimicrobial Consumption Network (ESAC-Net) for the period 2016 to 2020, retrieved from The European Surveillance System (TESSy) on 6 September 2021.
The Census of 201118 was used as the population denominator for surveillance of AMC in the hospital sector. To validate the results of the analysis, an additional denominator—the number of bed days—was used. The information on the number of bed days for the observed period was retrieved through the official body of the Croatian Ministry of Health responsible for the surveillance of AMC and resistance.19
Descriptive and statistical analysis
AMC data were collected using the Anatomical Therapeutic Chemical (ATC) classification system and analysed using the DDDs listed in the ATC/DDD Index for 2021.20
Hospital AMC was measured as the number of DDDs/1000 inhabitants/day and, additionally, as the number of DDDs/100 bed days. A bed day is defined as a day during which a person is confined to a bed and in which the patient stays overnight in a hospital [Guidelines for ATC classification and DDD assignment 2022 (WHO Collaborating Centre for Drug Statistics Methodology, 2021)].21
To assess the impact of the pandemic on AMC, the compound annual growth rate (CAGR) was calculated for the years preceding the pandemic (2016–19) based on which AMC for 2020 was forecasted and compared with the actual consumption. The CAGR corresponds to the mean annual change as a proportion (%) of the consumption in the year of commencement.
To assess 5 year trends in consumption of antimicrobials, linear regression was conducted both for the actual and predicted use for 2020 by using the CAGR. A P value ≤0.05 for the regression coefficient was considered statistically significant. Microsoft Excel statistical tool version 16.43 was used.
Antimicrobial selection
The main analysis was performed for antibacterials for systemic use (ATC group J01). The consumption was analysed by the ATC level 3 groups and substances (Table 1).
Hospital consumption of antibacterials for systemic use (ATC group J01) at ATC group level 3 expressed as DDDs/1000 inhabitants/day, 2016–20
| ATC group | 2016 (DDDs/1000 inhabitants/day) | 2017 (DDDs/1000 inhabitants/day) | 2018 (DDDs/1000 inhabitants/day) | 2019 (DDDs/1000 inhabitants/day) | 2020 (DDDs/1000 inhabitants/day) | Trend | P |
|---|---|---|---|---|---|---|---|
| J01A (tetracyclines) | 0.04 | 0.04 | 0.03 | 0.04 | 0.03 | ||
| J01C (β-lactam antibacterials, penicillins) | 0.45 | 0.45 | 0.47 | 0.50 | 0.39 | ||
| J01D (other β-lactam antibacterials) | 0.50 | 0.55 | 0.53 | 0.56 | 0.50 | ||
| J01E (sulphonamides and trimethoprim) | 0.04 | 0.04 | 0.04 | 0.04 | 0.03 | ||
| J01F (macrolides, lincosamides and streptogramins) | 0.15 | 0.16 | 0.16 | 0.18 | 0.19 | ↑ | 0.004 |
| J01G (aminoglycosides) | 0.09 | 0.09 | 0.09 | 0.09 | 0.07 | ||
| J01M (quinolone antibacterials) | 0.21 | 0.23 | 0.24 | 0.24 | 0.20 | ||
| J01X (other antibacterials) | 0.17 | 0.19 | 0.24 | 0.22 | 0.20 | ||
| J01 (antibacterials for systemic use) | 1.65 | 1.74 | 1.80 | 1.85 | 1.61 |
Arrows indicate a statistically significant changing trend between 2016 and 2020.
Results
While total hospital consumption of antibacterials for systemic use (ATC group J01) expressed as DDDs/1000 inhabitants/day decreased between 2019 and 2020 by 17% (from 1.85 to 1.61), when expressed as DDDs/100 bed days, an increase of 8% was observed (from 49.6 to 53.8).
Hospital consumption did not significantly change in the 5 year period when expressed as DDDs/1000 inhabitants/day. The only ATC level 3 group that showed a significant change was an increasing trend in the consumption of macrolides, lincosamides and streptogramins (ATC group J01F) (Table 1) with a statistically significant increasing trend in the consumption of azithromycin (P = 0.02).
When expressed as DDDs/100 bed days, the trend in consumption of antibacterials for systemic use (ATC group J01) in the hospital sector statistically significantly increased with a statistically significant increasing trend in the consumption of penicillins (ATC group J01C), other β-lactam antibacterials (ATC group J01D), macrolides, lincosamides and streptogramins (ATC group J01F), quinolones (ATC group J01M) and other antibacterials (ATC group J01X) (Table 2).
Hospital consumption of antibacterials for systemic use (ATC group J01) at ATC group level 3 expressed as DDDs/100 bed days, 2016–20
| ATC group | 2016 (DDDs/100 bed days) | 2017 (DDDs/100 bed days) | 2018 (DDDs/100 bed days) | 2019 (DDDs/100 bed days) | 2020 (DDDs/100 bed days) | Trend (2019–20) | P | CAGR 2016–19 | Predicted 2020 (DDDs/100 bed days) | Difference between predicted and actual (DDDs/100 bed days) | Difference between predicted and actual (%) | Percentage change 2019–20 | Percentage change 2019–predicted 2020 | Difference between change 2019–20 and change 2019–predicted 2020 (%) |
|---|---|---|---|---|---|---|---|---|---|---|---|---|---|---|
| Tetracyclines (J01A) | 0.9 | 0.9 | 0.9 | 1.0 | 1.0 | 0.03 | 1.0 | 0.0 | −1.4 | 1.2 | 2.5 | −1.4 | ||
| Penicillins (J01C) | 11.3 | 11.7 | 12.5 | 13.4 | 13.1 | ↑ | 0.018 | 0.06 | 14.1 | −1.1 | −8.1 | −2.2 | 5.5 | −7.7 |
| Other β-lactams (J01D) | 12.6 | 14.1 | 13.9 | 14.9 | 16.8 | ↑ | 0.018 | 0.06 | 15.7 | 1.1 | 6.3 | 11.3 | 5.3 | 6.0 |
| first- and second-generation cephalosporins | 7.2 | 7.7 | 7.7 | 8.0 | 7.5 | −0.01 | 8.2 | −0.7 | −9.2 | −5.5 | 3.4 | −8.9 | ||
| third- and fourth-generation cephalosporins and carbapenems | 5.5 | 6.4 | 6.2 | 6.9 | 9.2 | ↑ | 0.045 | 0.08 | 7.5 | 1.6 | 18.7 | 25.0 | 7.8 | 17.2 |
| Sulphonamides and trimethoprim (J01E) | 1.0 | 0.9 | 1.0 | 1.0 | 1.0 | 0.00 | 1.0 | 0.0 | 3.7 | 3.6 | −0.1 | 3.7 | ||
| Macrolides (J01F) | 3.7 | 4.1 | 4.3 | 4.8 | 6.3 | ↑ | 0.024 | 0.09 | 5.3 | 1.0 | 15.8 | 22.7 | 8.2 | 14.5 |
| Aminoglycosides (J01G) | 2.3 | 2.3 | 2.3 | 2.3 | 2.3 | 0.00 | 2.3 | 0.0 | −0.7 | −0.8 | −0.1 | −0.7 | ||
| Fluoroquinolones (J01M) | 5.3 | 5.9 | 6.3 | 6.4 | 6.6 | ↑ | 0.015 | 0.07 | 6.9 | −0.3 | −3.8 | 2.5 | 6.1 | −3.6 |
| Other (J01X) | 4.2 | 4.9 | 6.3 | 5.8 | 6.7 | ↑ | 0.029 | 0.12 | 6.4 | 0.3 | 4.2 | 14.2 | 10.4 | 3.8 |
| glycopeptides | 0.8 | 1.1 | 1.2 | 1.3 | 1.6 | ↑ | 0.006 | 0.19 | 1.6 | 0.0 | −3.1 | 13.4 | 16.0 | −2.6 |
| polymyxins | 0.1 | 0.2 | 0.2 | 0.3 | 0.4 | ↑ | 0.017 | 0.26 | 0.4 | 0.1 | 17.2 | 34.3 | 20.7 | 13.6 |
| Total antibacterials for systemic use (J01) | 41.4 | 45.0 | 47.4 | 49.6 | 53.8 | ↑ | 0.001 | 0.06 | 52.7 | 1.1 | 2.0 | 7.8 | 5.9 | 1.9 |
Arrows indicate a statistically significant changing trend between 2016 and 2020, and the CAGR predicted consumption for 2020.
The significance of changes in 5 year trends in consumption of ATC level 3 groups of antibacterials for systemic use expressed as DDDs/100 bed days was not different when the CAGR-based predicted consumption for 2020 was considered instead of actual consumption in 2020.
The difference between actual and predicted AMC for 2020 was most prominent for penicillins (ATC group J01C), other β-lactams (consisting of cephalosporins, monobactams and carbapenems) (ATC group J01D) and macrolides (ATC group J01F) (Table 2 and Figure 1). The observed consumption of other β-lactams was higher than predicted for 1.1 DDDs/100 bed days (6.3%), with consumption of first- and second-generation cephalosporins being lower by 0.7 DDDs/100 bed days (9.2%) and consumption of third- and fourth-generation cephalosporins and carbapenems being higher by 1.6 DDDs/100 bed days (18.7%). The observed consumption of macrolides was higher than predicted for 1 DDD/100 bed days (15.8%). The change in AMC between 2019 and 2020 and the CAGR predicted change was greatest for third- and fourth-generation cephalosporins and carbapenems (17.2%), macrolides (14.5%) and polymyxins (13.6%). See Table 2 and Figure 1.
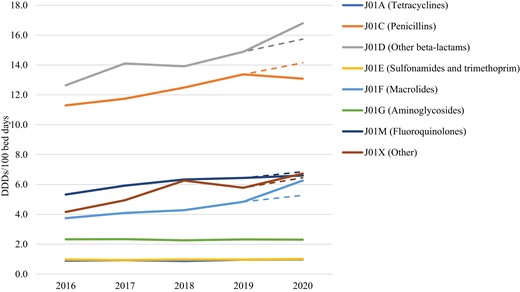
CAGR predicted and actual 5 year hospital consumption of antibacterials for systemic use (ATC group J01) in Croatia expressed as DDDs/100 bed days. CAGR predicted AMC for 2020 is presented by a dashed line for the respective ATC level 3 group. This figure appears in colour in the online version of JAC and in black and white in the print version of JAC.
Actual consumption of fluoroquinolones (ATC group J01M) was lower than predicted (3.6%), while the actual consumption of other antibacterials (ATC group J01X) was higher than predicted (3.8%). In this group the greatest difference between actual and predicted consumption was noted for polymyxins (17.2%) (Table 2).
Discussion
According to the ECDC Annual Epidemiological Report 2020,12 the total AMC of antimicrobials for systemic use in Croatia decreased between 2019 and 2020 by 17%, community consumption by 17% and hospital consumption by 13% when expressed as DDDs/1000 inhabitants/day.
A reduction in community consumption of antimicrobials may indicate that long-term antimicrobial stewardship activities directed toward GPs are yielding results. However, without patient-level data such a conclusion might be overestimated. A decrease in antimicrobial prescribing during the pandemic is most probably also a result of a decreased number of primary care visits and a lower frequency of seasonal respiratory tract infections due to non-pharmaceutical interventions aimed at reducing viral transmission. If that were the case, a reduced antimicrobial prescribing trend may indicate overprescribing of antibiotics for self-limiting viral infections in the pre-pandemic period.
In the hospital sector, there was no statistically significant changing trend observed in AMC (ATC group J01) when expressed as DDDs/1000 inhabitants/day. When ATC level 3 groups were analysed, there was a statistically significant increasing trend in the consumption of only one ATC level 3 group, caused by the increased consumption of one substance, azithromycin.
However, when consumption is expressed as DDDs/100 bed days, the changes in AMC considerably differ. The consumption of total antibacterials for systemic use (ATC group J01) has statistically significantly increased with a statistically significant increase in the consumption of five ATC level 3 groups.
The CAGR predicted consumption of antimicrobials reveals a changing pattern in the consumption towards more broad-spectrum antimicrobials. The predicted consumption of antimicrobials for 2020 differs substantially from the actual consumption of macrolides (ATC group J01F), third- and fourth-generation cephalosporins and carbapenems (ATC group J01D) and other antibacterials for systemic use (ATC group J01X), predominantly polymyxins. For these antimicrobial groups, the actual consumption was much higher than predicted. Interestingly, the predicted consumption of fluoroquinolones (ATC group J01M) was higher than actual consumption, while the predicted and actual consumption of penicillins (ATC group J01C) had divergent directions—a small increase was anticipated, but the actual consumption decreased.
High hospital consumption of antimicrobials during the pandemic is multifactorial. Antibiotics were prescribed to most COVID-19 patients because of fear of a bad outcome even though only a minority of them had a bacterial coinfection/superinfection. Based on the experience from the 2009 influenza pandemic, bacterial coinfections were a prognostic factor for worse outcomes;22 therefore, many guidelines, including the WHO guideline, recommended the use of empirical antibiotics in COVID-19 pneumonia.23 The first Croatian guidelines for the treatment of COVID-19 patients from March 2020 recommend antiviral/antibiotic therapy if there is a clinical suspicion or proven coinfection.24
In April 2020, a paper endorsed by the European Study Group for Antimicrobial Stewardship (ESGAP) stressed the importance of antimicrobial stewardship during the pandemic and proposed several recommendations and specific antibiotics to be used for therapy in COVID-19 patients. A β-lactam providing coverage for Streptococcus pneumoniae ± MSSA should be the first option (e.g. amoxicillin with clavulanic acid or third-generation cephalosporins). If atypical coverage is considered necessary, consideration should be given to doxycycline. Macrolides and fluoroquinolones should be avoided because of their side effects.25 The recommendations were not closely followed, as shown in a ‘snapshot’ study that was done at international level to analyse antibiotic prescribing practices in COVID-19 patients. A combination of β-lactams and macrolides or fluoroquinolones was reported by 52.4% of respondents, most often as ceftriaxone or cefotaxime in combination with a macrolide (26.7%).26
Even though the data are not uniform, most of the published papers have reported increased hospital consumption of antimicrobials for systemic use during the COVID-19 pandemic period when the indicator DDDs/100 bed days is used. Contrastingly, when the indicator DDDs/1000 inhabitants/day is used, the hospital AMC did not seem to be affected by the pandemic. The issue of AMC indicators has been a matter of discussion because different metrics are used across different countries, regions and individual healthcare settings.27
The results of our study suggest that the indicator DDDs/1000 inhabitants/day for measuring hospital AMC is not sensitive enough. The obvious reason for contradictory results regarding trends in AMC in hospitals when expressed using different indicators lies in the denominator. While the total population size was the same in the observed period, the number of patient beds or occupied bed days decreased due to the cancellation of non-essential medical services and surgeries for non-COVID-19 patients. The indicator DDDs/1000 inhabitants/day provides a rough estimate of the proportion of the population treated daily with antimicrobials. It is known that, when expressed as DDDs, only about 10% of total national antimicrobials are consumed in hospitals, but the hospital environment differs substantially from the community. The density of antimicrobial use in hospitals is much higher and patients are in close spatial proximity, contributing to the increased risk of development and spread of resistant microorganisms. When assessing hospital AMC, the population under surveillance should be relevant for healthcare context and represent only hospitalized patients. Only in that way may variations in AMC be captured well enough to tailor stewardship activities.
The WHO Collaborating Centre for Drug Statistics Methodology recommends the indicator DDDs/100 bed days for measuring hospital AMC.21 The main advantage in using ATC/DDD methodology is the ability to compare data at international, national, hospital and ward levels, and efforts should be made to use the methodology correctly to increase the accuracy of the results. In the ESAC-Net annual reports on AMC in the EU/EEA, the indicator DDDs/1000 inhabitants/day is used to report AMC both for the community and the hospital sector because uniformly defined denominator data on the total number of hospital occupied bed days are currently unavailable for all EU/EEA countries.12
In conclusion, the results of this study revealed a changing pattern and increasing trend in hospital AMC during the pandemic (especially broad-spectrum antimicrobials) requiring further qualitative analysis based on patient-level data. It is important to emphasize that the increase is only apparent when an adequate denominator is used.
As antimicrobial stewardship remains one of the most important strategies to tackle antimicrobial resistance, antimicrobial surveillance methods must be as sensitive as possible.
Efforts should be made to collect valid data on the number of hospital bed days at national level from all EU/EEA countries to meet one of the major ESAC-Net objectives, which is to help national antimicrobial stewardship activities by providing comparable consumption data from both sectors.
The true impact of increasing hospital AMC on antimicrobial resistance in Croatia and elsewhere will be seen in the near future.
Funding
The study was supported by internal funding.
Transparency declarations
None to declare.
