


Abstract
Fosfomycin is used increasingly in the treatment of MDR bacteria. It is eliminated by renal excretion, but data regarding dosing recommendations for patients undergoing modern means of renal replacement therapies are scarce.
Evaluation of the pharmacokinetics (PK) of fosfomycin in patients undergoing prolonged intermittent renal replacement therapy (PIRRT) to guide dosing recommendations.
Fosfomycin was given in 11 (7 female) patients with severe infections undergoing PIRRT. Plasma levels were measured at several timepoints on the first day of fosfomycin therapy, as well as 5–6 days into therapy, before and after the dialyser, to calculate its clearance. Fosfomycin was measured in the collected spent dialysate.
The median (IQR) plasma dialyser clearance for fosfomycin was 183.4 (156.9–214.9) mL/min, eliminating a total amount of 8834 (4556–10 440) mg of fosfomycin, i.e. 73.9% (45.3%–93.5%) of the initial dose. During PIRRT, the fosfomycin half-life was 2.5 (2.2–3.4) h. Data from multiple-dose PK showed an increase in fosfomycin Cmax from 266.8 (166.3–438.1) to 926.1 (446.8–1168.0) mg/L and AUC0–14 from 2540.5 (1815.2–3644.3) to 6714 (4060.6–10612.6) mg·h/L. Dialysis intensity during the study was 1.5 L/h. T>MIC was 100% in all patients.
Patients undergoing PIRRT experience significant fosfomycin elimination, requiring a dose of 5 g/8 h to reach adequate plasma levels. However, drug accumulation may occur, depending on dialysis frequency and intensity.
Introduction
Fosfomycin is a representative of the epoxide family of antimicrobial drugs, initially called phosphonomycin. Fosfomycin had been isolated from cultures of Streptomyces fradiae found in a soil sample in the vicinity of Alicante, Spain.1 On 3 October 1969, a publication in Science described the in vivo activity of fosfomycin in mice for the first time.2 It effectuates bactericidal activity against various Gram-positive, Gram-negative and anaerobic pathogens by inhibition of peptidoglycan synthesis, causing a destruction of the inner bacterial cell wall by inhibition of the enzyme UDP-N-acetylglucosamine-enolpyruvyl transferase (MurA enzyme).3 The drug has a molecular weight of 138 Da, protein binding of less than 10% and a volume of distribution of 0.2–0.4 L/kg. Fosfomycin can easily penetrate into several body compartments such as lung, bone, muscle, soft tissue, cerebrospinal fluid, wound exudate, heart and eye.4 Consistently, fosfomycin as a broad-spectrum, bactericidal antibiotic has its utilization in severe infections including those with MDR bacteria, e.g. ESBL-producing pathogens.5,6 Fosfomycin is not metabolized, but eliminated mainly by the kidneys (90%–95%) in an unchanged form. Therefore, its half-life (t½) is highly dependent on the glomerular filtration rate. In patients with renal insufficiency, the dose must be adjusted to the degree of renal impairment.4 Hence, the regular dose of 12 to 24 g per day should be reduced by up to 80% in severe kidney disease, with an increased initial loading dose to achieve plasma levels of the epidemiological cut-off value (ECOFF) of 32 mg/L.7 Having a low molecular weight, fosfomycin can easily be dialysed, as shown in several publications from 1977 to 1985 with former kidney replacement therapy (KRT) methods.8,9 Appropriate dosage of antibiotics is essential in renal failure, on the one hand to treat the underlying infection effectively and on the other hand to avoid renal toxicity. Data on the elimination of fosfomycin during prolonged intermittent renal replacement therapy (PIRRT), an increasingly popular KRT modality, are scarce.10
The renaissance of fosfomycin is due to its in vitro and in vivo activity against a wide range of MDR as well as XDR bacteria.11 These infections can frequently be found in both chronic dialysis patients and critically ill patients with acute kidney injury (AKI) requiring renal replacement therapy.
The aim of this study was to investigate the single- and multiple-dose pharmacokinetics (SD-PK and MD-PK) of fosfomycin in patients with severe renal failure under PIRRT with the GENIUS® dialysis system to guide dosing recommendations in this patient population.
Patients and methods
Ethics
The study was approved by the local Ethics Committee (#2811) and conducted in accordance with the Declaration of Helsinki and German federal guidelines. Written informed consent was obtained from all patients or their legal representatives.
Study design
This prospective, observational, multi-centre study included patients >18 years of age with the need for renal replacement therapy due to AKI or chronic kidney disease (CKD) and treated with PIRRT. Patients were eligible for the study if IV fosfomycin therapy was started. Drug dosing was guided by local recommendations, but total dose was at the discretion of the treating physician. Intense PK measurement of fosfomycin plasma levels was intended for every patient on the first day of fosfomycin therapy (single-dose kinetics) and 5–7 days into systemic fosfomycin therapy (multiple-dose kinetics), depending on the dialysis regimen of every patient. Plasma samples were drawn from established IV catheters other than those used for the infusion of fosfomycin at defined timepoints, according to the protocol.
PIRRT
PIRRT was performed using the GENIUS® 90 batch dialysis system (Fresenius Medical care®, Bad Homburg, Germany) with a polysulfone low-flux dialyser (1.7 m2 surface area, Polyflux 17 L Gambro®) or a polysulfone high-flux dialyser (1.4 m2 surface area, FX 60 Fresenius Medical Care®, Bad Homburg, Germany; or 1.7 m2 surface area, Polyflux 170 H Gambro®, Lund, Sweden).
Fosfomycin administration and blood samples
During the measurement of single- and multiple-dose kinetics, fosfomycin was given over 30 min with a dose of 5 g (3 g in one patient). PIRRT was started 8.5 h after the first and directly after the second fosfomycin infusion of the day. Venous blood samples (lithium heparin samples, 7.5 mL) were collected at defined timepoints before, during and after the dialysis procedure: 0.5, 1, 1.5, 2.5, 4.5 and 6.5 h after the first fosfomycin administration, before the start of dialysis and 0.5, 2, 4 and 6 h after the beginning of the dialysis. This sampling schedule was followed for the multiple-dose kinetics as well (Figures S1 and S2 and Table S1, available as Supplementary data at JAC Online).
Additional samples were taken before and after passage through the dialyser to calculate the dialyser clearance. Furthermore, samples of the dialysate after air insufflation were taken in all patients, as described previously.12 The blood samples were centrifuged for 10 min at 2500 g. Subsequently, the plasma obtained was frozen at −80°C and stored until analysis.
Fosfomycin analysis
The measurement of fosfomycin concentration in the obtained samples was performed in the Institute of Clinical Pharmacology of the Otto-von-Guericke University Magdeburg (Prof. Bode-Böger) by LC-MS/MS analysis. Fosfomycin was determined with an Agilent 1100 system (Waldbronn, Germany) as HPLC in an AtlantisTM HILIC silica column with 5 μm particle size (Waters, Eschborn, Germany). The column was protected by a SecurityGuard system (Phenomenex, Aschaffenburg, Germany). The analytes were detected by a Thermo Fisher Scientific (Waltham, MA, USA) TSQ Discovery Max triple quadrupole mass spectrometer, equipped with an electrospray ionization (ESI) ion source. System control and data handling were carried out by Thermo Electron Xcalibur software. The plasma samples of 10 μL were replenished with water, buffer solution and acetonitrile. The prepared samples were injected into the analytical column (HILIC method). Fosfomycin eluted at 7.2 min. The mobile phase flow from the HPLC system was analysed with MS and recorded for quantification. The lower limit of quantification was 15 mg/L and the upper limit of quantification was 750 mg/L. Samples that were initially measured as above the upper limit of quantification were diluted and measured again. This method was validated according to the guidelines for bioanalytical method validation published by the FDA (May 2018, www.fda.gov). Validation of the precision and accuracy of this method was shown, according to accepted requirements.13
Statistical analysis
Statistical analysis was performed using GraphPad Prism 9 (San Diego, CA, USA) and R version 3.6.2 (R Foundation for Statistical Computing, Vienna, Austria). Data are reported as median (IQR) unless otherwise stated. AUC was calculated using the trapezoidal rule.
Blood samples taken at defined timepoints showed plasma peak levels (Cmax) directly after infusion, with continuously reduced plasma concentrations over time. Elimination t½ was calculated from the Cmax values and the concentration at 4 and 6 h with and without renal replacement therapy. The dialyser clearance (CLdial) was determined from concentration before (Cin) and after (Cout) the dialysis membrane of the Genius system and the blood flow (F) with the formula: CLdial = (Cin − Cout)/Cin × F. The total amount of fosfomycin in the collected dialysate was calculated from the concentration in the dialysate and the total quantity of the basin.
Results
Data from 11 patients [7 female; median (IQR) age = 63 (59–77) years; BMI = 32.7 (24.2–38.3) kg/m2] were analysed. The Charlson comorbidity index was 8 (7–9) and four patients were dependent on dialysis due to AKI. Hospital mortality was 36%. The patient characteristics are presented in Table 1. Dialysis time was 360 (311–363) min, thus clearing a blood volume of 89 (72–91) L per treatment. Blood and counter-current dialysate flow were 250 (235–250) mL/min. Four patients were eligible to receive a second study treatment after 5 or 6 days (multiple-dose kinetics). These patients received a median (IQR) dialysis dose of 1.5 (1.2–1.8) L/h over the study period. All other included patients were not eligible for MD-PK due to death, transferral to another hospital or fosfomycin discontinuation.
Patient and treatment characteristics of the study cohort, N = 11
| Characteristic | |
|---|---|
| Age (years), median (IQR) | 63 (59–77) |
| Female, n (%) | 7 (64) |
| Weight (kg), median (IQR) | 99 (69–108) |
| Height (cm), median (IQR) | 168 (165–175) |
| BMI (kg/m2), median (IQR) | 32.7 (24.2–38.3) |
| Charlson comorbidity index, median (IQR) | 8 (7–9) |
| SOFA score, median (IQR) | 5 (4–8) |
| ICU treatment, n (%) | 3 (27) |
| AKI, n (%) | 4 (36) |
| Residual diuresis (mL/day), median (IQR) | 500 (0–1000) |
| Death during hospital stay, n (%) | 4 (36) |
| Dialysis dose (L/h), median (IQR) | 1.5 (1.2–1.8) |
| Treatment time (min), median (IQR) | 360 (311–363) |
| Volume of ultrafiltration (mL), median (IQR) | 1550 (1188–2288) |
The plasma peak level (Cmax1) was 207.4 mg/L when 3 g fosfomycin was given in one patient; at a dose of 5 g fosfomycin, the median (IQR) Cmax1 was 266.8 (166.3–438.1) mg/L. Figures 1 and 2 summarize the time course of fosfomycin plasma levels during SD-PK and MD-PK.
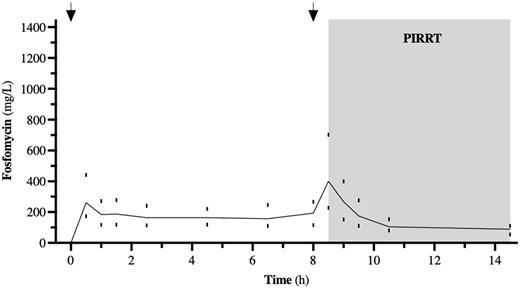
Time course of fosfomycin during SD-PK. The dosing intervals are marked by arrows. Data from n = 11, represented by median (IQR).
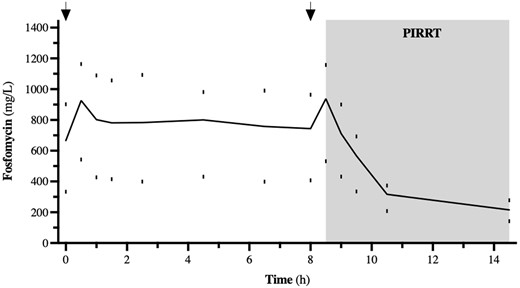
Time course of fosfomycin during MD-PK. The dosing intervals are marked by arrows. Data from n = 4, represented by median (IQR).
The t½ of the plasma concentration of fosfomycin was 7.3 (4.6–10.9) h before the dialysis. During PIRRT, the t½ was reduced to 2.5 (2.2–3.4) h. The dialyser clearance of fosfomycin with the polysulfone high-flux dialyser (1.4 m2 surface area, FX 60 Fresenius Medical Care®) was 159.9 (147.8–180.4) mL/min and using the polysulfone high-flux dialyser (1.7 m2 surface area, Polyflux 170 H Gambro®) it was 213.7 (197.7–226.5) mL/min, whereas the dialyser clearance for fosfomycin with the low-flux dialyser (1.7 m2 surface area, Polyflux 17 L Gambro®) was 169.1 (136.1–200.7) mL/min. The total amount of fosfomycin in the collected dialysate was 73.9% (45.3%–93.5%) of the initial dose, based on the amount of the drug obtained from the collected spent dialysate. The PK data of the patients are demonstrated in Table 2.
PK key data of our study population
| Parameter | Median (IQR) |
|---|---|
| Single dose (Day 1) | |
| Cmax1 (mg/L) | 260.8 (175.9–433.6) |
| Cmax2 (mg/L) | 373.2 (219.0–515.5) |
| AUC0–14 (mg·h/L) | 2540.5 (1815.2–3644.3) |
| Multiple dose (Days 5–6) | |
| Cmax1 (mg/L) | 926.1 (446.8–1186.0) |
| Cmax2 (mg/L) | 937.8 (422.2–1175.0) |
| AUC0–14 (mg·h/L) | 6714 (4060.6–10 612.6) |
| CLdial (mL/min) | 183.4 (156.9–214.9) |
| Drug amount in dialysate (mg) | 8334 (4556–10 440) |
| Fosfomycin daily dose (g/day) | 10 (10–15) |
Cmax1 represents the peak concentration after the first and Cmax2 after the second infusion during PK measurement. AUC0–14 is the AUC during the investigated period.
Discussion
Appropriate anti-infective therapy with adequate dosage of antibiotics in critically ill patients is meaningful to avoid over- or underdosing. Overdosing leads to toxic effects and underdosing causes therapy failure. Adequate dosing will likely increase the probability of clinical cure from infection and will suppress the emergence of resistant pathogens. Suboptimal antibiotic usage is a possible contributor to poor outcome in treating critically ill patients.14 Recent anecdotal PK reports indicated significant elimination of fosfomycin by modern dialysis techniques, such as PIRRT, up to over 100% of the administered daily dose.15 Therefore, fosfomycin dosing regimens as in normal renal function may be needed during daily PIRRT.
To the best of our knowledge, our data represent the first analysis comparing fosfomycin PK before and during PIRRT, i.e. the GENIUS® dialysis system. Fosfomycin has been known for more than 50 years and is currently experiencing a renaissance.16 Fosfomycin is effective in MDR bacterial infection as well as difficult-to-treat infections and has attractive PK properties, but it may accumulate in renal failure since it is eliminated almost exclusively by the renal route. Dose adjustments are recommended in renal failure, according to creatinine clearance, reducing daily dosage and/or the number of administrations in pre-dialysis patients. There are few fosfomycin dosing recommendations under renal replacement therapy.
Fosfomycin dosing is a challenge in patients with renal replacement therapy, especially in unstable clinical situations, as present in patients in ICUs. The existing dosing recommendations in patients undergoing renal replacement therapy are based on limited data, particularly in patients with modern renal replacement therapy, such as PIRRT with the GENIUS® dialysis system.
In the past, fosfomycin PK were investigated by microbiological measurement methods, with low specificity and error rates of about one third,17 or by chromatography.18 We overcame this problem with the new method of LC-MS/MS.13
Our data show that the t½ of fosfomycin plasma concentration in renal failure is significantly prolonged, but during haemodialysis with the GENIUS® dialysis system it resembles that of healthy subjects.14 Low protein binding facilitates removal by renal replacement therapy and therefore results in larger clearances of those potentially lifesaving drugs.19 The plasma concentrations of fosfomycin in patients with renal replacement therapy vary with dosing of fosfomycin and duration of the dialysis procedure.
PK/pharmacodynamic (PD) properties of fosfomycin are not fully understood. Data suggest bactericidal time-dependent activity against Gram-positive bacteria, but concentration-dependent activity against Escherichia coli is also described in the literature.20 Therefore, %T>MIC and AUC24/MIC should be the best PD indicators for fosfomycin therapy. A recent animal study suggests that an AUC24/MIC target of 9–43 is associated with improved survival in E. coli infections.21 Other studies often use a %T>MIC of >70% to indicate PD target attainment.22 We achieved a %T>MIC of 100% in every patient in this study and extrapolated AUC/MIC ratios (for ECOFFs of 32 mg/L) of 135 on the first treatment day. Additionally, we measured an accumulation of fosfomycin plasma levels in our MD-PK with a 2- to 3-fold increase of Cmax and AUC levels. However, the dialysis dose in the enrolled patients was rather low for PIRRT modality, which may explain this finding. In fact, we noticed a non-significant trend towards a negative correlation of dialysis intensity and multiple-dose AUC values (r2 = 0.65, P = 0.09; Figure S3). Correlation of the highly variable Cmax plasma levels and the adjusted body weight was not significant (Figure S4). We did not see significant sodium increase during the study period in these patients nor any other possibly related adverse events. In general, a possible complication of underdosed anti-infective therapy may be emerging drug-resistant pathogens. In vitro data suggest frequent, mostly drug transport-affecting, mutations after fosfomycin administration as standalone therapy. Interestingly, these mutants may have lost fitness, at least in urinary tract infections. However, MurA-driven fosfomycin resistance is described and may lead to increased drug MICs in these strains.3
We must state some limitations of our study. Optimal plasma concentrations of anti-infectives are not well known in different settings, especially in prolonged intensive care therapy.14 Only intermittent infusion of fosfomycin was investigated. Continuous infusion with normal dosing during dialysis treatment and steady dose adjustments may be a beneficial alternative.
However, our data suggest that 5 g/8 h of fosfomycin should be given on PIRRT days with the GENIUS® dialysis system as an initial anti-infective therapy. Fosfomycin is eliminated to a significant amount, therefore the dose should be replenished at the end of each dialysis session. After full initial therapy, dose adjustment according to the severity of kidney failure, as well as dialysis intensity, should be carried out, especially on non-dialysis days. Therapeutic drug monitoring during fosfomycin therapy in patients receiving PIRRT seems advisable, due to the high variance of drug levels measured in our study.
Funding
This work was supported by the ‘HILF’ programme of the Hannover Medical School.
Transparency declarations
J.J.S. and J.T.K. received a congress travel grant from InfectoPharm Arzneimittel und Consilium GmbH; J.J.S. has received funds from the ‘HILF’ programme of the Hannover Medical School to support the project. All other authors: none to declare.
Author contributions
L.K.V.G., J.J.S. and J.T.K. designed and performed the study. Fosfomycin measurements were performed by S.M.B.-B. and J.M.-L. All authors participated in writing and editing the manuscript.
Supplementary data
Table S1 and Figures S1 and S2 are available as Supplementary data at JAC Online.
References
EUCAST. Fosfomycin: rationale for the EUCAST clinical breakpoints.
Author notes
Lisa K. V. Gerecke and Julius J. Schmidt contributed equally and should be considered first authors.
