


Abstract
The emergence of antibiotic-resistant species calls for fast and reliable phenotypic susceptibility testing to adapt clinical management as fast as possible.
We assessed the real-life performance of EUCAST rapid antimicrobial susceptibility testing (RAST) and analysed its impact on patient management.
RAST was performed on clinical blood cultures containing Escherichia coli, Klebsiella pneumoniae, Pseudomonas aeruginosa or Acinetobacter baumannii complex. Categorical agreement with VITEK2 was analysed. A pre-post quasi-experimental observational study was designed to compare antibiotic treatment in sepsis patients in the RAST patient group (n = 51) and a historical control cohort (n = 54).
In total, 436 isolates, corresponding to 2314 disc diameters, were measured; 18.4% of these measurements were in the area of technical uncertainty. For the 81.6% categorical results, which could be compared, 94.7% were in agreement, whereas 5.3% of the results were not. In the RAST group, optimal therapy was initiated on the same day as blood culture positivity, while this was the case in the historical group after 24 h. In six cases, RAST allowed for rapid antibiotic escalation. The 30 day mortality rate was lower in the RAST group, although this was not statistically significant.
RAST provides a reliable tool to improve clinical management of sepsis patients by providing rapid phenotypic susceptibility data. While not necessarily being an instrument for de-escalation, especially in areas of low prevalence, early detection allows for timely coverage of resistant isolates. Thus, RAST significantly adds to successful antibiotic stewardship programmes.
Introduction
The emergence of bacterial multiresistance, especially in Gram-negative organisms, is an ever-increasing worldwide threat to human health and life. This is especially relevant in critically ill patients with bloodstream infections (BSIs).1,2 A delay in appropriate antimicrobial treatment is associated with an increase in mortality and other unfavourable outcomes.3 Reducing the time to identification and susceptibility testing of BSI-causing organisms is an essential prerequisite to speed up targeted antimicrobial therapy.4 While rapid identification of bacteria from positive blood cultures is possible by employing molecular assays (e.g. Filmarray, Verigene) or whole-cell MS,5 rapid and precise determination of antimicrobial susceptibility from positive blood cultures is much more difficult to achieve. In clinically relevant Gram-positive BSI pathogens, such as Staphylococcus aureus and Enterococcus faecium, the detection of molecular determinants of specific resistance phenotypes (e.g. mecA or vanAB) allows for rapid prediction of resistance with a turnaround time of about 1 h (i.e. methicillin or vancomycin resistance, respectively).6 The multifactorial character of Gram-negative multiresistance impedes reliable prediction of the resistance phenotype solely on the presence or absence of genetic determinants. In fact, it has been shown that carbapenem resistance in Enterobacterales and Pseudomonas aeruginosa is unrelated to carbapenemase production in a significant proportion of clinical isolates.7 Thus, in Gram-negative BSI, phenotypic resistance testing is essential.
Conventional antimicrobial susceptibility testing (AST) requires a defined inoculum from a pure culture and an overnight incubation step.8 Consequently, such techniques do not fulfil the requisites of fast AST. In order to reduce AST turnaround times, several alternative methods have been proposed, including the introduction of automated phenotypic systems, e.g. the VITEK2 system (bioMérieux) and the Accelerate Pheno System (Accelerate Diagnostics), and the implementation of novel approaches to AST using short incubation times.
Recently, EUCAST has defined a methodology of disc diffusion rapid AST (RAST), which is performed directly from positive blood culture bottles with breakpoints for short incubations of 4, 6 and 8 h.9
Our study evaluates the real-life performance of RAST in a tertiary care hospital in Germany by prospective comparison of the categorical agreement of 436 Gram-negative isolates from patients with a BSI against our current standard of care (cSOC), VITEK2. Furthermore, we assessed the clinical impact of RAST on the optimization of the antibiotic regimen in 51 patients with Gram-negative BSI compared with a historical group of 54 preceding the introduction of this new diagnostic method.
Methods
Study setting
The study was conducted at the University Medical Center Hamburg-Eppendorf, Germany, a 1700 bed tertiary care university hospital. Analytical performance of RAST was evaluated between 1 February 2019 and 31 March 2020 (Figure 1). In parallel, to test the relevance of RAST for clinical decision-making, a pre-post quasi-experimental observational study setting was set up in which two patient groups with Gram-negative BSI [RAST analysis versus historical standard of care (hSOC)] were compared. Patients were prospectively assigned to the RAST group from 1 May to 31 July 2019 (Figure 1). The RAST group was compared with a historical control group for which preliminary AST was available at the earliest 24 h after blood culture positivity, from 1 January to 31 March 2018 (Figure 1). In both time periods, all patients with E. coli, Klebsiella pneumoniae, P. aeruginosa or A. baumannii complex BSI were included. Patients were excluded if information on the antimicrobial therapy since the blood culture positivity was not available for a minimum of 30 days of follow-up.
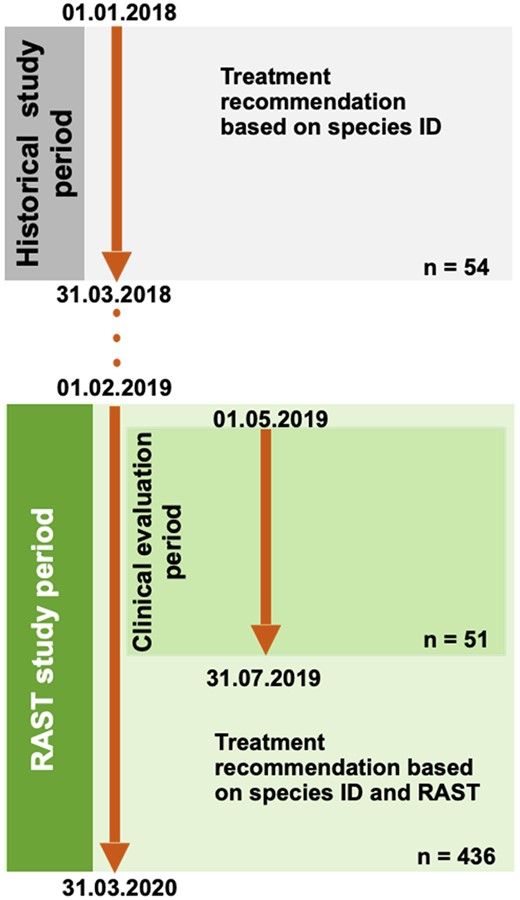
Study timeline. Technical RAST evaluation compared with cSOC (VITEK2) was performed between 1 February 2019 and 31 March 2020 (n = 436). Embedded into this period, the clinical impact of recommendations for treatment optimization based on MALDI-TOF MS differentiation from short cultures and RAST results was evaluated (1 May 2019 to 31 July 2019; n = 51). Time to defined treatment changes was compared with a reference period (historical study period: 1 January 2018 to 31 March 2018), during which treatment recommendations were based on direct species ID from positive blood cultures (n = 54 cases). For details, please see the Methods section. This figure appears in colour in the online version of JAC and in black and white in the print version of JAC.
For the RAST group, immediate information on optimal antimicrobial therapy (for definition see below) based on RAST results was communicated by the microbiologist to the clinician. In the historical group, microbiologists suggested empirical treatment based on species identification by MALDI-TOF MS directly from positive blood culture bottles and considering the local epidemiology of drug-resistant isolates. Preliminary susceptibility testing (see below) was used as a basis for potential changes of antibiotic treatment 1 day after blood culture positivity.
Blood culture diagnostics
Blood culture bottles (Bactec Plus aerobic/anaerobic; BD, Heidelberg, Germany) were incubated in a BD Bactec Fx instrument (BD, Heidelberg, Germany) at 37°C. Bottles that flagged positive were removed and a Gram stain was performed, which then guided downstream processing.
Processing of specimens growing Gram-negative bacilli
hSOC
From blood culture bottles growing Gram-negative bacilli, one drop (about 40 μL) was applied to a blood agar and to a McConkey agar plate (Oxoid, Basingstoke, UK) and incubated at 37°C under ambient conditions. From the bacterial growth, a sub-culture was made, which was analysed by the VITEK2 system, as described below.
When VITEK2 could not be used, due to laboratory working hours, we performed overnight 12 disc diffusion AST to gain preliminary results, as proposed by EUCAST.10 For this, 1000 μL of the blood culture solution was diluted in 1000 μL of sterile NaCl (0.9%). A cotton swab was wetted with the solution and streaked onto a Mueller–Hinton agar plate (Oxoid, Basingstoke, UK). Twelve antibiotic discs were placed on the agar (all from BD, Heidelberg, Germany): piperacillin/tazobactam (30/6 μg), ceftazidime (10 μg), cefotaxime (5 μg), meropenem (10 μg), imipenem (10 μg), ciprofloxacin (5 μg), ampicillin (10 μg), ampicillin/sulbactam (10/10 μg), piperacillin (30 μg), ertapenem (10 μg), gentamicin (10 μg) and trimethoprim/sulfamethoxazole (1.25/23.75 μg). After overnight incubation at 37°C under ambient conditions the inhibition zone diameters were read and preliminarily interpreted according to the latest EUCAST breakpoints.8
cSOC
From blood culture bottles growing Gram-negative bacilli, one drop (about 40 μL) was applied to a chocolate agar plate (Oxoid, Basingstoke, UK) and incubated for at least 4 h at 37°C in 5% CO2. This short culture was used to perform pathogen identification via MALDI-TOF MS (Bruker Daltonics) and to inoculate a saline solution to a turbidity equivalent to that of a 0.5 McFarland standard, which was then analysed by the VITEK2 system, using the VITEK2 AST-N223 card.
RAST protocol
RAST was performed according to the EUCAST protocol every day of the week between 8 am and 1 pm. In short, 100–150 μL of blood culture broth was streaked onto a Mueller–Hinton agar plate (Oxoid, Basingstoke, UK). Five antibiotic discs (all from BD, Heidelberg, Germany) were placed on the plate: piperacillin/tazobactam (30/6 μg), ceftazidime (10 μg), cefotaxime (5 μg), meropenem (10 μg) and ciprofloxacin (5 μg). After 4, 6 or 8 h of incubation at 37°C and under ambient conditions the inhibition zone diameters were read and interpreted according to the species-specific EUCAST RAST breakpoints.11
The results of RAST were compared with the cSOC results and described as categorical agreement, minor error (mEm; VITEK2 intermediate result, but measured as susceptible or resistant by RAST), major error (MEm; VITEK2 susceptible result, but resistant by RAST) and very major error (VMEm; VITEK2 resistant result, but susceptible by RAST). To indicate that RAST results were herein compared with results of an automated susceptibility testing system and not to a standard reference method (i.e. micro broth dilution), categories are marked with a subscript m, which denotes modified. Furthermore, results lying in the area of technical uncertainty (ATU) were also reported.
Clinical impact evaluation
In the RAST group, immediate information on optimal antimicrobial therapy based on RAST results was communicated by the microbiologist to the clinician. In the historical group, microbiologists suggested empirical treatment considering species identification by MALDI-TOF MS and the local epidemiology of drug-resistant isolates, while preliminary susceptibility data for this group were available only after overnight incubation.
The primary objective of analysing RAST and hSOC groups was to compare the proportion of patients receiving optimal treatment in both groups after communication of blood culture positivity, while the second objective was to compare the adequate and inadequate treatment. Optimal treatment was defined as the use of an antimicrobial substance with the narrowest possible spectrum of action and minimal collateral effects on the intestinal microbiota, taking into account indications and contraindications (according to local and international recommendations for the treatment of infectious diseases). Adequate antimicrobial therapy was defined as the use of an antimicrobial for which in vitro activity against the infecting microorganism was proven, while therapy was defined as inadequate if the identified organism was not covered. De-escalation was defined as a change from a broad-spectrum antimicrobial therapy to an antibiotic with less broad-spectrum coverage, whereas escalation was defined as a change to a broad-spectrum antimicrobial therapy from an antibiotic with less broad-spectrum coverage.
The following data were recorded by chart review: demographics, comorbidities, Charlson comorbidity index, origin of BSI, duration of the antimicrobial treatment administrated before and after report of blood culture positivity (empirical and targeted treatment), length of stay and 30 day mortality.
Statistical analysis
Categorical variables were analysed by χ2 test or Fisher’s exact test, as appropriate, and continuous variables were analysed by Student’s t-test or the Mann–Whitney test, depending on data distribution. A two-sided P value <0.05 was considered statistically significant for all tests. Statistical analysis was performed using STATA 15.0 (StataCorp, College Station, TX, USA).
Ethics
According to the Ethics Committee of the Hamburg Chamber of Physicians, no informed consent was required for the collection, analysis and publication of these data for this non-interventional study because of previous anonymization. STROBE guidelines were followed.
Quality control
The EUCAST quality control procedure was performed regularly once per week to control the performance of the diffusion discs and the agar used, with E. coli ATCC 25922 and P. aeruginosa ATCC 27853. Furthermore, VITEK2 quality control was performed with the AST-N223 card with E. coli ATCC 25922, E. coli ATCC 35218 and K. pneumoniae ATCC 700603. Additionally, RAST quality control was performed once, as proposed by Akerlund et al.12
Results
Between 1 February 2019 and 31 March 2020, 6507 blood cultures flagged as positive. Overall, the cultures revealed 5131 Gram-positive pathogens, 1732 Gram-negative pathogens and 328 fungi. Five hundred and ninety-nine blood culture bottles grew more than one pathogen. From blood cultures growing Gram-negative bacilli in pure culture, 726 organisms were identified as E. coli (41.9%), 213 as K. pneumoniae (12.3%), 134 as P. aeruginosa (7.7%) and 18 as A. baumannii complex (1.0%). Of those, a total of 436 non-copy isolates from 427 patients were included in this study (E. coli, n = 304; K. pneumoniae, n = 77; P. aeruginosa, n = 47; A. baumannii complex, n = 8). Exclusion of isolates (n = 655) related to several reasons, e.g. blood culture positivity outside of RAST operating hours, presence of additional positive blood cultures (i.e. copy isolates) and erroneous RAST reading (e.g. non-adherence to reading timepoints) (Figure 2).
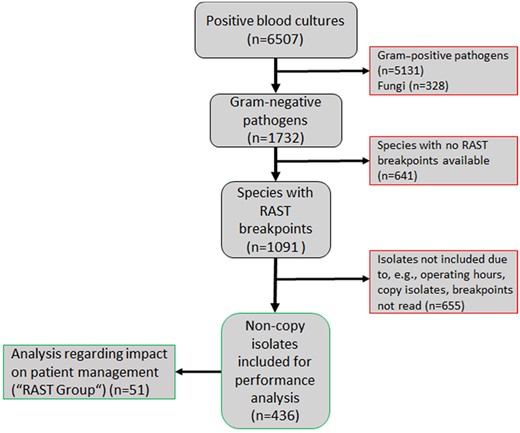
Flow chart, showing the inclusion of Gram-negative isolates. This figure appears in colour in the online version of JAC and in black and white in the print version of JAC.
The mean time to positivity for blood cultures included in the study was 15.8 h (SD = 14.7 h; range = 1.8–120.1 h; IQR = 9.6–15.6 h; median = 11.4 h).
Performance of RAST compared with VITEK2
In comparison with VITEK AST the overall number of isolates correctly tested by RAST was moderate (77.2%), although discordant results were low (2.1%, 1.6% and 0.6% for mEm, MEm and VMEm, respectively). A further investigation overall revealed a strikingly high rate of disc diameters falling into the ATU category (18.4%) (Table 1).
RAST categorical agreement versus VITEK2 by species and incubation time
| Categorical agreement (%)a | ||||||||||
|---|---|---|---|---|---|---|---|---|---|---|
| E. colib (n = 304) | K. pneumoniaeb (n = 77) | P. aeruginosac (n = 47) | A. baumanii complexd (n = 8) | |||||||
| Incubation time (h) | 4 | 6 | 8 | 4 | 6 | 6 | 8 | 4 | 6 | total (n = 436) |
| Correct | 876/1124 (78.0%) | 452/594 (76.1%) | 48/61 (78.7%) | 218/298 (73.2%) | 93/123 (75.6%) | 75/85 (88.2%) | 13/17 (76.5%) | 8/8 (100%) | 4/4 (100%) | 1787/2314 (77.2%) |
| mEm | 24/1124 (2.1%) | 12/594 (2.0%) | 3/61 (4.9%) | 6/298 (2.0%) | 3/123 (2.4%) | 0 | 0 | 0 | 0 | 48/2314 (2.1%) |
| MEm | 16/1124 (1.4%) | 9/594 (1.5%) | 0 | 7/2 98 (2.3%) | 2/123 (1.6%) | 3/85 (3.5%) | 0 | 0 | 0 | 37/2314 (1.6%) |
| VMEm | 3/1124 (0.3%) | 4/594 (0.7%) | 0 | 5/298 (1.7%) | 0 | 3/85 (3.5%) | 0 | 0 | 0 | 15/2314 (0.6%) |
| ATU | 205/1124 (18.2%) | 117/594 (19.7%) | 10/61 (16.4%) | 62/298 (20.8%) | 25/123 (20.3%) | 4/85 (4.7%) | 4/17 (23.5%) | 0 | 0 | 427/2314 (18.4%) |
Referring to readable zone diameters.
Tested for: piperacillin/tazobactam, cefotaxime, ceftazidime, meropenem and ciprofloxacin.
Tested for: ceftazidime, meropenem and ciprofloxacin.
Tested for: meropenem and ciprofloxacin.
To understand whether this phenomenon could be substance- or species-dependent, the ATU category was further analysed. Especially for E. coli, the majority of results leading to ATU results are related to poor performance of piperacillin/tazobactam, irrespective of the incubation time (69.8%, 68.4% and 70% after 4, 6 and 8 h, respectively). For K. pneumoniae, the results were slightly better; however, the percentage of ATU results caused by piperacillin/tazobactam was 50.0% at 4 h and 48.0% at 6 h (Figure 3). Intriguingly, exclusion of piperacillin/tazobactam results from the analysis resulted in a relevant increase in correctly measured disc diameters (E. coli: 91.5%, 89.7% and 91.7% at 4, 6 and 8 h, respectively; K. pneumoniae: 82.7% and 84.2% at 4 and 6 h, respectively). Rates of mEm also decreased, whereas other error rates remained mostly unchanged. Notably, regardless of including or excluding piperacillin/tazobactam test results, the number of correctly interpreted disc diameters did not change over time in this study, as reported by others.9
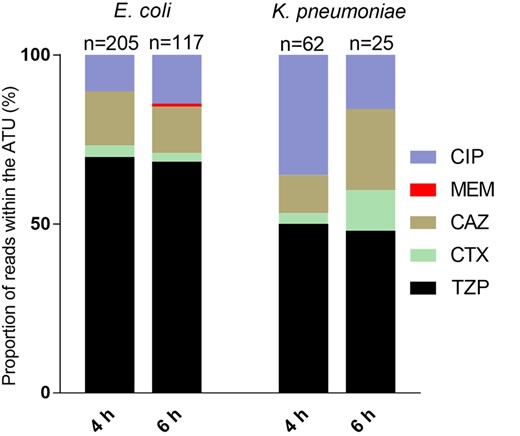
Cumulative bar graphs depicting reads of antibiotics within the ATU by substance in E. coli and K. pneumoniae after 4 and 6 h of incubation. Numbers represent the reads leading to ATU. CIP, ciprofloxacin; MEM, meropenem; CAZ, ceftazidime; CTX, cefotaxime; TZP, piperacillin/tazobactam. This figure appears in colour in the online version of JAC and in black and white in the print version of JAC.
Of note, erroneous piperacillin/tazobactam testing was not a relevant cause for VMEm, as shown in Figure 4. Rather, it appeared that rapid cephalosporin testing was associated with false susceptible results [3/3 (100%) and 3/4 (75%) VMEm for E. coli after 4 and 6 h of incubation, respectively, and 2/5 (40%) for K. pneumoniae after 4 h of incubation].
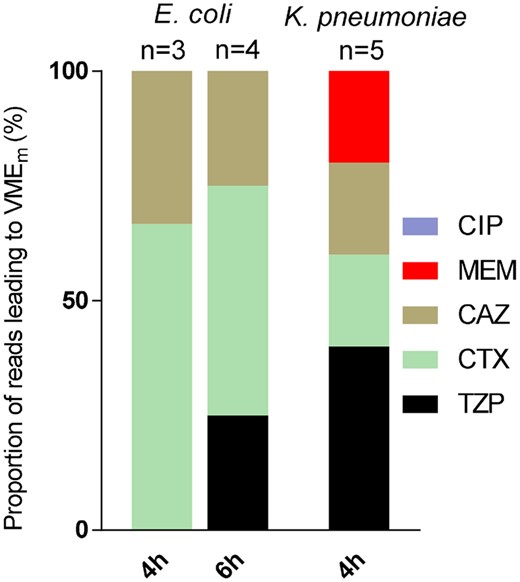
Cumulative bar graphs depicting reads of antibiotics within the VMEm range by substance in E. coli and K. pneumoniae after 4 and 6 h of incubation. Numbers represent the reads leading to VMEm. CIP, ciprofloxacin; MEM, meropenem; CAZ, ceftazidime; CTX, cefotaxime; TZP, piperacillin/tazobactam. This figure appears in colour in the online version of JAC and in black and white in the print version of JAC.
Clinical impact of RAST on antibiotic usage
To test the impact of RAST on antibiotic usage and patient management, 51 patients for the RAST group from a pool of 61 patients from 1 May to 31 July 2019 were analysed. For the control group, 54 patients met our inclusion criteria from 64 eligible patients from 1 January to 31 March 2018 (Figure 1). Patients excluded had less than 30 days of follow-up. The baseline characteristics are shown in Table S1 (available as Supplementary data at JAC Online). Although the two groups differed with regard to some comorbidities {organ and haematological transplantation and COPD were more common in the control group [27.8% versus 11.8%, (P = 0.04) and 14.8% versus 1.9% (P = 0.01), respectively], while moderate/severe liver disease and AIDS were more common in the RAST group [23.5% versus 9.3% (P = 0.05) and 8.8% versus 0% (P = 0.02), respectively]}, no difference was found in the Charlson comorbidity index. Between the two groups there was no gross difference in the distribution of species isolated from blood cultures. Multiresistant bacteria were equally distributed in the two groups. However, considering the source of infections, intra-abdominal infections were more common in the RAST group (27.4% versus 11.1%, P = 0.03) and respiratory infections were predominant in the control group (25.9% versus 1.9%, P = 0.01).
Overall, there was no difference in the number of patients that received optimal treatment between the two groups (37% versus 41.2%, P = 0.66; Table 2). Similarly, the two groups didn’t differ with regard to inadequate or inadequate treatment administered. However, in the RAST group, optimal treatment was established on the same day as blood culture positivity, while in the control group this was only done 1 day later (<0.01). RAST allowed for a prompt escalation in six cases of ESBL bacteraemia. Of note, because of the high amount of ATU results for piperacillin/tazobactam and the limited choice of antibiotics in RAST, 15 unnecessary escalations were performed following the RAST results. Although 30 day mortality was higher in the control group (22.2% versus 11.8%), this difference was not statistically significant.
Clinical usefulness of RAST
| Comparison group (N = 54) | RAST group (N = 51) | P | |
|---|---|---|---|
| Optimal treatment, n (%) | 20 (37) | 21 (41.2) | 0.66 |
| Time to optimal treatment (days)a, median (IQR) | 1 (0–1.5) | 0 (0–0) | <0.01 |
| Adequate treatment, n (%) | 32 (59.3) | 28 (54.9) | 0.65 |
| Inadequate treatment, n (%) | 2 (3.7) | 2 (3.9) | 0.95 |
| Mortality at 30 days, n (%) | 12 (22.2) | 6 (11.8) | 0.15 |
Day 0 was defined as the day of blood culture positivity.
Discussion
In this study, we show very low error rates of RAST when compared with the cSOC in clinical practice. Furthermore, we assessed the clinical impact of RAST combined with antimicrobial stewardship interventions, providing a potential rational for implementing RAST approaches in clinical microbiological workflows. We observed an achievement of optimal therapy on the same day as blood culture positivity, thus 24 h earlier compared with the historical bacteraemia cohort. We were not able to find an effect on patient mortality, due to the limited sample size. However, RAST allowed for an early escalation in six cases of ESBL-harbouring isolates, where the empirical antibiotic treatment was inappropriate. Shortening the time of ineffective antibiotic treatment plays a pivotal role in decreasing sepsis mortality in critically ill patients.13 Currently, rapid species identification of isolates from positive blood cultures is used to predict pathogen resistance profiles. In the context of emerging multiresistant bacterial populations, however, fast pathogen detection and species identification may not necessarily allow for appropriate escalation decisions and thus needs to be coupled with approaches to rapidly assess antibiotic susceptibilities in high-risk patient populations.14 In Gram-negative organisms, the heterogeneity of genetic determinants associated with acquired resistance phenotypes and the multifactorial character of multiresistance currently make it impossible to comprehensively predict complex resistance phenotypes through simple molecular testing. Thus, phenotypic analysis is still mandatory for obtaining conclusive evidence on antibiotic susceptibility.
Therefore, rapid susceptibility testing has gained much interest and, in recent years, new technologies and techniques have been implemented to tackle this problem.15 However, the performance of automated test systems can be unreliable.16 Intriguingly, RAST led to a very low VMEm rate of only 0.6%, thus allowing for very reliable clinical decision-making. Similar results were found in a large study of 55 laboratories in 11 European countries.12 Furthermore, the costs of consumables for RAST are roughly 0.70 € per blood culture processed, whereas the per-test costs (e.g. consumables) associated with the use of an automated system are usually much higher. Thus, economical aspects demand strict limitation of testing when using automated systems, e.g. according to defined clinical criteria. Consequently, this approach potentially results in exclusion of relevant samples from rapid resistance analysis. Thus, the low costs of RAST make broad implementation possible, thereby reducing the number of untested samples, whose examination would allow for changes from empirical to more targeted antibiotic therapies.
While others demonstrated reliable RAST results even for ESBL-producing isolates,12 those isolates were associated with VMEm for ceftazidime or cefotaxime in 9 E. coli/K. pneumoniae isolates. These results did not necessarily lead to false reporting, since parallel detection of resistance to the other of the two tested cephalosporins was interpreted as evidence of an ESBL phenotype. Nevertheless, our findings stress the need to evaluate the potential importance of applying additional techniques allowing for fast and reliable detection of key resistance markers in parallel to RAST. Such assays (e.g. double disc diffusion tests, chromatographic assays or molecular detection of resistance genes) may provide the basis for more valid escalation or de-escalation decisions at the bedside.
It needs to be stressed that implementation of rapid characterization into blood culture diagnostics is only meaningful if rapid laboratory techniques are coupled with antimicrobial stewardship programmes (ASPs). In a recent systematic review and meta-analysis of 31 studies and 5920 BSI patients, it became apparent that rapid diagnostic testing of positive blood cultures was associated with a significant decrease in mortality risk only when combined with systematic ASPs.17,18 Consequently, rapid diagnostic testing has been suggested as an important tool for ASPs to support clinicians.19 RAST could represent an important additional tool for optimizing antibiotic stewardship interventions in Gram-negative BSI; however, it needs to be implemented with caution. The high percentage of piperacillin/tazobactam ATU results impeded a reliable assessment of the activity of β-lactam/β-lactam inhibitor combinations and thus their use as an alternative to cephalosporin- or carbapenem-based therapies. In fact, we observed unnecessary use of broad-spectrum antibiotics related to incorrect piperacillin/tazobactam susceptibility testing results. While RAST thus has clear limitations as a de-escalation tool, its potential strength lies in the accurate detection of acquired resistance phenotypes, e.g. carbapenem resistance. Thus, RAST appears to be an appropriate tool for allowing early escalation in the presence of an MDR pathogen. Furthermore, the absence of a difference in optimal treatment between the two groups could have possibly been overcome by bedside consultations instead of an ASP telephone-based consultation. Actually, bedside ASP consultations have been proven to decrease mortality, length of stay and cost in some studies.20
The clinical study described here has several limitations. First of all, its retrospective pre-post design. The choice of this design is due to the unethical issue of depriving the possibility of rapid escalation in patients with MDR bacteria in the bloodstream in the case of a randomized clinical trial. Furthermore, it was not always possible to determine the exact timepoint of the antimicrobial prescription. For this reason, we decided to consider just the day of the antimicrobial prescription. A further limitation is that it was a single-centre study, where microbiologists were not available 24/7.
In summary, we document the accuracy of RAST in a real-life setting and a significant reduction in the time to optimal treatment. RAST adds to the emerging repertoire of rapid assays to speed up blood culture diagnostics and provides a promising tool to support ASPs. RAST appears particularly interesting in settings with high MDR prevalence and where molecular tests or new expensive rapid phenotypic tests (e.g. Accelerate) are not affordable.
Acknowledgements
Parts of the work were presented at the Annual Meeting of the German Society for Hygiene and Microbiology, Leipzig, Germany, 2020 (Abstract 064-DKMP) and at the Thirtieth European Congress of Clinical Microbiology and Infectious Diseases (held online), 2020 (Abstract 567).
We thank technical staff at the Institute for Medical Microbiology, Virology and Hygiene for excellent support. The support of members from the UKE antimicrobial stewardship team is gratefully acknowledged.
Funding
This study and the data collection were carried out as part of routine diagnostic procedures.
Transparency declarations
None to declare.
Author contributions
B.B. analysed data and wrote the manuscript. F.O. analysed data and wrote the manuscript. A.B. analysed data and revised the manuscript. N.B. analysed data. M.C. analysed data and wrote the manuscript. M.A. provided resources and revised the manuscript. H.R. designed the study, analysed data and wrote the manuscript. All authors read and approved the final manuscript.
Supplementary data
Table S1 is available as Supplementary data at JAC Online.
References
EUCAST. Breakpoint Tables for Interpretation of MICs and Zone Diameters, Version 8.1.
EUCAST. Direct Antimicrobial Susceptibility Testing Guidelines. https://www.eucast.org/fileadmin/src/media/PDFs/EUCAST_files/General_documents/Direct_testing_guidance_note_Feb2012.pdf.
EUCAST. Zone Diameter Breakpoints for Rapid Antimicrobial Susceptibility Testing (RAST) Directly From Blood Culture Bottles, Version 2.1.
Author notes
Benjamin Berinson and Flaminia Olearo authors contributed equally to the work.
