


Abstract
The criteria for the reimbursement of fluoroquinolones changed in Belgium on 1 May 2018. This study aims to quantify the difference in fluoroquinolone use after this change, and to assess the timing and persistence of this effect, both in terms of total reimbursed fluoroquinolone use and its relative proportion.
Longitudinal reimbursement data on fluoroquinolone use in the Belgian community from January 2017 to November 2018 were analysed to identify a change in reimbursed fluoroquinolone use expressed in DDD per 1000 inhabitants per day (DID), using a set of non-linear mixed models including change-points. In addition, longitudinal data on the relative proportion of prescribed fluoroquinolones from January 2017 to December 2018 were analysed to identify a change in the relative proportion of prescribed fluoroquinolones using generalized estimation equations including change-points.
Fluoroquinolone use dropped significantly immediately after the change in reimbursement criteria, from 2.21 DID (95% CI: 2.03–2.38) to 0.52 DID (95% CI: 0.48–0.56) and from 9.14% (95% CI: 8.75%–9.56%) to 6.52% (95% CI: 6.04%–7.04%). The observed decrease in fluoroquinolone use persisted over time.
While fluoroquinolone use was still above the target of 5% after the change in reimbursement criteria, its implementation helped to lower fluoroquinolone use in Belgium.
Introduction
Antimicrobial resistance (AMR) is a worldwide problem and is one of the biggest threats to global health, resulting in a growing number of bacterial infections, longer hospital stays, higher medical costs and increased mortality.1,2 A correlation between antibiotic resistance and high antibiotic consumption has been identified by multiple studies, underlining the importance of prudent antibiotic use.3–6
Fluoroquinolones, a class of broad-spectrum antibiotics often prescribed for respiratory and urinary tract infections with anatomical therapeutic chemical (ATC) code J01MA, are one of the antibiotics most frequently used in Belgium. In 2017, 10.3% of the reimbursed antibiotics, expressed as DDD per 1000 inhabitants per day (DID), in the Belgian community were fluoroquinolones.7 Resistance to fluoroquinolones in the Belgian community has been reported for several pathogens such as Streptococcus pyogenes, Helicobacter pylori, Mycoplasma genitalium and Escherichia coli.8–12 Although the fluoroquinolone use expressed in DID decreased from 2.77 in 2012 to 2.17 in 2017, this number still remains too high in comparison to fluoroquinolone use in Europe with an average of 1.47 DID calculated from 27 countries in 2017.13
The Belgian healthcare system is mainly funded by mandatory health insurance. The National Institute for Health and Disability Insurance (NIHDI) pays the reimbursed part of the costs of prescribed medicines, while the rest must be paid by the patient himself. In Belgium, antibiotics are prescription-only medicines and since 1 May 2017 they are reimbursed for about 50% instead of about 75% before. Data regarding the reimbursement of medicines are collected by the NIHDI and are available upon request. To limit the use of fluoroquinolones and to avoid the development of resistance, the Belgian government changed the criteria for the reimbursement of fluoroquinolones on 1 May 2018. Today, all fluoroquinolones prescribed in Belgium, i.e. ofloxacin (J01MA01), ciprofloxacin (J01MA02), norfloxacin (J01MA06), levofloxacin (J01MA12) and moxifloxacin (J01MA14), are no longer reimbursed for the treatment of respiratory tract infections or uncomplicated urinary tract infections, but only for specific and well-defined infections including pyelonephritis, prostatitis, acute urethritis, orchi-epididymitis, acute diverticulitis and pelvic inflammatory diseases.14 This change in reimbursement criteria implicates that the treatment cost carried by the patient increases in case of unapproved indications.
In Australia, it has been shown that similar regulations have been effective in the control of fluoroquinolone use and resistance.15 Bruyndonckx et al.16 previously assessed the impact of two decades of multi-faceted campaigning on antibiotic use in Belgium, including the impact of the change in reimbursement of all antibiotics in 2017. However, the impact of the change in reimbursement criteria for fluoroquinolones in 2018 still has to be evaluated. This study therefore aims to quantify the difference in fluoroquinolone use after the change in reimbursement criteria, to assess how soon there is an effect and to assess its persistence using change-point models based on longitudinal reimbursement and prescription data of antibiotic use in the Belgian community.
Methods
Data
Monthly reimbursement data
Monthly aggregated reimbursement data on fluoroquinolone use from January 2017 to November 2018 were available from NIHDI. The monthly reimbursement data express fluoroquinolone use in DID for the five substances under study.
Weekly prescription data
Weekly data on antibiotic prescribing by GPs on out-of-hours (OOHs) care, i.e. during weekends, from January 2017 to December 2018 were obtained from the Improving Care and Research Electronic Data Trust Antwerp (iCAREdata) project.17,18 The weekly prescription data express fluoroquinolone prescription at the patient level, allowing the calculation of the relative proportion of prescribed fluoroquinolones per week for the five subclasses under study. Information on indications for the prescription of fluoroquinolones was available for the weekly prescription data.
Statistical analyses
Since the reimbursement criteria changed from one day to the next, an abrupt change in fluoroquinolone use was expected. Therefore, change-point models are the models of choice. These models are able to capture sudden changes in time by the inclusion of change-points.
Modelling monthly reimbursement data
It was assumed that the amount of reimbursed fluoroquinolones would decrease at the same timepoint for each of the five subclasses under study, as can be observed in Figure 1. Therefore, the evolution in reimbursed fluoroquinolones was modelled using a mixed model including a common change-point. A mixed model takes into account the correlation arising from repeated measures within each subclass while allowing for antibiotic-specific deviation from the average evolution. A seasonal trend can be observed for moxifloxacin, necessitating the incorporation of a sine function within the mixed model. The outcome variable DID was log-transformed to obtain a distribution closer to normality. To determine the change-point in a data-driven manner, models were fitted in a Bayesian way.19
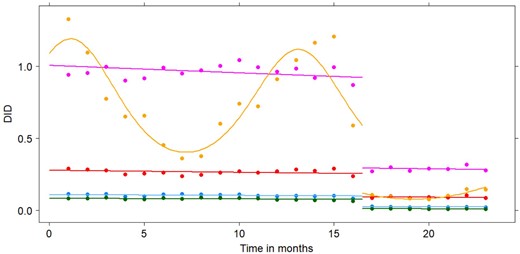
Observed (points) and fitted (lines) DID levels for ofloxacin (blue), ciprofloxacin (purple), norfloxacin (green), levofloxacin (red) and moxifloxacin (yellow) from January 2017 (Timepoint 1) until November 2018 (Timepoint 23) according to the best-fitting model. This figure appears in colour in the online version of JAC and in black and white in the print version of JAC.
The most elaborate model consists of an intercept reflecting the fluoroquinolone use at baseline, a slope reflecting the linear trend in fluoroquinolone use over time, an amplitude for the sine function reflecting the magnitude of the seasonal variation and a difference in intercept, slope and amplitude after the change-point. Model selection was performed using the deviance information criterion (DIC).20 Details on the mixed model structures and Bayesian model fitting can be found in Appendix S1 (available as Supplementary data at JAC Online). The fit of the final model was evaluated by plotting the observed and fitted values and by using the posterior predictive check (PPC).21
Modelling weekly prescription data
The weekly prescription data have a hierarchical structure, where observations are clustered within patients and patients are clustered within GPs. To handle the correlation arising from this structure, generalized estimating equations (GEEs) were applied to model the prescription or non-prescription of fluoroquinolones. Clustering was accounted for at the level of GPs.22 In order to account for seasonal variations, a sine function was included within the GEE model.
As the prescription data contain weekly information on the relative proportion of prescribed antibiotics, no common change-point was assumed for the five fluoroquinolones, as opposed to the reimbursement data where only monthly information was available. For each fluoroquinolone under study, a full model was fitted, consisting of an intercept reflecting fluoroquinolone prescribing at baseline, a slope reflecting the linear trend in fluoroquinolone prescribing over time, an amplitude for the sine function reflecting the magnitude of the seasonal variation and a difference in intercept, slope and amplitude after the change-point, which was initially fixed at 70 weeks, i.e. the last weekend before the change in reimbursement criteria. Model selection was performed using the quasi information criterion (QIC).23 Details on the GEE model structure and a sensitivity analysis with respect to model selection can be found in Appendix S2. The fit of the final models was evaluated by plotting the observed and fitted values.
The relative proportions of prescribed fluoroquinolones and the corresponding 95% CIs were calculated before and after the change in reimbursement criteria. Information on indications for the prescription of fluoroquinolones was used to calculate the proportion of fluoroquinolones prescribed for approved indications before and after the change in reimbursement criteria. In order to assess whether the expected decrease in fluoroquinolone use was accompanied by an increase in other antibiotic subclasses, the relative proportions of prescribed antibiotics and the corresponding 95% CIs were calculated for the remaining antibiotics, i.e. tetracyclines (J01A), amphenicols (J01B), penicillins (J01C), cephalosporins (J01D), sulphonamide/trimethoprim antibiotics (J01E), macrolides and lincosamides (J01F), aminoglycosides (J01G) and other antibacterials (J01X).
Results
Monthly reimbursement data
Before the change in reimbursement criteria, total reimbursed fluoroquinolone use in Belgian outpatients was 2.21 DID (95% CI: 2.03–2.38). After the change in reimbursement criteria, this significantly dropped to 0.52 DID (95% CI: 0.48–0.56). Both before and after the change in reimbursement criteria, ciprofloxacin was most commonly reimbursed, while norfloxacin was reimbursed the least. Reimbursed fluoroquinolone use, expressed in DID, before and after the change in reimbursement criteria is shown in Table 1. A seasonal trend was observed for moxifloxacin with a downward peak in summer and an upward peak in winter as can be seen from Figure 1.
Average, minimum (min) and maximum (max) monthly reimbursed fluoroquinolone use, expressed in DID, before and after the change in reimbursement criteria
| Fluoroquinolone (in DID) | All (min–max) | Ofloxacin (min–max) | Ciprofloxacin (min–max) | Norfloxacin (min–max) | Levofloxacin (min–max) | Moxifloxacin (min–max) |
|---|---|---|---|---|---|---|
| Before | 2.21 (1.74–2.76) | 0.10 (0.08–0.11) | 0.96 (0.87–1.05) | 0.08 (0.06–0.09) | 0.27 (0.24–0.29) | 0.79 (0.36–1.33) |
| After | 0.52 (0.47–0.61) | 0.02 (0.02–0.03) | 0.29 (0.27–0.32) | 0.01 (0.01–0.10) | 0.09 (0.08–50.10) | 0.11 (0.08–0.15) |
The best-fitting model assumes a common linear trend for all fluoroquinolones and contains an indicator variable that switches on the sine function for moxifloxacin and switches off the sine function for the remaining fluoroquinolones. The change-point identified by this model equals 16.5, corresponding to the end of April/beginning of May 2018. There is a small but significant decreasing trend in the overall fluoroquinolone use over time, a significant overall decrease in intercept after the change-point and a significant seasonal effect for moxifloxacin, both before and after the change-point. The model fits the observed data well, as can be seen from Figure 1 and from Figure S1 in Appendix S3. The obtained parameter estimates and DIC values for all fitted models are shown in Table S1 in Appendix S4.
Weekly prescription data
Before the change in reimbursement criteria, the average relative proportion of prescribed fluoroquinolones was 9.14% (95% CI: 8.75%–9.56%). Afterwards, this significantly dropped to 6.52% (95% CI: 6.04%–7.04%), i.e. still above the target of 5% set by the Belgian Antibiotic Policy Coordination Committee (BAPCOC) and used as ‘disease-specific antibiotic prescribing quality indicator’ for the ESAC.24,25 Ciprofloxacin is the most commonly prescribed fluoroquinolone in Belgium, while norfloxacin is the least prescribed fluoroquinolone both before and after the change in reimbursement criteria. The relative proportions of prescribed fluoroquinolones before and after the change in reimbursement criteria are shown in Table 2. A seasonal trend was observed for the relative proportion of moxifloxacin with a downward peak in summer and an upward peak in winter. The opposite seasonal trend was observed for the relative proportion of ciprofloxacin as can be seen from Figure 2. Before the change in reimbursement criteria, 17.32% (95% CI: 15.63%–19.15%) of the fluoroquinolones were prescribed for pyelonephritis, prostatitis, acute urethritis, orchi-epididymitis, acute diverticulitis or pelvic inflammatory diseases, while after the change in reimbursement criteria, this percentage significantly rose to 22.66% (95% CI: 19.51%–26.15%).
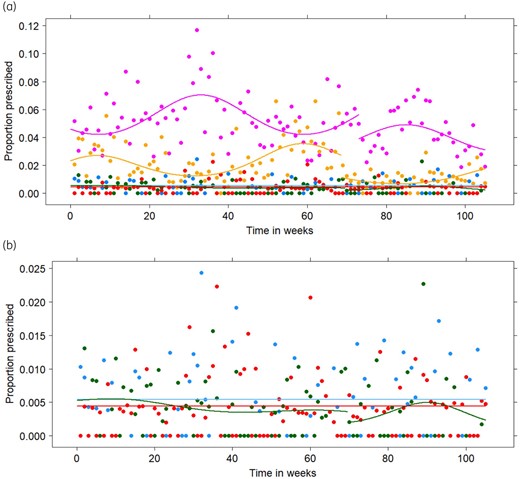
(a) Observed (points) and fitted (lines) relative proportions for the prescription of ofloxacin (blue), ciprofloxacin (purple), norfloxacin (green), levofloxacin (red) and moxifloxacin (yellow) from the first weekend of January 2017 (Timepoint 1) until the last weekend of December 2018 (Timepoint 105) for the final generalized estimating equations in the primary analysis. (b) Detail of the observed (points) and fitted (lines) relative proportions for the prescription of ofloxacin (blue), norfloxacin (green) and levofloxacin (red). This figure appears in colour in the online version of JAC and in black and white in the print version of JAC.
Average, minimum (min) and maximum (max) monthly consumption of fluoroquinolones, expressed as the relative proportion of prescribed antibiotics, before and after the change in reimbursement criteria
| Fluoroquinolone (in %) | All (min–max) | Ofloxacin (min–max) | Ciprofloxacin (min–max) | Norfloxacin (min–max) | Levofloxacin (min–max) | Moxifloxacin (min–max) |
|---|---|---|---|---|---|---|
| Before | 9.14 (7.72–11.86) | 0.50 (0.16–0.94) | 5.21 (3.41–8.34) | 0.39 (0.15–0.80) | 0.45 (0.16–0.90) | 2.59 (1.31–3.97) |
| After | 6.52 (5.09–8.61) | 0.52 (0.19–0.99) | 4.27 (2.97–5.90) | 0.32 (0.16–0.61) | 0.35 (0.20–0.56) | 1.05 (0.73–1.48) |
According to the parameter estimates for the final models of the primary analysis shown in Table S2 in Appendix S5, the relative proportion of prescribed ofloxacin and levofloxacin remained stable over time, around 0.54% and 0.44%, respectively. The most appropriate change-points for ciprofloxacin, norfloxacin and moxifloxacin were 73, 69.5 and 68.5, corresponding to mid-May, the end of April and mid-April, respectively. After the change-point, a significant decrease in intercept was found for ciprofloxacin and moxifloxacin. Significant seasonal trends were found for ciprofloxacin and moxifloxacin, both before and after the change-points. For norfloxacin, a small but significant seasonal trend was found after the change-point. All GEE models fitted the observed data well, as can be seen from Figure 2.
According to the sensitivity analysis, the most appropriate change-points were 61, 74, 70, 64 and 69 for ofloxacin, ciprofloxacin, norfloxacin, levofloxacin and moxifloxacin, respectively. These timepoints correspond to the end of February, the end of May, the end of April, the end of March and the end of April, respectively. After the change-point, a significant decrease in intercept was found for ciprofloxacin, levofloxacin and moxifloxacin. After the change-point, a significant increasing trend was found for ciprofloxacin. A significant seasonal trend was found for ciprofloxacin and moxifloxacin, both before and after the change-point. The seasonal trend that was observed before the change-point for ciprofloxacin increased after the change-point. After the change-point, a small but significant seasonal trend was observed for norfloxacin. No significant linear trend or change in intercept was found for ofloxacin, resulting in stable prescription over time with an average relative proportion of 0.55%. All GEE models fitted the observed data well, as can be seen from Figure 3. The parameter estimates for the sensitivity analysis can be found in Table S3 in Appendix S5. Table 3 summarizes the similarities and differences between the primary and sensitivity analyses.
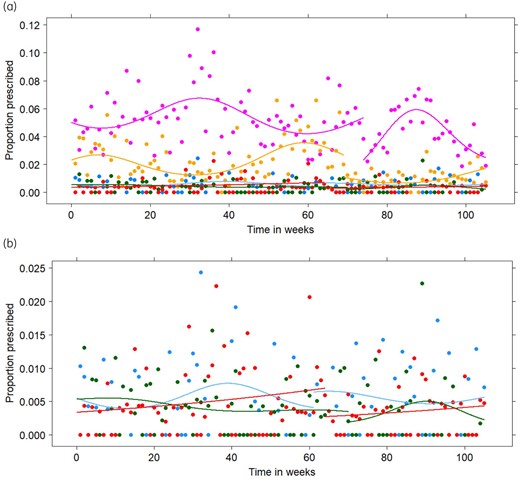
(a) Observed (points) and fitted (lines) relative proportions for the prescription of ofloxacin (blue), ciprofloxacin (purple), norfloxacin (green), levofloxacin (red) and moxifloxacin (yellow) from the first weekend of January 2017 (Timepoint 1) until the last weekend of December 2018 (Timepoint 105) for the final generalized estimating equations in the sensitivity analysis. (b) Detail of the observed (points) and fitted (lines) relative proportions for the prescription of ofloxacin (blue), norfloxacin (green) and levofloxacin (red). This figure appears in colour in the online version of JAC and in black and white in the print version of JAC.
Comparison of the results obtained from models in the primary analysis (PA) and sensitivity analysis (SA)
| Ofloxacin | Ciprofloxacin | Norfloxacin | Levofloxacin | Moxifloxacin | ||||||
|---|---|---|---|---|---|---|---|---|---|---|
| PA | SA | PA | SA | PA | SA | PA | SA | PA | SA | |
| Change-point | absent | 61 | 73 | 74 | 69.5 | 70 | absent | 64 | 68.5 | 69 |
| Change in intercept | absent | absent | decrease | decrease | absent | absent | absent | decrease | decrease | decrease |
| Linear trend before the change-point | absent | absent | absent | absent | absent | absent | absent | absent | absent | absent |
| Linear trend after the change-point | absent | absent | absent | increase | absent | absent | absent | absent | absent | absent |
| Seasonal trend before the change-point | absent | absent | present | present | absent | absent | absent | absent | present | present |
| Seasonal trend after the change-point | absent | absent | present | present | present | present | absent | absent | present | present |
A significant increase in the prescription of nitrofurantoin, nifurtoinol and fosfomycin (J01XE01, J01XE02 and J01XX01, respectively) has been observed, going from a relative proportion of 7.24% (95% CI: 6.88%–7.61%) before the change in reimbursement criteria to a relative proportion of 9.17% (95% CI: 8.60%–9.77%) after the change in reimbursement criteria. Besides, a significant increase in the prescription of doxycycline, lymecycline and minocycline (J01AA02, J01AA04 and J01AA08, respectively) has also been observed, going from a relative proportion of 0.78% (95% CI: 0.67%–0.92%) before the change in reimbursement criteria to a relative proportion of 1.19% (95% CI: 0.99%–1.43%) after the change in reimbursement criteria.
Discussion
In this study, we evaluated the change in fluoroquinolone use in the Belgian community, in terms of reimbursed DID and the relative proportion of prescribed fluoroquinolones, after the change in reimbursement criteria on 1 May 2018, using a set of mixed models and GEE models including change-points.
Our analysis indicated a significant reduction in reimbursed fluoroquinolone use, from 2.21 DID to 0.52 DID, immediately after the change in reimbursement criteria. According to the best-fitting model, a small but significant decreasing trend in reimbursed fluoroquinolone use was observed over time. However, there is only a minor difference in DIC values between the best- and the second-best-fitting model, which does not assume a linear trend over time. Therefore, the decreasing trend over time in the best-fitting model should not be overinterpreted.
The total relative proportion of prescribed fluoroquinolones significantly decreased from 9.14% to 6.52%, but remains above the level of 5% targeted by BAPCOC and used for the ESAC ‘disease-specific antibiotic prescribing quality indicators’.24,25 A proportion below 5% could only be observed for 6 out of 35 weeks after the change in reimbursement criteria. This, however, is still an improvement compared with the period before the change in reimbursement criteria, where the relative proportion dropped below 5% in only 2 out of 70 weeks. According to the ECDC, the relative proportion of fluoroquinolone use, based on reimbursement data of the Belgian community in 2018, was equal to 5.6%.7 Although, 6.52% of the prescribed antibiotics in our analysis are fluoroquinolones after the change in reimbursement criteria, this result is in line with the relative proportion reported by the ECDC, because our result is based on prescription data and thus also takes into account the prescription of non-reimbursed fluoroquinolones and non-adherence to therapy.26
The prescribed proportion of levofloxacin remained stable over time in the primary analysis, but decreased after the change-point in the sensitivity analysis. For ciprofloxacin, an increasing trend was found after the change-point in the sensitivity analysis, but not in the primary analysis. The seasonal effect observed for the relative proportion of ciprofloxacin increases after the change-point in the sensitivity analysis, while in the primary analysis, this seasonal effect remains stable. For ofloxacin and levofloxacin, no change-points were identified in the primary analysis. However, in the sensitivity analysis, it was estimated that change-points occurred at Weeks 61 and 64 for ofloxacin and levofloxacin, respectively. Because the models in the sensitivity analysis were forced to include a change-point, we believe these change-points are a result of variation rather than real changes and the results of the primary analysis are more reliable. However, discrepancies between both analyses should be interpreted with care.
A seasonal effect was found for moxifloxacin expressed in DID and expressed as relative proportion, with a downward peak in summer and an upward peak in winter. Seasonal variation in the consumption pattern of moxifloxacin has been shown before and can be attributed to its use in the treatment of respiratory tract infections, which mainly occur during winter.27,28 As respiratory tract infections are often of viral origin, overuse of moxifloxacin can be attributed to its inappropriate prescription. Also, a significant seasonal effect for the relative proportion of ciprofloxacin was found, with an upward peak in summer and a downward peak in winter. However, the absolute number of prescriptions remained stable over time and this seasonal effect should thus be attributed to the general seasonal trend in the prescription of antibiotics with a downward peak in summer and an upward peak in winter, which results in a relatively higher proportion of ciprofloxacin in summer and a relatively lower proportion in winter. In addition, no seasonal trend was observed for reimbursed ciprofloxacin expressed in DID. No seasonal effects were found for the relative proportions of ofloxacin and levofloxacin, which are much less prescribed than ciprofloxacin. The number of general antibiotic prescriptions and fluoroquinolone prescriptions are shown in Figures S2 and S3 in Appendix S6, respectively. For the relative proportion of prescribed norfloxacin, a seasonal effect was observed after the change-point, suggesting inappropriate use after the change in reimbursement criteria.
The relative proportion of prescribed fluoroquinolones decreased significantly. However, a significant increase in the prescription of nitrofurantoin, nifurtoinol and fosfomycin has been observed. These antibiotics are indeed often used for the treatment of urinary tract infections. Besides, a significant increase in the prescription of tetracyclines (doxycycline, lymecycline and minocycline) has been observed. These antibiotics might thus substitute the decrease in fluoroquinolone use. However, further research is necessary to confirm this finding.
The impact of the change in reimbursement criteria on the expenses for fluoroquinolone use in Belgium has not been evaluated in this study. However, it is expected that the costs for fluoroquinolone use paid by NIHDI would decrease because the number of approved indications is reduced by the new reimbursement rule. One could argue that therefore the costs carried by the patient increase and thus reduce access to fluoroquinolone treatment for patients with fewer economic resources.29,30 However, fluoroquinolones will still be reimbursed in case of necessary antibiotic treatment and, therefore, no major negative effects on the population’s health are expected from underuse. Still, the socio-economic consequences of the change in reimbursement criteria remain an interesting topic for further research.
The change in reimbursement criteria resulted in a reduction of 76% in reimbursed fluoroquinolone use expressed in DID and a reduction of 29% in the relative proportion of prescribed fluoroquinolones. These result show that, in terms of effectiveness, regulatory interventions can compete with antimicrobial stewardship programmes. As a comparison, a reduction of 39% was obtained for the relative proportion of fluoroquinolone prescriptions in USA outpatients as a result of a multimodal antimicrobial stewardship programme from 2016 until 2018.31 A pharmacist-led antimicrobial stewardship programme carried out from 1997 until 2007 in the USA resulted in a reduction of 30% in the relative proportion of fluoroquinolone prescriptions.32 In Scotland, a stewardship programme focusing on fluoroquinolones, clindamycin, co-amoxiclav and cephalosporins, resulted in a decrease of 42% in the proportion of fluoroquinolones expressed in DDD.33
These results are of great importance, not only to limit the fluoroquinolone use and resistance in Belgium, but also for other countries with high fluoroquinolone consumption rates, such as Greece, Bulgaria and Spain with a fluoroquinolone consumption of 3.04, 2.76 and 2.29 DID in 2019, respectively.13 Adriaenssens et al.28 showed that, in 2017, ciprofloxacin, norfloxacin, levofloxacin and moxifloxacin accounted for 90% of the quinolone consumption expressed in DID in 30 countries that belong to the EU and European Economic Area. Besides, they demonstrated a significant increase in seasonal variation of quinolone consumption over time, indicating increasing inappropriate use of quinolones in the treatment of respiratory tract infections.28 Policy changes might thus also be of interest to other European countries to limit inappropriate use of fluoroquinolones.
Strengths and weaknesses
As policy changes and their impact on antibiotic consumption are insufficiently described in today’s literature, this study addresses an important gap in the evidence-base for antibiotic stewardship interventions.
The use non-linear mixed models and GEE models including change-points, allowed us to assess the change in fluoroquinolone use over time, while accounting for the correlation arising from the complex data structures. Both reimbursement and prescription data were used, strengthening the conclusions about the decrease in fluoroquinolone use in Belgium as a result of a change in reimbursement criteria. However, based on these data, we were not able to assess the impact on sales and actual consumption. Besides, the prescription data originate from GPs on OOHs care, where fluoroquinolones are prescribed a little less compared with GPs on office-hours care.25 Further, due to the change in reimbursement criteria, the consumption of fluoroquinolones without reimbursement has increased, and thus the true decrease in fluoroquinolone use might be smaller than the decrease based on the reimbursement data.29,30
The examined study period is relatively short and thus it has to be confirmed whether this decrease will persist in the future. According to the ECDC, the relative proportion of fluoroquinolone use, based on reimbursement data of the Belgian community in 2019, was equal to 2.9%, indicating an even further decrease below the level of 5% targeted by BAPCOC and used for the ESAC ‘disease-specific antibiotic prescribing quality indicators’.7,24,25 Whether the decrease in fluoroquinolone use in Belgium also results in decreased resistance rates remains a topic for future research.
In conclusion, changing reimbursement criteria for fluoroquinolones in May 2018 significantly reduced the fluoroquinolone consumption in Belgium. Although it was still above the target of 5% of total antibiotic consumption shortly after the intervention, our findings show that national regulatory interventions can lower specific antibiotic consumption and could inspire other countries with high fluoroquinolone consumption.
Acknowledgements
We would like to thank Joos Tielemans and Marc de Falleur for providing the reimbursement data from NIHDI and Stefaan Bartholomeeusen and Hilde Philips for providing the prescription data from the iCAREdata project.
Funding
This work was supported by the Methusalem funding programme of the Flemish Government. R.B. is funded as a postdoctoral researcher by the research foundation—Flanders (FWO: 2018–21). N.H. acknowledges support from the University of Antwerp scientific chair in Evidence-Based Vaccinology.
Transparency declarations
None to declare.
Supplementary data
Appendices S1 to S6 are available as Supplementary data at JAC Online.
References
WHO. Antibiotic resistance.
ECDC. Quality indicators for antibiotic consumption in the community.
ECDC. Rates by country. Solna ECDC: [aprox. 4 pantallas]. https://www.ecdc.europa.eu/en/antimicrobial-consumption/database/rates-country.
Rijksinstituut voor ziekte- en invaliditeitsverzekering (RIZIV). Antibiotica die tot de klasse van de (fluoro)chinolonen behoren: terugbetaling vanaf 1 mei 2018.
ECDC. Country overview of antimicrobial consumption.
