


Abstract
A MALDI-TOF MS-based identification method for KPC-producing Enterobacterales was developed.
The molecular mass of the intact KPC-2 polypeptide was estimated for blaKPC-2 transformants using MALDI Microflex and the exact mass was confirmed by LC and a high-resolution MS/MS system. A total of 1181 clinical Enterobacterales strains, including 369 KPC producers and 812 KPC non-producers, were used to set up the methodology and the results were compared with those from PCR analyses. For external validation, a total of 458 Enterobacterales clinical isolates from a general hospital between December 2018 and April 2019 were used.
The exact molecular mass of the intact KPC-2 protein was 28 718.13 Da and KPC peaks were observed at m/z 28 708.87–28 728.34 using MALDI Microflex. Most of the KPC-2 (99.1%, 335/338) and KPC-3 (100%, 6/6) producers presented a clear peak via this method, while 12.0% (3/25) of the KPC-4 producers had a peak of weak intensity associated with low levels of gene expression. It took less than 20 min for the entire assay to be performed with colonies on an agar plate. External validation showed that the analytical sensitivity and specificity of the method compared with PCR were 100% (59/59) and 99.50% (397/399), respectively.
The MALDI-TOF MS-based method for directly detecting the intact KPC protein is applicable to routine tests in clinical microbiology laboratories, supported by its speed, low cost and excellent sensitivity and specificity.
Introduction
Dissemination of carbapenemase-producing Enterobacterales (CPE) is of great concern in clinical settings,1,2 and, as carbapenemase genes can spread clonally and by horizontal gene transfer,3 accurate and rapid detection of CPE is critical not only for therapeutic strategies but also for infection control.4 Carbapenemases of the Klebsiella pneumoniae carbapenemase (KPC) family are the most widespread class A carbapenemases in the world. The appearance of an available therapeutic option, ceftazidime/avibactam, for infections caused by KPC producers highlights the need for rapid detection of KPC.
The modified Hodge and double-disc potentiation tests with boronic acid, EDTA or dipicolinic acid as carbapenemase inhibitors followed by PCR and sequencing have been used as a gold standard to identify CPE. However, the obscure phenotypes5 with low sensitivity and specificity6 and the process time of ≥2 days limit practical use. Simple, rapid, colorimetric methods to detect imipenem-hydrolysing activity have been introduced, e.g. Carba NP and Blue-Carba tests; these employ a pH indicator colour change caused by hydrolysis of imipenem.7–9 However, ambiguous results for enzymes having weak carbapenem-hydrolysing activity and the inability to identify the carbapenemase family are raised as weak points of the methods.
MALDI-TOF MS has been popularized for pathogen identification in clinical microbiology laboratories.10 Using MALDI-TOF MS, CPE detection was realized through distinguishing the downshift mass-to-charge (m/z) of meropenem.11 However, doubtful results for enzymes that weakly hydrolyse carbapenems and unattainable carbapenemase typing limit its role.12 A commercial assay to detect organism carbapenemase activity, i.e. MBT STAR®-CarbaIVD, was launched by Bruker Daltonik GmbH, with perfect accuracy except for OXA-carbapenemase-producing Acinetobacter spp.13 However, the indirect method has a risk similar to that of phenotypic detection methods, such as ambiguous results for enzymes having weak carbapenemase activity. Hart et al.14 used nano-LC to separate fragments of carbapenemases digested by trypsin and attempted carbapenemase typing by MS,14 but because of the difficult methodology, needing experts for its operation, it is difficult to implement in routine laboratory practice. In addition, searching for CPE-specific spectral markers15 is complicated because the peaks specific to the clone and plasmid could be misread as a carbapenemase-specific peak. The lateral-flow immunochromatographic assay is a good approach in terms of its accuracy and expandability.16
In the present study, we developed a simple, rapid and inexpensive MALDI-TOF MS method to identify the KPC enzymes produced by Enterobacterales clinical strains. The methodology was developed to enable diagnosis with a good resolution through: (i) determining the m/z range and intensity cut-offs of the KPC peaks based on mass spectra of blaKPC-2 gene transformants and KPC-producing clinical strains; and (ii) setting exclusion criteria by comparing many spectral patterns from both KPC producers and non-producers.
Materials and methods
Enterobacterales strains
A total of 1181 clinical Enterobacterales strains, composed of 786 CPE and 395 non-CPE isolated between 2011 and 2017 in South Korea, were studied (Table S1, available as Supplementary data at JAC Online). CPE strains included 369 KPC producers [including 7 New Delhi MBL (NDM) co-producers and 1 Verona integron-encoded MBL (VIM) co-producer], 136 NDM producers, 248 oxacillinase-48 (OXA-48)-derivative producers, 23 VIM producers and 10 multiple carbapenemase producers. The KPC producers were mostly K. pneumoniae (n = 336), i.e. 312 KPC-2 producers, 4 KPC-3 producers and 20 KPC-4 producers, or Escherichia coli (n = 16), i.e. 13 KPC-2 producers, 2 KPC-3 producers and 1 KPC-4 producer. Other Enterobacterales strains involved in this study produced either KPC-2 (one Klebsiella oxytoca, three Enterobacter spp., two Citrobacter freundii, one Citrobacter koseri, one Serratia marcescens and five Raoultella spp.) or KPC-4 (two Enterobacter spp., one Hafnia alvei and one C. freundii). The 395 non-CPE clinical strains were composed of 202 ESBL producers, 20 broad-spectrum β-lactamase producers and 173 K. pneumoniae and E. coli clinical strains susceptible to cephalosporins and carbapenems.
Sample preparation, performance of MALDI-TOF MS and data processing
The sample was prepared from pure culture colonies on MacConkey agar. Five to 10 colonies were resuspended in 100 μL of lysis buffer (250 μM Tris-HCl, 1.5% n-octyl-β-d-glucopyranoside) and incubated for 5 min at room temperature. After 5 min of centrifugation at 13 000 rpm, 1 μL of the supernatant was spotted and air-dried onto a 600 μm Anchor Chip (Bruker, Billerica, MA, USA). Dried sample spots were covered with 1 μL of sinapinic acid matrix solution and allowed to crystallize. Measurements were carried out using MALDI Microflex (Bruker) in linear mode using an acceleration voltage of 20.0 kV. The pulse ion extraction time was 1200 ns. Data accumulation was achieved over an m/z ratio window of 20 000–40 000 Da. All samples were spotted in duplicate and 1 mass spectrum was the sum of 10 mass spectra acquired from different spot regions that were obtained by applying ∼400 laser shots for each region. Mass spectra were externally calibrated between m/z 20 000 and m/z 50 000 with Protein Standard II (Bruker).
Protein analysis, gene cloning and transcriptional analysis
The intact protein was analysed using the Sciex Triple-TOF™ 5600+ instrument (AB Sciex, Framingham, MA, USA) coupled with an Eksigent NanoLC-2D+ with a nanoFlex cHiPLC system (AB Sciex). The raw mass spectrometry data from the data-dependent acquisition proteomics experiments were searched using MS-GF+ (version Beta v9872, University of California, San Diego, CA, USA) and PeptideShaker (version 1.16.38).17 Detailed methods are in the Supplementary Materials and methods. The blaKPC-2 gene in pCR-Blunt vector was transformed to E. coli and K. pneumoniae recipients by chemical and electro-transformation. Extracted total RNA from KPC-producing clinical strains was used for RT quantitative PCR (RT-qPCR)18 to determine the transcriptional level of the gene. The cloning and RT-qPCR methods are detailed in the Supplementary Materials and methods.
Enterobacterales strains for external validation
For external validation, 458 Enterobacterales clinical isolates from the prescribed culture tests taken from a clinical microbiology laboratory of an 814 bed general hospital in Seoul, South Korea, between December 2018 and April 2019 were used. The set of Enterobacterales isolates was composed of 204 K. pneumoniae, 156 E. coli, 22 Klebsiella aerogenes, 17 K. oxytoca, 9 Enterobacter cloacae, 8 each of S. marcescens and Proteus mirabilis, 6 C. freundii, 5 Raoultella ornithinolytica, 4 Providencia stuartii, 3 each of Klebsiella variicola, Moraxella morganii and Enterobacter asburiae, 2 each of C. koseri, Citrobacter amalonaticus and H. alvei, and 1 each of Citrobacter farmeri, Enterobacter hormaechei, Serratia liquefaciens and Pantoea dispersa.
Assay validation
Parametric statistics were carried out to analyse the distribution of KPC m/z values and cut-off intensity of the KPC peaks from a total of 363 spectra determined using MALDI Microflex. Two SDs were taken to set the m/z range of KPC peak 28 719.10 ± 11.26 and the relative intensity of ions [arbitrary units (a.u.)] for KPC peaks ≥110 was defined as KPC-positive when the E. coli transformant had a KPC peak of intensity >1000. The KPC m/z values and intensities from the E. coli transformant were recorded and plotted for each batch for internal quality control during the 5 month external validation (Figure S1). The analytical sensitivity, specificity, positive predictive value and negative predictive value of the direct detection method for intact KPC using MALDI Microflex were calculated against the reference results determined by PCR and direct sequencing.19 All statistical analyses were performed in SPSS Statistics (version 23, IBM Corp., Armonk, NY, USA).
Results
Mass determination of the intact KPC protein
A virtual analysis estimated the molecular mass of KPC-2 as 28 477.17 Da after eliminating the 20 amino acid signal sequences. However, E. coli and K. pneumoniae transformants harbouring the plasmid pUCkanaΩblaKPC-2 had a distinctive peak at m/z 28 715.29 for E. coli and one at m/z 28 717.93 for K. pneumoniae (Figure 1).

Mass spectra of the KPC transformants. The empty pUCkana vector and the gene-harbouring pUCkanaΩblaKPC-2 were introduced into E. coli Oneshot TOP10 and K. pneumoniae AK75 strains and the mass spectra were obtained using Microflex. The x- and y-axes indicate observed m/z values and intensities, respectively, and the vertical line represents m/z 28 718.13, the theoretical m/z of the KPC-2 polypeptide.
The exact mass of the KPC-2 polypeptide was determined by a high-resolution system for LC–MS/MS , Sciex Triple-TOF™ 5600+. The protein mass of KPC-2 was primarily determined from a lysate of an E. coli transformant harbouring the plasmid pUCkanaΩblaKPC-2 (Figure S2) and the peak was observed to have multiple charged ion clusters ranging from +12 to +23 under non-reducing conditions at 7.84 min of retention time. Finally, deconvolution of the ion cluster data resulted in a unique mass, 28 718.23 Da. Polypeptide sequences analysed with the LC–MS/MS system using in-gel-digested KPC-2 protein covered amino acids 22–293 of KPC-2 compared with amino acids 21–293 from the virtual analysis (Figure S1). The calculated KPC-2 protein mass with a disulphide bond (47C–216C) was 28 718.13 Da with a mass error of 0.10 Da from the observed 28 718.23 Da.
The m/z range of KPC peaks
Among the 369 KPC-producing clinical strains, 363 (98.4%) presented KPC peaks at m/z 28 708.87–28 728.34 (Figure 2 and Table S2). The 363 values of m/z for the KPC peaks had an arithmetic mean ± SD of m/z 28 719.10 ± 5.63 (95% CI = 28 718.52–28 719.68) with a variance of 31.67 (Figure 2). Based on the deduced SD, the m/z of KPC was determined assuming two SDs of the mean to be m/z 28 719.10 ± 11.26 and to range from m/z 28 707.84 to 28 730.36.
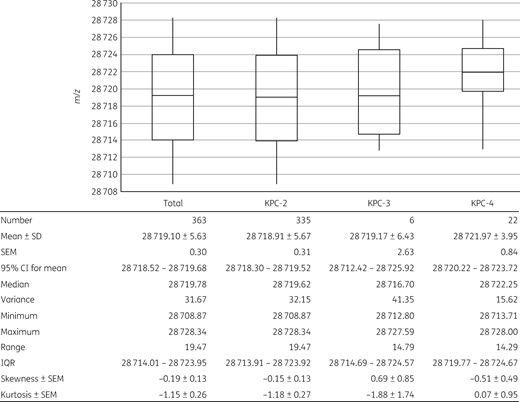
Distribution of the KPC m/z values. Analytical statistics of a total of 363 samples with m/z values having an obvious intensity peak at m/z 28 719.10 ± 11.26 from KPC-2 (n = 335), KPC-3 (n = 6) and KPC-4 (n = 22) producers were calculated and the resulting plot is presented in detail. Boxes present the first and third quartiles with whiskers showing the maximum and minimum values. The horizontal lines in the boxes indicate the mean values.
The m/z range differed in the three KPC subtypes (Figure 2). The KPC-2 producers, covering 90.8% (335/369) of the total KPC producers, presented a similar distribution of the entire KPC m/z values, ranging between m/z 28 708.87 and 28 728.34 with a variance of 32.15 and a mean ± SD of m/z 28 718.91 ± 5.67. Despite the impartial comparison due to the imbalanced data size, m/z values from KPC-3 and KPC-4 producers were shifted to greater values than those from the KPC-2 producers, having mean ± SD values of m/z 28 719.17 ± 6.43 and 28 721.97 ± 3.95, respectively. The E. coli and K. pneumoniae clinical strains producing any of the three subtypes, KPC-2, KPC-3 and KPC-4, had indisputable KPC peaks at these m/z values (Figure 3). Clonality determined by MLST of E. coli and K. pneumoniae was not associated with the range of KPC peaks.
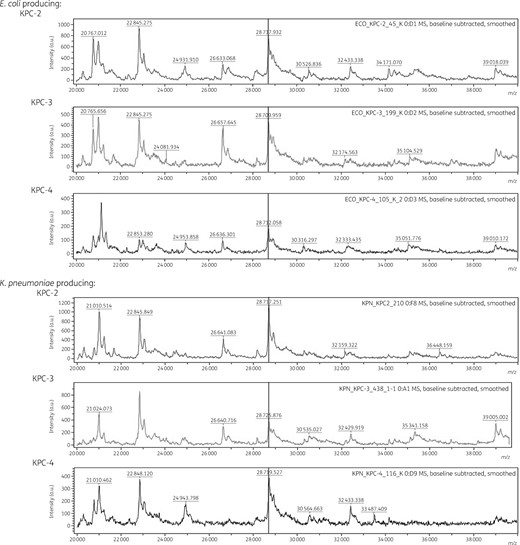
Mass spectra of KPC-2, KPC-3 and KPC-4 producers. Mass spectra were obtained from lysates of E. coli and K. pneumoniae clinical strains producing any of the KPC subtypes using Microflex. The x- and y-axes indicate observed m/z values and intensities, respectively, and the vertical line represents m/z 28 718.13, the theoretical m/z of the KPC-2 polypeptide.
Intensities of the KPC peaks and the levels of mRNA expression
Intensities of the KPC peaks ranged from 89 to 6482 (IQR = 332–1236) with a median value of 639 when the E. coli transformant had a KPC peak of intensity >1000 (Figure 4 and Table S2). Six KPC producers devoid of peaks above the detection threshold included 3/338 (0.9%) KPC-2 and 3/25 (12.0%) KPC-4 producers. The false-negative KPC-2 producers were composed of one each of K. pneumoniae, Raoultella planticola and S. marcescens and the false-negative KPC-4 producers consisted of two K. pneumoniae and one Enterobacter sp. Occurrence of false-negative results was associated with bacterial strain rather than the bacterial species (Figure S3). The KPC producers presented peak intensities that differed by KPC subtype and the distribution was compared between groups of KPC producers (Figure 4). The KPC-2 producers presented peak intensities between 120 and 6482. KPC-3 and KPC-4 had peak intensity ranges of 136–1298 and 89–1837, respectively.
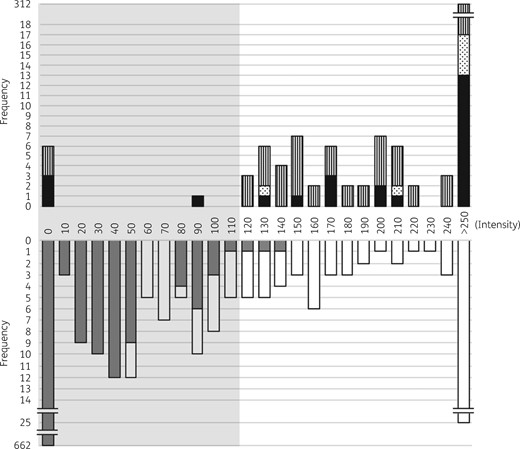
Intensities (a.u.) of peaks at m/z 28 719.10 ± 11.26 detected in KPC producers and KPC non-producers. Peak intensities from the KPC producers (n = 369, top) and KPC non-producers (n = 812, bottom) are indicated with the frequency. In the top panel the black bars indicate the frequencies of KPC-4 producers, the dotted bars indicate the frequencies of KPC-3 producers and the striped bars indicate the frequencies KPC-2 producers. In the bottom panel the grey bars indicate the frequencies of KPC non-producers that do not meet the exclusion criteria and the white bars represent the cases that met the exclusion criteria. The grey shading indicates peak intensities below the intensity cut-off, 110.
The expression level of the blaKPC gene was considered to be responsible for the high frequency of false-negative results for the KPC-4 peaks and RT–qPCR was carried out. The KPC-4-producing K. pneumoniae had lower secE-normalized blaKPC expression levels (0.46–1.83), except for one strain having 8.62 ± 1.14, than the KPC-2-producing K. pneumoniae strains, which had levels of at least 5.12 (5.12–16.02). The KPC-3-producing K. pneumoniae strains had a secE-normalized blaKPC expression level of 0.94 ± 0.02.
Intensity cut-off and exclusion criteria
While the majority of the KPC non-producers had no obvious peak at m/z 28 719.10 ± 11.26, 18.5% (150/812) of the KPC non-producers had a distinct peak (Figure 4). The peak-presenting strains were composed of 100 non-KPC CPE and 50 others including 21/136 (15.4%) NDM producers, 75/248 (30.2%) OXA-48-derivative producers, 2/23 (8.7%) VIM producers, 2/10 (20%) NDM/OXA-48-derivative coproducers and 50/395 (12.7%) non-CPE (Figure S4). Among the 150 peak presenters devoid of the blaKPC gene, 60% (n = 90) had one extra peak located at m/z 200 downstream from the m/z 28 719.10 peak of a greater intensity than the KPC peak, and this allowed us to discriminate the false-positive cases (Figure 4).
The KPC producers had a peak with intensities >110 except for one having 89, while the KPC non-producers had a peak with intensities <150 (Figure 4). The analytical sensitivity and specificity were calculated for intensity cut-offs near 110 (Table S3), and the intensity 110, resulting in reasonable sensitivity and specificity (98.1% and 99.5%, respectively), was decided as an intensity cut-off for the KPC peak.
External validation of the KPC detection method
For external validation, actual application in routine tests was carried out for the 5 months from December 2018 to April 2019 in a clinical microbiology laboratory of an 814 bed general hospital. For bacterial colonies on an agar plate grown from clinical specimens, pathogen identification was performed using Microflex, and for the family Enterobacterales subsequent MALDI-TOF MS detection for KPC was carried out. Among 458 Enterobacterales clinical isolates tested, 61 isolates were KPC positive by MALDI-TOF MS, including 52 K. pneumoniae, 4 E. coli, 2 K. oxytoca and 1 each of K. aerogenes, P. stuartii and P. mirabilis. All but two were confirmed as KPC-2 producers through custom PCR and sequencing. False-positive results were detected in 1/4 P. stuartii and in 1/8 P. mirabilis isolates. Both strains were susceptible to ceftazidime, aztreonam and carbapenems, indicating that they were devoid of acquired cephalosporinases or carbapenemases. The remaining 326 Enterobacterales isolates were negative for KPC by both MALDI-TOF MS and PCR. Compared with custom PCR (Table S4), the KPC detection method presented a perfect sensitivity of 100% (59/59; 95% CI = 93.94%–100.00%) and specificity of 99.50% (397/399, 98.20%–99.94%), accuracy of 99.56% (456/458; 98.43%–99.94%), positive predictive value of 96.15% (59/61; 88.10%–99.16%) and negative predictive value of 100% (397/397) (Table 1).
Analytical validation of the method’s results compared with the results from custom PCR
| Percentage | n | Hits | 95% CI | |
|---|---|---|---|---|
| Sensitivity | 100 | 59 | 59 | 93.94%–100.00% |
| Specificity | 99.50 | 399 | 397 | 98.20%–99.94% |
| Accuracy | 99.56 | 458 | 456 | 98.43%–99.94% |
| Positive predictive value | 96.15 | 61 | 59 | 88.10%–99.16% |
| Negative predictive value | 100 | 397 | 397 |
Assay performance
The entire manipulation took <20 min starting from pure culture colonies on an agar plate: 5 min bacterial cell lysis, 5 min centrifugation, 2 min spotting the bacterial lysate and crystallization, 2 min laser shot and 5 min data acquisition and analyses.
Discussion
The present KPC-producer detection method based on a MALDI-TOF MS has three representative strengths as a diagnostic method applicable to routine tests in clinical microbiology laboratories. Firstly, the KPC detection method was powerful, with 100% sensitivity and 99.50% specificity. The existing rapid CPE detection methods, such as Carba NP,9 the CepheidXpert® Carba-R assay20 and hydrolysed imipenem-targeting MALDI-TOF MS,11 have sensitivities and specificities of ≥96.5% and ≥97.5%, respectively. Secondly, the rapidity, inexpensiveness and eco-friendliness of the process meant that it was suitable as a routine process in the clinical laboratory. The entire process took <20 min and the reagents cost less than 2 US$ per sample. Moreover, the performance generated limited waste, which was devoid of any antimicrobial remnants. Finally, the method was easy to perform. The procedure consists of five unchallenging steps and an automated interpretation procedure. Thus, anybody in a clinical microbiology laboratory can perform it after brief training.
Development of the MALDI-TOF MS-based pathogen identification method was dependent on large-scale screening to gather a large amount of mass spectra from varied bacterial species. Such a bottom-up approach is not always appropriate, especially to identify the peak of a specific protein. Consequently, we developed the procedure through a stepwise strategy using both top-down and bottom-up approaches. For the top-down approach, a blaKPC-2 gene transformant was analysed to identify the KPC-specific mass peak, and for the bottom-up approach a large number of KPC producers were used to determine the inclusion and exclusion criteria. A recent publication on MALDI-TOF MS-based KPC producer detection clearly showed the possible error/bias derived from the single-approach strategy.21 The authors of that publication used only the bottom-up method and reported the KPC-2 mass peak as 28 544 m/z, which was probably based on the computational analysis excluding the estimated signal sequences. However, the m/z 28 718.13 peak was confirmed as the actual mass of the KPC-2, highlighting the importance of detailed confirmation of the actual peak. In parallel, a similar approach has been used to detect the CMY-2-type cephalosporinases produced by Enterobacteriaceae22 and a later application of this method seemed successful,23 emphasizing the potency of the approach.
Compared with Enterobacterales clinical isolates as a whole,24 the group of test strains used to establish the procedure, which included one-third KPC producers and another one-third non-KPC CPE, was highly artificial and far from reality. The rates of carbapenem non-susceptibility were 0.2% for E. coli and 1% for K. pneumoniae from urine and blood specimens.20 Considering the prevalence of KPC as an aetiology of carbapenem resistance among carbapenem-non-susceptible Enterobacterales, which is also an issue in the USA,25 Italy, Greece26 and China,27 the method developed here could play an effective role in controlling hospital-associated infections. Nevertheless, detecting only the KPC producers not the other CPEs is an obvious weakness of the method. At least the NDM and OXA-48-derivative producers, which are endemic in India and Turkey,26,28 must be detected in an assay. Another inconvenient point of the method is that the KPC-2 and -3 producers were indistinguishable. Ceftazidime/avibactam resistance in KPC-3 producers has been reported29 and discriminating the KPC subtype produced would be a great help in determining the proper treatment. However, with the resolution achieved in the present study, the two subtypes had identical peaks and additional subtyping is needed.
The KPC peak was detected at m/z 28 708.87–28 728.34 and the peaks observed for KPC subtypes 3 and 4 had greater m/z ranges than KPC-2. This was likely associated with one or two amino acid substitutions, KPC-2H272Y for subtype 3 and KPC-2P103R,V239G for subtype 4. Fifteen KPC subtypes among 36 subtypes of KPC enzymes have an estimated mass that is higher or lower than m/z 28 719.10 ± 11.26, indicating that the method is mostly useful for the three widely disseminated KPC subtypes and further molecular epidemiological study is needed.
The KPC-4 producers presented lower carbapenem MICs than KPC-2 or KPC-3 producers,19 linked with weaker carbapenem-hydrolysing activity than that for ceftazidime, caused by an alteration from proline to arginine at amino acid 103.30 Interestingly, a relatively lower intensity of the KPC-4 peak than those of the other two subtypes was observed in the study. The KPC-4 CPEs possess the blaKPC-4 gene in Tn4401b, while the blaKPC-2 gene is harboured mostly in Tn4401a.19 The promoter in Tn4401b is weaker than that in Tn4401a31 and the lower intensity of the KPC-4 peak was in good agreement with this. However, it was more likely to be associated with a low level of gene expression than to be a subtype-specific issue. The low-intensity issue found in some rare Enterobacterales species, such as S. marcescens and R. planticola, was also likely a strain-specific issue rather than a species-associated problem, because the false-negative result was also found in the prevalent K. pneumoniae. Exceptionally, the false-positive results for P. stuartii and P. mirabilis indicate a need for caution because the false-positive results were not uncommon in these bacterial species.
The overall manipulation was simple and fast. For routine application, a direct detection method for intact KPC could be added immediately after bacterial species identification using MALDI-TOF MS, and patients infected and/or colonized with KPC-producing bacteria could be reported before the antimicrobial susceptibility test requiring one extra night.
In conclusion, we have developed a MALDI-TOF MS-based assay to identify KPC-producing Enterobacterales by determining the intact KPC protein produced by the bacteria. The diagnosis method is appropriate as a routine test in clinical microbiology laboratories staffed by ordinary clinical microbiologists because of its sufficient speed, low cost and excellent sensitivity and specificity.
Acknowledgements
We are grateful to Professor Sang-Guk Lee for critical reading of the manuscript prior to submission.
Funding
This work was supported by a grant of the Korea Health Technology R&D Project through the Korea Health Industry Development Institute (KHIDI), funded by the Ministry of Health & Welfare, Republic of Korea (grant number: H17C0695).
Transparency declarations
E.-J.Y., E.H.L. and D.H.H. are inventors in the South Korean patent application for ‘Direct detection of the β-lactam-hydrolysing enzymes by using MALDI-TOF MS’ submitted by Diatech Korea and the patent is pending under application #10-018-0090772. E.H.L. and D.H.H. are employed by APRILIS Co., Ltd, which is commercializing a KPC detection kit, namely the Aprodete™ KPC-CPE detection kit, and by Diatech Korea Co., Ltd, a linkage company of APRILIS Co., J.-H.B. was employed by Diatech Korea Co., Ltd, but recently resigned in order to change occupation. All other authors: none to declare.
Disclaimer
The content is solely the responsibility of the authors and does not necessarily represent the official views of the funding agency.
References
Author notes
Eun-Jeong Yoon and Eun Hee Lee contributed equally as first authors.
Je-Hyuh Baek and Seok Hoon Jeong contributed equally as last authors.
