


Abstract
To assess the effectiveness of clinical decision support systems (CDSSs) at reducing unnecessary and suboptimal antibiotic prescribing within different healthcare settings.
A systematic review of published studies was undertaken with seven databases from database inception to November 2018. A protocol was developed using the PRISMA-P checklist and study selection criteria were determined prior to performing the search. Critical appraisal of studies was undertaken using relevant tools. Meta-analyses were performed using a random-effects model to determine whether CDSS use affected optimal antibiotic management.
Fifty-seven studies were identified that reported on CDSS effectiveness. Most were non-randomized studies with low methodological quality. However, randomized controlled trials of moderate methodological quality were available and assessed separately. The meta-analyses indicated that appropriate antibiotic therapy was twice as likely to occur following the implementation of CDSSs (OR 2.28, 95% CI 1.82–2.86, k = 20). The use of CDSSs was also associated with a relative decrease (18%) in mortality (OR 0.82, 95% CI 0.73–0.91, k = 18). CDSS implementation also decreased the overall volume of antibiotic use, length of hospital stay, duration and cost of therapy. The magnitude of the effect did vary by study design, but the direction of the effect was consistent in favouring CDSSs.
Decision support tools can be effective to improve antibiotic prescribing, although there is limited evidence available on use in primary care. Our findings suggest that a focus on system requirements and implementation processes would improve CDSS uptake and provide more definitive benefits for antibiotic stewardship.
Introduction
Increasing antibiotic resistance poses a significant threat to the effectiveness of current antibiotic therapies. Due to the increasing drug resistance of pathogens, the range of effective antibiotic agents has greatly decreased, resulting in an escalation of morbidity, mortality and hospital-related costs.1,2 Clinical malpractices such as inappropriate prescribing of antibiotics have become one of the major drivers for the selection pressure in bacterial species that has facilitated the emergence of drug-resistant strains.3 It is estimated that 50% of antibiotics are dispensed inappropriately in outpatient settings, mainly due to unnecessary prescriptions and suboptimal selection of antibiotic agents or duration of therapy.4,5
In response to this challenge of drug resistance, antimicrobial stewardship programmes (ASPs) have been introduced in different countries following the initiative of the WHO.6 To optimize antibiotic usage, clinical practice guidelines (CPGs) have been developed to promote a reduction in inappropriate prescribing, thereby minimizing the risk of resistance.7 Despite increasing emphasis on appropriate antibiotic prescription in ASPs, clinician non-compliance with CPGs has been widely reported, largely due to the high volume of information in CPGs, and the consequent time and clinical workflow constraints.8,9
One way of reducing the time and workflow impacts of CPGs is to integrate them into the information technology tools available in healthcare settings.10,11 Electronic clinical decision support systems (CDSSs) have been developed to connect clinical observations with this knowledge base to ensure improved and informed decision-making.12–14 CDSSs are electronic tools or software that support clinical decision-making at the point of care by combining patient-specific data with a clinical knowledge base.15,16
Although previous studies have reported on the potential of CDSSs to improve antibiotic management in healthcare settings, there have been conflicting findings regarding the success of these systems in practice.17 System uptake and improvement in physicians’ performance is variable, with only 60% of randomized controlled trials (RCTs) reporting an improvement in clinical practice.18 A number of reviews have investigated the potential of decision support systems to reduce inappropriate antibiotic use.13,14,17,19 However, these reviews predominantly focused on particular care settings (hospital inpatient or outpatient)17,19 or study designs [RCTs or non-randomized studies (NRSs)].13,14 Other systematic reviews examined a range of health information technology interventions including surveillance systems, computerized physician order systems (CPOEs), electronic health record systems (EHRs) and CDSSs, and thus were quite diverse in focus.14,17 The scope of these reviews is very broad, and specific aspects such as the efficacy of CDSSs across different settings of use, study types and system features has not been considered.
The aim of this systematic review was to assess the impact of CDSS use on inappropriate antibiotic prescriptions, volume of antibiotic use, duration of therapy, hospital stay, mortality and cost of therapy. Moreover, the effect of CDSSs on these study outcomes was also quantified by pooling the data into a single measure, and heterogeneity was explored. We have attempted to identify those factors that modify the effectiveness of CDSSs as an antibiotic stewardship tool. Despite the fact that the majority of antibiotics are prescribed in primary care, there has been limited research regarding the implementation of CDSSs in this sector. Therefore, the focus of this review is on the efficacy of CDSSs in diverse care settings including hospital and primary care.
Methods
A review protocol and study selection criteria were developed prior to performing the systematic review.
Study eligibility criteria
Studies were selected in the systematic review on the basis of specific inclusion and exclusion criteria provided in Table 1.
Inclusion and exclusion criteria for selecting studies for the systematic review
| Item | Criteria | Definition |
|---|---|---|
| Population | Healthcare professionals in hospitals and in primary care settings | |
| Intervention | Clinical decision support systems (specifically for antibiotic management). | For study selection, we applied a pre-existing definition for CDSS by Hunt et al.16 ‘Software that is designed to be a direct aid to clinical decision-making in which the characteristics of an individual patient are matched to a computerized clinical knowledge base (KB), and patient-specific assessments or recommendations are then presented to the clinician and/or the patient for a decision’. |
| Comparator | Standard patient care | Antibiotics were prescribed without using any electronic decision support tools. |
| Outcomes | Primary outcome | |
| (i) appropriateness of antibiotic therapy | Treatment that is compliant with clinical practice guidelines or in vitro susceptibility test results (laboratory-based sensitivity analysis of the microorganism to the chosen therapeutic agents). | |
| Secondary outcomes | ||
| (i) volume of antibiotic use | Average consumption of antibiotics at the patient level. It is usually measured as DDD which is defined by the WHO as ‘The assumed average maintenance dose per day for a drug used for its main indication in adults’32,75 | |
| (ii) length of hospital stay | Total duration of hospitalization in days.32 | |
| (iii) duration of antibiotic therapy | Total days of antibiotic therapy.76 | |
| (iv) mortality (hospital studies only) | In-hospital or 30 day all-cause mortality. | |
| (v) cost of therapy | Overall cost associated with antibiotic therapy including cost of therapy per patient, annual cost of therapy and total cost of hospitalization.32 | |
| Study design | Randomized controlled trials (RCTs) | Both individual and cluster controlled trials |
| Non-randomized studies (NRSs) | Controlled before-and-after study, uncontrolled before-and-after study, interrupted time series study, case series, historically controlled and cohort study. | |
| Language | Only studies in English were included |
Moreover, CDSSs that were included in our review must have applied algorithms or rule-based software for the evidence-based guidance and decision-making of end users. Systems providing guidance in any form were eligible, including those with alerts, recommendations, feedback, and reminders or prompts. Systems providing expertise in diagnosis, treatment planning and patients’ follow-up were also eligible for inclusion. If studies did not report original or primary data, they were excluded from further analysis. Literature such as conference abstracts or editorials were also excluded from the review.
Search strategy
We searched seven databases: PubMed (including MEDLINE), Cochrane Central Register of Controlled Trials (CENTRAL), Embase.com, Scopus, CINAHL, PsychINFO and Web of Science utilizing broad and detailed criteria to maximize the results against the search query. Peer-reviewed articles were searched from database inception to August 2018. An updated electronic database search was also conducted using the same search query in PubMed (including MEDLINE) from September to November 2018 to include any recent publications. The search strategy encompassed indexing (MeSH) terms and text words for antibacterial agents and CDSSs (including synonyms). The reference lists of the included studies were also searched to identify any relevant study that might have been missed in the database search. The full strategy is provided in the Supplementary data (available as Supplementary data at JAC Online).
Study selection
Two reviewers (M.L. and T.M.) independently reviewed included studies against study eligibility and inclusion/exclusion criteria. M.L. screened the full text of all studies against the eligibility criteria while T.M. reviewed 10% of the eligible articles to validate the screening process; no discordance was identified between the reviewers.20 Any uncertainty regarding the inclusion of a study was resolved by discussion with T.M. and A.M. A standardized data extraction form (Microsoft Excel Spreadsheet) was created by the research team following the Cochrane Collaboration guidelines for data collection in intervention reviews and the Joanna Briggs Institute reviewer’s manual 2015.21,22 The data extraction form was piloted using a sample of 20% of included studies, resulting in modifications as necessary. The data were only reported if they could be accurately extracted from the included papers. The NHMRC Evidence Hierarchy for Interventional Evidence was used to determine the level of evidence of each study.23
Reporting of the literature search
The protocol was developing using the Preferred Reporting of Items in Systematic Reviews and Meta-analyses (PRISMA) – Protocol (PRISMA-P) checklist, and the systematic review was reported according to conventions from the PRISMA checklist.24,25
Quality assessment
Individual studies were critically appraised for methodological certainty and quality by two reviewers (M.L. and T.M.) utilizing risk of bias assessment tools. Uncertainty regarding the study quality was resolved by discussion with T.M. and A.M. For NRSs, evidence was appraised using Risk Of Bias In Non-randomized Studies - of Interventions (ROBINS-I). Through ROBINS-I, confounding, selection of participants, classification of interventions, deviation from intended interventions, missing data, measurement of outcomes and reported results were assessed.26
Similarly, for the critical appraisal of RCTs, the Cochrane Risk of Bias tool was used. This tool focuses on five possible domains of bias based on participants’ selection process, difference of performance between groups, detection of outcomes, withdrawal or attrition, and reporting of study outcomes. The judgement of bias was based on empirical evidence from studies and assessment of the relative significance of each domain.27
For diagnostic accuracy studies, the Quality Assessment of Diagnostic Accuracy Studies (QUADAS-2) tool was applied which determines the risk of bias in domains such as selection of patients, conduction and interpretation, reference standard and flow and timing.28
Data collection and synthesis
Data were extracted from the included studies, and key findings on the pre-specified outcomes of interest were presented using the Grades of Recommendation, Assessment, Development and Evaluation (GRADEpro) Guideline Development Tool.29 Authors were contacted for additional information that was not provided in the published studies. For outcomes in which the effect estimate could not be meta-analysed because of differences in unit of analysis, the findings are discussed separately.
Results from statistical analyses of individual studies were extracted, and standardized mean differences (SMDs) and pooled ORs and 95% CIs were computed for continuous and dichotomous variables, respectively. Numerator and denominator information was extracted and error measures were calculated (e.g. SD and CI).
The sample mean and variance were estimated from sample median, range or IQR and sample size.30 This estimation method provides improved estimators by incorporating study weight as a sample size function.
In this formula, df is the degree of freedom for estimating the within-groups pooled SD.31
Meta-analyses
Studies reporting sufficient data on study outcomes were meta-analysed. Meta-analysis was done using the metan user-written command in Stata version 15. Eligible studies included in the meta-analyses focused on the primary and secondary outcomes (as discussed in the study eligibility criteria) for improving antibiotic therapies and quality of care.32
Outcome data were extracted from studies to calculate pooled effect estimates and 95% CIs. Only studies with complete data were included. The random-effects model developed by the method of DerSimonian and Laird was used given that there was considerable between-study heterogeneity.33 The estimate of between-study heterogeneity was computed from the Mantel–Haenszel model.34 The use of subgroup analysis in the random-effects model enabled evaluation of whether the statistical heterogeneity in the meta-analyses could be explained by study characteristics.35 We also used funnel plots and Egger’s weighted regression statistic to determine whether publication bias had influenced the results of the meta-analyses (with a P value of <0.1 to compensate for the low power of Egger’s test).36
Subgroup analysis
In order to explore the impact of different types of decision support systems and study types on the pooled results, subgroup analysis was conducted. The types of CDSSs considered in this meta-analysis were based on one of the previously conducted systematic reviews.13 The systems are classified into different types according to functional scope and characteristics of platforms providing decision support. We considered the functional domains of prescribing, dosage optimization, alerts and physician feedback for the subgroup analysis. Additional subgroup analysis concerning CDSS platforms involved categorization into web-based, stand-alone software and CDSSs integrated into existing EHR or CPOE systems.13 Similarly, clinical heterogeneity was also explored according to the different study designs used, such as RCTs or NRSs and interventional or non-interventional studies. In non-interventional studies, the CDSS was not implemented in clinical practice but patients’ data were entered into the system prospectively or retrospectively. Treatment recommendations generated by the CDSSs were then compared with the actual antibiotics prescribed by the physician. No changes were made in prescriptions on the basis of the CDSS recommendations. In the interventional studies, a CDSS was implemented as an intervention, i.e. guiding prescribing practice, and its performance was compared with standard care in the clinical setting.
Statistical heterogeneity was assessed using the I2 statistic. Consistent with the Cochrane Handbook, an I2 value >50% was taken as considerable heterogeneity, whereas <40% was considered to be modest heterogeneity.37
Results
Database search results
Figure 1 describes the process undertaken to select eligible studies for the systematic review. An initial 6410 studies were identified, of which 57 studies were eventually included, comprising 48 (84%) studies conducted in a hospital setting and 9 (16%) in primary care. Most of the studies (n = 37, 65%) were carried out in the USA, while 21% (n = 12) were from Europe and the remaining 14% (n = 8) were from the Asia-Pacific region. With regards to outcomes, 26 studies evaluated the impact of CDSSs on the appropriateness of antibiotic therapy, 20 on the overall volume of antibiotic usage, 17 on length of hospital stay, 5 on duration of therapy, 19 on all-cause mortality and 9 on the cost of therapy. The complete summary of findings providing information on the magnitude of effect and quality of evidence for all the included studies is provided in Table S1.
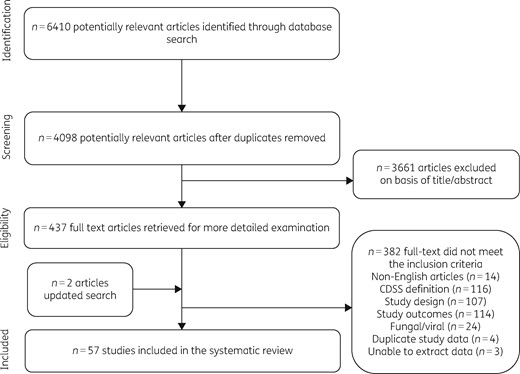
Study selection according to a PRISMA flowchart.
Methodological quality assessment
The risk of bias and methodological quality varied among the included studies. Of the 57 studies, 13 (23%) were RCTs. As shown in Figure 2, in many of these trials, the risk of bias was found to be unclear due to insufficient information on the blinding of study personnel, allocation concealment and incomplete outcome data. Incomplete outcome data were mostly observed in cluster-randomized trials due to the loss of participating clusters (e.g. practices). In one trial, a number of prescribers were removed from the analysis as fewer cases were received than required by the study threshold.38 On the other hand, in another cluster-randomized trial, four practices (three from the intervention arm and one from the control arm) were excluded from the analysis because the contributed data did not match the intervention timeline.39 Additionally, only six of the included trials39–44 provided details of the methods used to conceal the allocation sequence, whereas one trial45 lacked a sufficient method to reduce the risk of selection bias in the study design. For the six remaining trials,38,45–50 there was an unclear risk of selection bias affecting their findings. Loss to follow-up was also reported in four studies, contributing to the risk of attrition bias in these trials. Thus, due to incomplete information, the magnitude and direction of the bias in the trials remain unclear. Due to the nature of the intervention, the blinding of healthcare professionals was not possible; however, lack of blinding could affect the study outcomes in either direction. Knowledge of the intervention received in a trial may affect the behaviour of trial participants—leading to a reporting of enhanced or reduced effect for subjectively determined outcomes, based on whether the participant believed in the efficacy of the intervention.

Summary of risk of bias assessments for the randomized controlled trials. This figure appears in colour in the online version of JAC and in black and white in the printed version of JAC.
Of the included trials, six were cluster RCTs38–40,42,44,48 with randomization carried out at an institutional level; however, in one trial, adjustment for clustering was not performed and so there were artificially precise results due to the unit-of-analysis error.39 To correct for this, each individual cluster was considered as a unit of analysis, thereby reducing the overall statistical power of the study.
A total of 44 NRSs were included in the review, with 36 pre–post (21 uncontrolled and 15 controlled pre–post studies), 5 cohort, 2 interrupted time series and 1 cross-sectional study (Table S1). These were appraised using ROBINS-I and were found to be generally of low quality. Of the included NRSs, seven studies (16%) indicated a moderate risk of bias due to confounding and missing data, whereas a high risk of bias was identified in 35 studies (79.5%) due to confounding, biased selection of participants, selective reporting and missing data. Two studies (4%) had an unclear risk of bias due to incomplete study design information.51,52 Most of the NRSs had compromised internal validity as the NRS design makes it difficult to account for all the possible confounding variables. There was also a lack of blinding of study participants and assessors in most studies, which may have overestimated the effect size for the subjectively assessed outcomes. Many of the studies allocated the same healthcare practitioners to the control and intervention study arms, potentially contaminating the CDSS effect.53–56 In a few NRSs, applicability of the results was compromised by the short follow-up period.57–61 To address the potential for effect modification due to type of study design, the meta-analyses were stratified into subgroups (RCTs and NRSs) to check whether the observed effects were robust, despite the high risk of bias associated with most of the NRS findings (see subgroup analysis section below).
Meta-analyses
Meta-analyses were conducted where data were available and so results were pooled for two study outcomes: the appropriateness of antibiotic therapy and mortality. The GRADEPro Summary of Findings table for these two outcomes is depicted in Table 2.
Summary of finding table for meta-analyses of CDSSs compared with standard care for antibiotic prescribing
| Outcomes | Anticipated absolute effectsa (95% CI) | Relative effect (95% CI) | Participants (studies) | Certainty of the evidence (GRADE) | |
|---|---|---|---|---|---|
| risk with standard care | risk with CDSS | ||||
| Appropriateness of antibiotic therapy | 643 per 1000 | 698 per 1000 (639–750) | OR 1.24 (0.95–1.62) | 1161 (2 RCTs) | ⨁⨁⨁◯ MODERATEb |
| 507 per 1000 | 729 per 1000 (673–778) | OR 2.45 (1.95–3.08) | 8197 (18 NRSs) | ⨁⨁◯◯ LOWc,d | |
| Mortality | 109 per 1000 | 104 per 1000 (90–121) | OR 0.95 (0.81–1.12) | 8369 (3 RCTs) | ⨁⨁⨁◯ MODERATEe |
| 49 per 1000 | 35 per 1000 (31–40) | OR 0.72 (0.63–0.82) | 42 364 (9 NRSs) | ⨁⨁◯◯ LOWc | |
The risk in the intervention group (and its 95% CI) is based on the assumed risk in the comparison group and the relative effect of the intervention (and its 95% CI).
Imprecision in point estimates due to small sample size and a small number of events.
Serious concerns encountered across the body of evidence in domains such as selection bias, performance bias and attrition bias. The study quality ranges from moderate to low. On the basis of study weights, sample size and number of outcome events, the overall quality of evidence is identified to be low.
The overall I2 value is 84.7% which indicates a serious variance in the point estimate. The results are statistically heterogeneous due to the different types of CDSSs used in different studies as well as conflicting results in uptake of the system.
Unclear risk of bias for allocation concealment encountered throughout the body of evidence. There was also a lack of blinding of participants and outcome assessors in included studies.
Appropriateness of antibiotic therapy
Overall, 26 studies reported data on the appropriateness of antibiotic therapy, with 23 conducted in hospital settings and two in primary care. Of the hospital-based studies, 20 (2 RCTs and 18 NRSs) reported sufficient data for a meta-analysis. The total sample size of studies was 9358 participants, with 4300 participants in the intervention arm and 5058 in the control arm.
To evaluate the impact of covariate and clustering adjustment on the overall pooled estimate, both adjusted and unadjusted data were taken into consideration in the meta-analyses (see Figure S1). Only five studies presented both adjusted and unadjusted estimates.40,57,58,62,63 For the final analysis, the adjusted estimates for these studies were taken into consideration. Overall, no substantial effect of clustering and covariate adjustment was identified in the pooled OR as shown in Figure S1.
CDSSs were positively associated with the appropriateness of antibiotic therapy, with an overall pooled OR of 2.28 (95% CI 1.82–2.86) (Figure 3). On the basis of the random-effects model, this pooled estimate indicated that on average CDSS-assisted prescriptions were twice as likely to be appropriate compared with standard care. According to individual effect estimates, 5 studies indicated no effect of the intervention on the outcome, whereas 15 studies reported a statistically significant and positive impact on the outcome. No study reported a negative impact of the CDSS on appropriate antibiotic prescribing behaviour. As shown in Figure 3, substantial between-study heterogeneity was observed (I2=80.8%, P < 0.001).
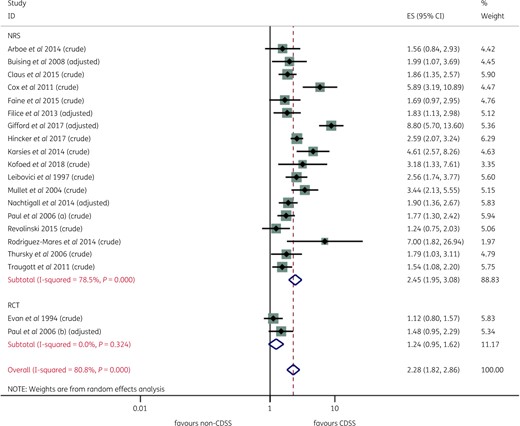
Effect of a CDSS on appropriateness of antibiotic therapy, by study design (RCTs and NRSs). This figure appears in colour in the online version of JAC and in black and white in the printed version of JAC.
Individual studies showing a comparatively higher magnitude of effect in the forest plot (Figure 3) were further analysed to determine the plausibility of the observed results. One common theme among these studies was the development or deployment of CDSSs to target a specific class of antibiotics (e.g. aminoglycosides) or infections (e.g. acute respiratory infections) for dosage management, monitoring and administration.57,64–67
Publication bias
Figure S2 shows a funnel plot for the impact of CDSSs on the appropriateness of therapy across 20 studies. The log OR was plotted on the x-axis against the precision of log OR for the evaluated studies. Asymmetry of the funnel plot indicates that most of the results on appropriateness of therapy were reported from studies with a larger sample size or smaller standard error. This also suggests that small studies with less precise results remain unpublished. However, the Egger statistic (P = 0.259) indicates that the results of the meta-analyses were likely to be unaffected by any small study effect for appropriateness of therapy. As Egger’s test, when using log OR, can produce artificially small P values, this result is probably conservative.36
Subgroup analysis
To further investigate the observed statistical heterogeneity, subgroup analysis was completed for different types of CDSSs (functional and platforms) and study types. CDSSs were found to be positively associated with an increase in the appropriateness of antibiotic therapy irrespective of CDSS type. As shown in Figure S3 and Figure S4, prescribing (pooled OR 2.40, 95% CI 1.76–3.28) and dose optimization systems (pooled OR 2.52, 95% CI 1.69–3.76) appeared to be slightly more effective than alerts/prompts (pooled OR 1.43, 95% CI 1.07–1.91), albeit all pooled analyses were affected by statistically significant heterogeneity. The I2 values of subgroups in Figure S3 and Figure S4 indicated that stratifying the findings by different functional domains or platforms (stand-alone, web-based and integrated into EHR/CPOE) had no effect on between-study heterogeneity. This suggests that the differences in the magnitude of the impact of CDSS on the appropriateness of antibiotic therapy could not be explained on the basis of CDSS characteristics or the types of systems implemented. Subgroup analysis on the basis of study type (RCTs versus NRSs) found that NRSs overestimated the impact of CDSSs on the appropriateness of antibiotic therapy (pooled OR 2.45, 95% CI 1.95–3.08) when compared with RCTs (pooled OR 1.24, 95% CI 0.95–1.62). However, the direction of effect was essentially the same (Figure 3).
A comparison between interventional and non-interventional studies, also showed that their results were similar (Figure S5). The pooled effect estimate in five non-interventional studies was 2.28 (95% CI 1.77–2.95) with I2 of 46.9% (P = 0.110) whereas in interventional studies it was 2.27 (95% CI 1.68–3.05) with I2 of 84.7% (P = 0.000). Figure S6 shows that the pooled OR was comparatively similar in both groups, but the between-study heterogeneity was less in the non-interventional study subgroup.
Mortality
A total of 19 hospital-based studies investigated the impact of a CDSS on mortality. This outcome was used as a surrogate measure for improvement in the quality of care as the purpose for implementing a CDSS is to improve antibiotic treatment and reduce mortality due to sepsis. Moreover, mortality is also taken as a balancing factor to ensure that the intervention did not result in an elevated health risk.32 Of these studies, 18 (2 RCTs and 16 NRSs) provided sufficient data to be included in the meta-analysis. The total sample size of the included studies is 58 715, with 29 875 in the control arm and 28 840 in the interventional arm.
Overall, the meta-analysis on the basis of the random-effects model showed that a CDSS resulted in an 18% relative reduction in mortality (pooled OR 0.82, 95% CI 0.73–0.91). As highlighted in Figure 4, the between-study heterogeneity was low to moderate, with I2 of 39.2% (P = 0.045).
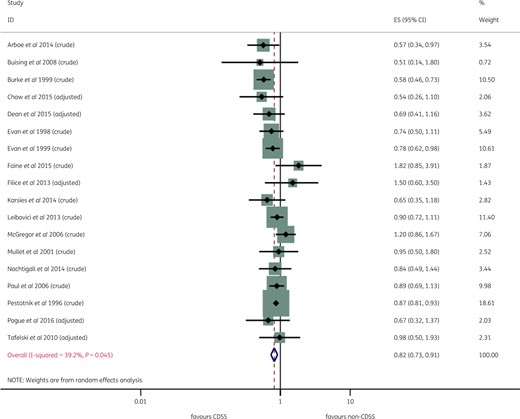
Forest plot of individual studies and meta-analysis for mortality. This figure appears in colour in the online version of JAC and in black and white in the printed version of JAC.
Publication bias
Figure S6 shows a funnel plot for the impact of a CDSS on mortality across 18 studies. The funnel plot indicated an asymmetric pattern with possible publication bias due to non-publication of small trials. However, the Egger statistic (P = 0.539) failed to reject the null hypothesis, indicating that it was unlikely that a small study effect had influenced the results of the meta-analysis.
Narrative synthesis
Volume of antibiotic use
In different healthcare settings, 20 studies (6 RCTs and 14 NRSs) assessed the overall use of antibiotics. Of these, five studies (25%) were carried out in primary care and 15 (75%) in hospitals. In these studies, results were presented as the number of antibiotic prescriptions before and after CDSS implementation, antibacterial agents administered per day and DDD (per 1000 or per 100 bed days), making it difficult to pool the results.
The total number of participants in the RCTs was 25 397, with 11 445 in the control arm and 13 952 in the intervention arm. Four of the included RCTs involved cluster randomization of clinics, practices or wards.39 The total sample size could not be determined for the NRSs due to limited information on participants in the pre- and postintervention population in five of the NRS studies.
As depicted in Table 3, overall antibiotic use decreased after implementation of a CDSS in 16 studies, with three studies reporting no effect of the intervention on the volume of antibiotic use. One study reported a +32% increase in antibiotic use in the postintervention group.68 This unexpected outcome may be the result of a decrease in the ICU length of stay. It may also be due to the age of the study as it is one of the oldest studies in the evidence base, hence clinical practice may have changed in the ensuing 20 years.
Impact of CDSS intervention on the overall volume of antibiotic use
| Study | Study setting | Unit | Non-CDSS | CDSS | Change | P value |
|---|---|---|---|---|---|---|
| Agwu et al. 2008 | hospital | doses/day (restricted antibiotics) | 125.8 | 111.8 | ↓ −11.13% | NR |
| Bourgeois et al. 2010 | primary care | proportion of total visits | 46% | 39.7% | ↓ −6.30% | 0.84 |
| Burke and Pestotnik 1999 | hospital | DDD/1000 PDsa | 226 | 299 | ↑ +32% | NR |
| Evan et al. 1999 | hospital | DDD/1000 PDsa | 2009 | 1956 | ↓ −2.64% | NR |
| Evan et al. 1998 | hospital | DDD/1000 BDsb | 1852 | 1619 | ↓ −12.58% | NR |
| Nault et al. 2018 | hospital | difference in DDD/1000 PDs (%)a | NA | NA | ↓ −12.2% | 0.02 |
| Okumura et al. 2016 | hospital | DDD/1000 BDs | 63.1 | 21.5 | ↓ −65.93% | NR |
| Pestotnik et al. 1996 | hospital | DDD/1000 OBDsa | 359 | 277 | ↓ −22.84% | NR |
| Rattinger et al. 2012 | primary care | proportion of unwarranted antibiotic prescriptions | 22% | 3.3% | ↓ −18.7% | <0.0001 |
| Tafelski et al. 2010 | hospital | antibacterial agents administered/day | 1.5 | 1.3 | ↓ −13.33% | <0.05 |
| Thursky et al. 2006 | hospital | DDD/1000 ICU BDsc | 1670 | 1490 | ↓ −10.78% | NA |
| Study | Study setting | Unit | Relative difference | P value | ||
| Bond et al. 2017 | hospital | change in level (95% CI) (DDDs/1000 OBDsa) | ↓ −58 (−87 to −29) | <0.01 | ||
| Gonzales et al. 2013 | hospital | OR (95% CI) | ↓ 0.64 (0.45–0.91) | 0.003 | ||
| Gulliford et al. 2014 | hospital | antibiotic rate prescriptions per 1000 years | mean difference (95% CI): ↓ −9.69 (−18.63 to −0.75) | 0.034 | ||
| Huh et al. 2016 | hospital | change in slope (95% CI) (DDD/1000 PDs)b | ↑ −1.95 (−2.93 to −0.96) | <0.01 | ||
| Linder et al. 2009 | primary care | OR (95% CI) | ↔ 0.80 (0.6–1.2) | 0.30 | ||
| McCullough et al. 2014 | primary care | RR (95% CI) | ↓ 0.81 (0.66–0.96) | NR | ||
| McGinn et al. 2013 | primary care | RR (95% CI) | ↓ 0.74 (0.6–0.92) | 0.008 | ||
| Mullet et al. 2001 | hospital | mean (SD)d | ↑ 2.2 (−1.53 to 5.53) | NS | ||
| Shojania et al. 1998 | hospital | mean (SD)d | ↓ −5.4 (−10.7 to −0.09) | 0.04 | ||
↓, Decrease; ↑, increase; ↔, no effect; NA, not available; NS, not significant; NR, not reported; RR, relative risk.
Defined daily dosage/1000 occupied bed days (OBDs).
Defined daily dosage/1000 patient days (PDs).
Defined daily dosage/1000 bed days (BDs).
Computed as Hedges’ g.
Length of stay
Seventeen studies (3 RCTs and 14 NRSs) evaluated the impact of a CDSS on the length of hospital stay. The results are given in Table 4. In 12 of the studies, effect estimates indicate a reduction in length of stay, whereas no effect was observed in five studies, presumably due to the small sample sizes. One study provided conflicting results. That study, by Nachtigall et al.62 found that hospital stays increased after the implementation of a CDSS. No specific reason could be identified, although this study also reported an increase in antibiotic-free days from 30% to 44% (P value <0.01). Therefore, despite the increase in hospital stay, aggregate antibiotic consumption was reduced.
Impact of CDSS intervention on length of hospital stay (days)
| Study | Non-CDSS, mean (SD) | CDSS, mean (SD) | Change | P value |
|---|---|---|---|---|
| Agwu et al. 2008 | 6.78 (14.3) | 6.67 (14.1) | ↓ −1.63% | 0.65 |
| Bond et al. 2017 | 2.1 (0.6–5.6) | 1.9 (0.5–5.0) | ↓ −10% | NR |
| Burke and Pestotnik 1999 | 10.28 | 8.84 | ↓ −14% | NR |
| Pestotnik et al. 1996 | 7.5 | 7.3 | ↓ −2.70% | NR |
| Rodriguez-Maresca et al. 2014 | 20.1 | 19.7 | ↓ −2.01% | 0.94 |
| Sintchenko et al. 2005 | 7.15 (0.29) | 6.22 (0.99) | ↓ −13.01% | 0.02 |
| Vermeulen et al. 2014 | 14.6 (12.5) | 12.1 (11.6) | ↓ −17.12% | <0.001 |
Relative difference | ||||
| Study | Non-CDSS, mean (SD) | CDSS, mean (SD) | SMD (95% CI) | P value |
| Arboe et al. 2014 | 6.5 (10) | 5 (17.16)a | ↔ −0.11 (−0.42 to 0.02) | NR |
| Buising et al. 2008 | 15 (29a) | 13 (27.75)a | ↔ −0.07 (−0.46 to 0.32) | NR |
| Burton et al. 1991 | 17.6 (1.6) | 13 (6.9) | ↓ −0.93 (−1.26 to −0.58) | 0.013 |
| Evan et al. 1998 | 12.9 (20.47) | 10 (16.72) | ↓ −0.15 (−0.25 to −0.05) | 0.001 |
| Evan et al. 1999 | 7 (8.6) | 6.6 (7.4) | ↓ −0.05 (−0.08 to −0.01) | 0.001 |
| Giuliano et al. 2011 | 15.7 (24.7) | 17.8 (18.5) | ↔ 0.097 (−0.24 to 0.43) | 0.58 |
| McGregor et al. 2006 | 3.99 (4.61a) | 3.84 (4.54)a | ↔ −0.03 (−0.09 to 0.02) | 0.38 |
| Nachtigall et al. 2014 | 9.2 (10.7) | 11.3 (12.2) | ↑ 0.18 ( 0.03 to 0.34) | 0.01 |
| Paul et al. 2006 | 9.45 (11.5) | 8.83 (11.3) | ↓ −0.05 (−0.14 to −0.03) | 0.05 |
| Pogue et al. 2016 | 8 (5.97)a | 10.3 (8.59)a | ↔ −0.14 (−0.34 to 0.06) | <0.001 |
↓, Decrease; ↑ increase; ↔ no effect; NR, not reported; SMD, standardized mean difference.
Estimation of mean and SD using estimation method.30
Duration of antibiotic therapy
Five studies (three RCTs and two NRSs) reported on the duration of antibiotic therapy. As shown in Table 5, there was a significant reduction in the duration of antibiotic therapy after the implementation of a CDSS in all studies. This decrease was evident in both hospital (n = 3) and primary care settings (n = 2).
Impact of CDSS intervention on duration of antibiotic therapy
| Study | Study setting | Unit of measure | Non-CDSS | CDSS | Change | P value |
|---|---|---|---|---|---|---|
| Chritakis et al. 2001 | primary care | change in mean outcome | 10.48% | 44.43% | ↓ −323.95% | P<0.01 |
| Davis et al. 2007 | primary care | change in mean outcome | 13% | 7% | ↓ −6% | NR |
| Shojania et al. 1998 | hospital | days, mean (SD) | 2.0 (SD 1.1) | 1.8 (SD 1.1) | ↓ −10.50% | 0.05 |
| Nault et al. 2018 | hospital | days, level change (SE) | NR | NR | ↓ −0.92 (0.3) | P<0.01 |
| Evans et al. 1998 | hospital | h, mean (SD) | 263 (441) | 128 (169) | ↓ −51.33% | NR |
↓ Decrease; NR, not reported; SE, standard error.
Cost of therapy
To evaluate the economic implications of CDSS implementation, nine studies (three RCTs and six NRSs) provided information on the effect of a CDSS on overall cost of antibiotic therapy. The direct cost of therapy per patient, annual cost of therapy and total cost of hospitalization in pre- and postintervention populations were recorded in the included studies. In two studies,40,67 the total cost of therapy also took into consideration factors such as cost relating to expected adverse effects and the ecological impact of antibiotic inefficacy (future resistance) along with the direct cost of therapy. The ecological component summed three basic factors: individual cost; ecosystem cost due to the emergence of resistance to current therapeutics; and penalty for using last-resort drugs.
Despite differences in the measurement unit of the cost analysis, a reduction in the overall cost of antibiotic therapy was reported in seven studies (Table 6). The cost of therapy is depicted in different currencies such as US Dollars, Australian Dollars and Euros, depending on the origin of the study. In one Australian study,58 the mean cost of therapy per patient for pneumonia increased by 16.60% after implementation of a CDSS. This study was carried out over three time periods beginning with baseline, academic detailing and CDSS. The academic detailing period comprised 2 days of face-to-face training on antibiotic prescriptions. The cost was observed to increase from baseline to the second timepoint (academic detailing portion), but decreased from the second to the third timepoint (CDSS) during the study. This would appear to be consistent with results reported in the other studies.
Impact of CDSS intervention on the cost of antibiotic therapy
| Study | Study setting | Study location | Unit of measure | Non-CDSS | CDSS | Change | P value |
|---|---|---|---|---|---|---|---|
| Buising et al. 2008 | hospital | Australia | mean cost per patient for pneumonia (AUD) | 72.07 | 84.04 | ↑ 16.60% | NR |
| Evans et al. 1998 | hospital | USA | mean cost per patient (USD) | 340 | 102 | ↓ −70% | <0.001 |
| Evans et al. 1999 | hospital | USA | mean cost per patient (USD) | 92.96 | 80.62 | ↓ −13.27% | <0.02 |
| Evans et al. 1994 | hospital | USA | mean cost per patient (USD) | 51.93 | 41.08 | ↓ −20.89% | <0.001 |
| Kofoed et al. 2008 | hospital | Denmark | mean cost per treatment (Euro) | 624 | 528 | ↓ −15.38 | 0.06 |
| McGregor et al. 2006 | hospital | USA | total cost of antibiotics for study period (USD) | 370 006 | 28 5812 | ↓ −22.75% | NR |
| Mullet et al. 2001 | hospital | USA | total cost per patient (USD) | 274.79 | 289.60 | ↓ −5.39% | NS |
| Paul et al. 2006 | hospital | Israel, Germany and Italy | mean cost per patient (Euro) | 623.2 | 565.4 | ↓ −9.27% | 0.473 |
| Pestotnik et al. 1996 | hospital | USA | mean cost per treated patients (USD) | 122.66 | 51.90 | ↓ −57.69% | NR |
NS, not significant; NR, not reported; AUD, Australian Dollar; USD, US Dollar.
Discussion
The aim of this systematic review was to assess the potential of a CDSS in promoting appropriate antibiotic treatment in hospitals and primary care settings. Our study examined how operational and functional differences in these systems influence the study outcomes and decision-making processes in healthcare settings. Due to the scope and breadth of this review, the analysis was based on many studies that were not included in previous reviews. The positive outcomes reported in this study are consistent with the findings of previous systematic reviews.13,14,17,69 However, these reviews differed in their scope, study settings, study inclusion criteria and definition of a CDSS. Our study contributes to the existing body of evidence by providing a specific evaluation of CDSSs across different healthcare settings and a broad range of health outcomes, and it explores whether different types of systems produce different health benefits.
The included studies assessed the performance of CDSSs by measuring health-related outcomes of antibiotic appropriateness, the volume of prescribed antibiotics, length of hospital stay, duration of antibiotic therapy, mortality and costs of therapy. A total of 57 studies were included in this systematic review, comprising 13 RCTs and 44 NRSs. Studies varied in how they reported the performance of a CDSS for antibiotic stewardship. There was also large variability in the types of CDSS and outcome measures in these studies. The review outcomes were based on studies that were mostly of moderate to low methodological quality.
We found evidence in favour of CDSSs for promoting appropriate antibiotic therapy. The meta-analyses showed that a CDSS has the potential to improve appropriateness of therapy and reduce mortality by providing evidence-based recommendations using local or national prescription guidelines and in vitro organism susceptibility results. Moreover, studies also reported a reduction in the overall volume of antibiotic use, duration and cost of therapy. The majority of the evidence came from studies with moderate to low methodological quality because of inherent biases in non-randomized study designs. Due to the nature of digital health interventions, it is usually difficult to adopt a randomized study design. Factors such as administrative feasibility and contamination make randomization difficult for these types of studies. The pooled results of the NRSs did overestimate the impact of CDSSs on appropriate antibiotic prescribing in comparison with the pooled RCT evidence (only two studies). However, the RCT studies showed results in the same direction.
Certain health risks may result from a reduction in antibiotic usage, particularly for immunocompromised or elderly patients. Therefore, studies reporting on markers of safety, such as duration of hospital stay, and mortality were included. We found that mortality and length of stay remained unchanged or reduced in some studies following CDSS implementation. However, a smaller sample size and shorter follow-up period in many studies limit the generalizability of intervention effects over an extended time period.57–62,70–72
Despite considerable between-study heterogeneity, improvement in the quality of antibiotic management was reported in the majority of studies. The meta-analysis highlighted that antibiotics prescribed using a CDSS may be up to twice as likely to be compliant with guidelines or in vitro susceptibility test results. This suggests that a CDSS can be an effective intervention to optimize antibiotic prescription processes. The observed heterogeneity was expected due to the variability in decision support systems, implementation processes, settings of use, type of infections, clinician compliance with systems and the study designs. What is important, however, is that although the magnitude of the effect of CDSSs varied across studies, the direction of the effect was largely consistent—favouring CDSSs.
Subgroup analysis exploring the impact of different types of CDSSs and study designs indicated that a CDSS improves the appropriateness of antibiotic therapy irrespective of platform, CDSS characteristics or study type. It was evident that variability in the implementation process and system uptake in different settings were the likely explanations for statistical heterogeneity across studies. In non-interventional studies, patients’ data were used to evaluate the appropriateness of therapy recommended by the CDSS. Due to the nature of these studies, systems were not actually implemented in healthcare settings. Therefore, factors associated with adoption of a CDSS such as clinicians’ willingness, system uptake, organizational limitations and implementation constraints may not have been considered.73,74 Clinician compliance and uptake is a major concern for the adoption of health-related technologies and can cause interventions to fail to provide benefits in the long term.18 Our findings further indicated that studies adopting a need-based and focused approach for the development and deployment of a CDSS showed a higher magnitude of effect for promoting appropriateness of antibiotic therapy.57,64–66 However, due to limited evidence, it was difficult to clearly identify the factors separating a higher magnitude of effect from less favourable results in other studies.
We found that interventions resulted in promoting evidence-based prescriptions by reducing the risk of unwarranted and unnecessary prescriptions. However, many studies had a short follow-up period. It is unclear whether the positive impact of a CDSS would reduce over a longer period of time. The common theme arising from previous reviews suggests that the lack of effective implementation and end-user acceptance could greatly limit the clinical benefits of a CDSS in diverse healthcare settings.13,19 The end-user and stakeholder inclinations and decision mapping need to be considered to promote end-user-oriented system design.13 The consideration of the dynamics of the decision-making process in clinical settings and environment-specific system requirements may improve system integration and uptake in clinical settings.
Despite the fact that primary care is the major setting of antibiotic misuse, there were comparatively few studies on the effect of a CDSS in this setting. Only three of the included studies reported data on appropriateness of therapy, four on volume of antibiotic use and two on duration of antibiotic therapy in primary care. Given the small number of studies in primary care, we had limited evidence available on the beneficial effect of a CDSS on patient and economic outcomes within the community.
Limitations
Several studies included in this review were uncontrolled pre–post intervention studies with inherent methodological limitations due to the lack of a control arm. Even the controlled NRSs were probably affected by confounding and blinding of study personnel. The short follow-up period in many studies may have provided a biased effect estimate. In the comparison of RCTs with NRSs, the pooled results indicated that the NRSs are more likely to overestimate the benefits of a CDSS. Nevertheless, even though the magnitude of the effect differed by study design (and possible biases), the direction of the effect was consistent. The statistical heterogeneity observed could not be explained completely by the diverse range of system types, study settings and contextual features in the included studies. We investigated the possible impact of publication bias and did find asymmetry in the funnel plots, indicating that small or medium-sized trials reporting either a positive or a negative effect of a CDSS remain unpublished. However, the statistical test for publication bias suggests that it is unlikely that the omission of these studies has influenced the pooled effect estimates.
There was limited published research evidence on the effectiveness of CDSSs specifically in primary care settings, so the findings of this review must only be cautiously applied to the broader context of primary care.
Conclusions
Our study demonstrates that a CDSS has great potential to optimize antibiotic management by increasing adherence to evidence-based care. After the CDSS intervention, improvements in clinical and economic outcomes and appropriate antibiotic therapy were identified across different healthcare settings and different types of CDSSs. Successful implementation of a CDSS appears to optimize antibiotic management by increasing compliance with the guidelines or in vitro susceptibility test results, but the magnitude of benefit is likely to vary. Future studies need to focus on study quality and follow-up period to provide evidence on long-term efficacy of CDSSs with higher certainty. In order to achieve the anticipated benefit, it will also be necessary to focus on the specific functional requirements of the system as well as an implementation process that will facilitate CDSS uptake in different settings.
Funding
This study was carried out as part of our routine work. M.L. is a recipient of an Adelaide Scholarship International (ASI).
Transparency declarations
None to declare.
References
U.S. Centres for Disease Control and Prevention. Antibiotic Resistance Threats in the United States,
WHO.
