


Abstract
To determine the β-lactam exposure associated with positive clinical outcomes for Gram-negative blood stream infection (BSI) in critically ill patients.
Pooled data of critically ill patients with mono-microbial Gram-negative BSI treated with β-lactams were collected from two databases. Free minimum concentrations (fCmin) of aztreonam, cefepime, ceftazidime, ceftriaxone, piperacillin (co-administered with tazobactam) and meropenem were interpreted in relation to the measured MIC for targeted bacteria (fCmin/MIC). A positive clinical outcome was defined as completion of the treatment course or de-escalation, without other change of antibiotic therapy, and with no additional antibiotics commenced within 48 h of cessation. Drug exposure breakpoints associated with positive clinical outcome were determined by classification and regression tree (CART) analysis.
Data from 98 patients were included. Meropenem (46.9%) and piperacillin/tazobactam (36.7%) were the most commonly prescribed antibiotics. The most common pathogens were Escherichia coli (28.6%), Pseudomonas aeruginosa (19.4%) and Klebsiella pneumoniae (13.3%). In all patients, 87.8% and 71.4% achieved fCmin/MIC ≥1 and fCmin/MIC >5, respectively. Seventy-eight patients (79.6%) achieved positive clinical outcome. Two drug exposure breakpoints were identified: fCmin/MIC >1.3 for all β-lactams (predicted difference in positive outcome 84.5% versus 15.5%, P < 0.05) and fCmin/MIC >4.95 for meropenem, aztreonam or ceftriaxone (predicted difference in positive outcome 97.7% versus 2.3%, P < 0.05).
A β-lactam fCmin/MIC >1.3 was a significant predictor of a positive clinical outcome in critically ill patients with Gram-negative BSI and could be considered an antibiotic dosing target.
Introduction
Gram-negative bloodstream infections (BSIs) are associated with a high burden in critically ill patients, with mortality rates commonly exceeding 15%.1,2 Emergence of resistant bacteria associated with ineffective initial therapy is an additional challenge faced by clinicians. β-Lactam antibiotics, with broad-spectrum activity against Gram-negative bacteria, are commonly used in this setting.
The efficacy of β-lactams is closely correlated with the percentage of time where the unbound (or free) drug concentration remains above the MIC for the targeted bacteria (%fT>MIC). Early in vitro and animal studies suggest that, depending on the subclass of β-lactam, a pharmacokinetic/pharmacodynamic (PK/PD) index of at least 30%–60% fT>MIC is required for bactericidal effect; however, trough (minimum) antibiotic concentrations up to 5–6× MIC (fCmin/MIC >5) have been associated with improved clinical outcomes in previous reports of patients with sepsis and/or lower respiratory tract infections.3–5 It follows that uncertainty remains as to what the optimal PK/PD index is for β-lactams in critically ill patients, particularly in the context of Gram-negative BSI.
In this study, we aim to describe β-lactam PD in critically ill patients with Gram-negative BSI in order to define drug exposures that may be associated with improved patient outcomes.
Patients and methods
Patient selection
Cases included in this analysis were selected from a database that was constructed using two prospectively collected data sets of critically ill adult patients in which various demographic, clinical outcome and PK data were available. The data sets were from the therapeutic drug monitoring (TDM) databases from the tertiary referral ICUs within Erasme Hospital (Belgium)6 and the Royal Brisbane and Women’s Hospital (Australia).7 Inclusion criteria for the present analysis included a documented BSI caused by a single Gram-negative pathogen, admission to an ICU and age ≥18 years. Exclusion criteria were presence of renal replacement therapy and polymicrobial BSI. For the respective databases, there were no significant differences between the primary protocols used at the two sites, other than the β-lactam assays used (described below), and the exclusion of patients with burns and cystic fibrosis from the Belgian database. All participants were enrolled between 2009 and 2014.
β-Lactam antibiotics included in the analysis were aztreonam, cefepime, ceftazidime, ceftriaxone, piperacillin (co-administered with tazobactam) and meropenem. Individual antibiotic, dosing and infusion time were determined by the treating clinician and according to local guidelines.
Ethics
TDM of broad-spectrum β-lactam antibiotics is performed routinely in septic patients at the participating sites. Approval to analyse these data was granted by the local institutional review boards for the respective cohorts. The need for informed consent was waived in view of the retrospective nature of the study.
Data collection
The definitions used for the clinical endpoints are presented in Table 1. Data collection was conducted by trained staff at each participating centre and entered into an electronic case report form. The database contained information on each patient’s age, sex, weight, serum and urine creatinine concentrations, measured CLCR, APACHE II score, BSI causative pathogen, calculated or directly measured unbound β-lactam antibiotic concentration at trough to MIC (fCmin/MIC), and clinical outcome. Twenty-four hour urine collections via an indwelling catheter and measurement of serum creatinine concentrations are performed daily, allowing for measured CLCR to be calculated, according to the following formula: measured CLCR=(urinary creatinine × urine volume)/(serum creatinine × duration of urine collection). The MICs for the targeted pathogen were determined by the local microbiology laboratory using Etest or the VITEK® 2 (bioMérieux, Inc., Durham, NC, USA) automated system. The EUCAST breakpoint for susceptibility was used for classifying susceptibility of isolates.
Definitions of clinical outcomes
| Clinical outcome | |
|---|---|
| Positive clinical outcome | Completion of treatment course without change or addition of antibiotic therapy, and with no additional antibiotics commenced within 48 h of cessation. De-escalation to a narrower-spectrum antibiotic was permitted. |
| Negative clinical outcome | Any clinical outcome other than positive clinical outcome. |
Sampling collection
A single blood sample was taken from the participant at the end of a dosing interval (trough) at steady-state (defined as >24 h after initiation of therapy). Total (n = 79) or unbound (n = 19) drug concentrations were analysed by a validated protocol using HPLC with UV detection with or without ultrafiltration as previously described.8,9 Measurement of total drug concentrations was only applied to low protein-bound β-lactams.
Statistical analysis
Demographic, clinical and PK/PD-related data are presented as n (%), mean ± SD or median (IQR), as appropriate. Associations between patient or microbiological factors and patient outcome were assessed using χ2 and Fisher’s exact analyses where appropriate for nominal data, and Student’s t-tests or Wilcoxon rank sum tests for interval data. The most significant drug exposure breakpoint associated with positive clinical outcome was determined by classification and regression tree (CART) analysis in line with previous studies.10,11 A P < 0.05 was considered statistically significant.
Results
Demographics and clinical data
Ninety-eight patients were eligible for this study. The demographic and clinical features of the patients are described in Table 2. There were no significant patient or clinical characteristic differences found between patients with positive or negative clinical outcomes. The most frequently prescribed antibiotics were meropenem (n = 46; 46.9%), piperacillin/tazobactam (n = 36; 36.7%) and ceftazidime (n = 10; 10.2%). The isolated pathogens and corresponding MICs of the treatment antibiotics are listed in Table 3. The most prevalent isolates were Escherichia coli (n = 28; 28.6%), Pseudomonas aeruginosa (n = 19; 19.4%) and Klebsiella pneumoniae (n = 13; 13.3%).
Demographics and clinical characteristics of patients studied
| Characteristic | Overall (N = 98) | Positive outcome (N = 78)a | Negative outcome (N = 20)a |
|---|---|---|---|
| Age (years), mean ± SD | 59 ± 16 | 59 ± 16 | 57 ± 17 |
| Male sex, n (%) | 67 (68.4) | 53 (67.9) | 14 (70.0) |
| BMI (m2/kg), mean ± SDb | 26.7 ± 5.5 | 26.8 ± 5.8 | 26.4 ± 4.3 |
| APACHE II score, mean ± SD | 21 ± 7 | 21 ± 7 | 20 ± 8 |
| Measured CLCR (mL/min), median (IQR)c | 77.5 (4–402) | 92.0 (49.3–120.5) | 103 (50.3–132.4) |
| Augmented renal clearance, n (%)d | 22 (22.4) | 16 (20.5) | 6 (30.0) |
No significant difference between groups (P > 0.5).
Data only available for 79 patients.
Based on 24 h urinary CLCR.
Defined as CLCR >130 mL/min.
Microbiological pathogens of BSI (N = 98) and MICs of corresponding β-lactams
| MIC (mg/L), median (range) | |||||||
|---|---|---|---|---|---|---|---|
| Pathogen | n (%) | TZP | MEM | CAZ | CRO | ATM | FEP |
| Acinetobacter baumannii | 1 (1.0) | 64 | — | — | — | — | — |
| Citrobacter koseri | 2 (2.0) | 1.5 | 0.012 | — | — | — | — |
| Enterobacter aerogenes | 4 (4.1) | — | 1.125 (0.25–6) | — | — | — | — |
| Enterobacter cloacae | 9 (9.2) | 3 (2–8) | 0.157 (0.016–0.25) | — | — | — | — |
| E. coli | 28 (28.6) | 3 (1.5–8) | 0.023 (0.016–0.25) | 0.19 (0.125–0.25) | 1.5 (1–2) | — | — |
| Klebsiella oxytoca | 5 (5.1) | 8 | 0.032 (0.032–0.064) | 0.064 | — | — | — |
| K. pneumoniae | 13 (13.3) | 4 (1.5–8) | 0.023 (0.016–48) | — | — | — | — |
| Klebsiella spp. | 2 (2.0) | 4 | 0.25 | — | — | — | — |
| Morganella morganii | 3 (3.1) | 1.5 | 0.0785 (0.032–0.125) | — | — | — | — |
| P. aeruginosa | 19 (19.4) | 8 (2–256) | 4.25 (0.012–48) | 5.5 (1.5–32) | — | 18 (12–24) | 132 (8–256) |
| Proteus mirabilis | 9 (9.2) | 0.75 (0.25–1) | 0.064 (0.032–0.125) | — | — | — | — |
| Proteus vulgaris | 1 (1.0) | — | 0.064 | — | — | — | — |
| Serratia liquefaciens | 1 (1.0) | 4 | — | — | — | — | — |
| Serratia marcescens | 1 (1.0) | — | 0.064 | — | — | — | — |
TZP, piperacillin/tazobactam; MEM, meropenem; CAZ, ceftazidime; CRO, ceftriaxone; ATM, aztreonam; FEP, cefepime.
Clinical outcome and PK/PD data
The daily antibiotic doses, fCmin/MIC ratios and clinical outcome data are shown in Table 4. Overall, 71.4% of patients had an fCmin/MIC ratio of >5. Seventy-eight (79.6%) patients had a positive clinical outcome. There was a large variation in fCmin/MIC. No significant difference in the median APACHE II scores for patients with positive and negative clinical outcomes was found [20 (IQR 10–40) and 20.5 (IQR 10–35), respectively]. Other patient or microbiological characteristics including BMI and CLCR were not significantly associated with patient outcome.
PK/PD index and clinical outcome for studied β-lactam antibiotics in critically ill patients treated for Gram-negative BSI
| fCmin/MIC ratio, n (%) | |||||
|---|---|---|---|---|---|
| Antibiotic, n (%) | Daily dose (g), median (IQR) | <1 | 1–5 | >5 | Positive clinical outcome, n (%) |
| Aztreonam, 2 (2.0) | 7.0 (6.0–5.0) | — | — | 2 (100.0) | 2 (100.0) |
| Ceftazidime, 10 (10.2) | 6.0 (4.0–12.0) | — | 3 (30.0) | 7 (70.0) | 7 (70.0) |
| Cefepime, 2 (2.0) | 6.0 (6.0–6.0) | 2 (100.0) | — | — | 0 (0.0) |
| Ceftriaxone, 2 (2.0) | 3.0 (2.0–4.0) | — | — | 2 (100.0) | 2 (100.0) |
| Meropenem, 46 (46.9) | 3.0 (2.0–6.0) | 3 (6.5) | 4 (8.7) | 39 (84.8) | 42 (91.3) |
| Piperacillin/tazobactam, 36 (36.7) | 16.0 (8.0–16.0) | 7 (19.4) | 9 (25.0) | 20 (55.6) | 25 (69.4) |
| Overall (N=98) | 12 (12.2) | 16 (16.3) | 70 (71.4) | 78 (79.6) | |
PK/PD outcome was measured in terms of the ratio of unbound trough (fCmin) to MIC for the pathogen of corresponding β-lactams.
A positive clinical outcome was associated with an fCmin/MIC >1.3 (Figure 1), with 84.5% of patients achieving this exposure manifesting a positive clinical outcome. When outcome was analysed based on types of β-lactam used, positive outcome was associated with receiving meropenem, aztreonam or ceftriaxone, at a higher ratio of fCmin/MIC >4.95, with 97.7% of these patients manifesting a positive clinical outcome (Figure 2). No adverse events deemed to be associated with β-lactam use were reported among studied patients.
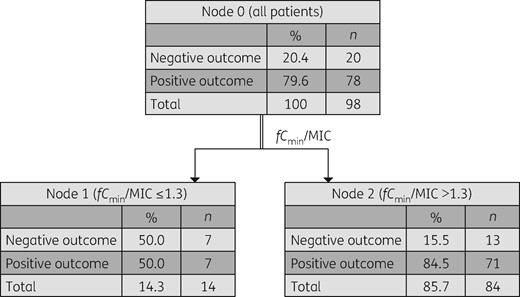
CART analysis for association of the fCmin/MIC with positive clinical outcome in all studied patients (N = 98; P < 0.05). Positive outcome was associated with an fCmin/MIC ratio of >1.3.
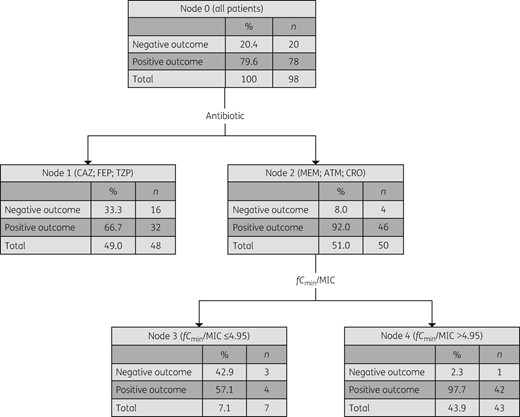
CART analysis for association of the fCmin/MIC ratio with positive clinical outcome in patients, according to β-lactam antibiotics received. Positive clinical outcome is associated with a significantly higher fCmin/MIC ratio of >4.95 in patients who received meropenem, aztreonam or ceftriaxone (N = 50; P < 0.05). CAZ, ceftazidime; FEP, cefepime; TZP, piperacillin/tazobactam; MEM, meropenem; ATM, aztreonam; CRO, ceftriaxone.
Discussion
In this study, we observed that positive clinical outcome in critically ill patients with Gram-negative BSI was associated with unbound trough β-lactam concentrations >1.3 times the MIC for the causative pathogen. We also found that a higher exposure of fCmin/MIC >4.95 was significantly associated with an even higher positive clinical outcome (97.7% positive clinical outcome) in patients specifically treated with meropenem, aztreonam or ceftriaxone.
The PD results of this study support the findings from previous smaller cohort studies in patients with other infection syndromes and which included either actual measured drug exposures or simulated drug exposures. In an open-label study involving 36 patients with Gram-negative infection treated with cefepime, Tam et al.4 demonstrated that 80% microbiological success was correlated with a minimum of 83% fT>4.3×MIC. No association with clinical success was demonstrated in that study, and this was attributed to the relatively small sample size. In another study of 33 patients with Gram-negative pneumonia treated with cefepime, an fCmin/MIC ratio of >2.1 was found to be associated with significantly lower risk of clinical failure (failure defined as persisting symptoms, change in antibiotic therapy and/or mortality).3 One may expect that a higher antibiotic concentration is necessary for treating pneumonia to achieve adequate local exposure at the site of infection;12 however, the discrepancy found could be due to a much lower severity of illness (median APACHE II score of 13) as compared with our patient cohort where the median APACHE II score was 20. A third study, which used dosing simulations from a population PK model developed in patients with lower respiratory tract infections treated with meropenem, concluded that an fCmin/MIC ratio of >5 was associated with positive clinical (failure defined as persisting symptoms, change in antibiotic therapy and/or mortality) and microbiological outcomes.5
It should be noted that each of these previous studies included only one drug in their analyses, and the transferability of such results to other β-lactams has been unclear. The results of the present study support those previously described exposures, confirming that these exposures exceeding the MIC are also beneficial in BSI and are probably a class effect for β-lactams, including piperacillin/tazobactam, in critically ill patients. Our results also advance the previous studies by measuring antibiotic concentrations at the site of infection (blood), where the causative pathogen is most likely to be found.
Our study has several limitations. Firstly, the number of cases in the analysis is relatively small to measure the effects of drug exposure on patient outcome. However, it is the largest sample to date where actual measured concentrations have been analysed in this manner. Significance was only demonstrated when data for several studied antibiotics were aggregated, especially for aztreonam and ceftriaxone, which might introduce bias associated with stratifying based on selected antibiotics. Secondly, measured unbound antibiotic concentrations were only available for a small portion of the samples, which potentially introduces bias in unbound concentrations of β-lactams calculated from total concentrations. However, hypoalbuminaemia mostly affects the highly protein-bound β-lactams, where the number of samples is minimal in this cohort. Thirdly, microbiological outcome of clearance of bacteraemia was not measured. Also, we were unable to examine and control the impact of other important variables that were previously shown to be independent factors associated with mortality, such as secondary sites of infection and clinical severity.13,14 Nevertheless, we demonstrated a PK/PD threshold that is most likely to be associated with clinical success for a group of broad-spectrum β-lactams, providing an important insight into the PD endpoint for future TDM studies of this frequently used antibiotic group in the critically ill.
In conclusion, this analysis demonstrated that an fCmin/MIC >1.3 was significantly associated with a positive clinical outcome in critically ill patients with Gram-negative BSI treated with the studied β-lactams. In patients treated with meropenem, ceftriaxone and aztreonam, the attainment of a higher unbound antibiotic exposure as measured by fCmin/MIC > 4.95 was predictive of a positive clinical outcome in an ever higher proportion of patients. These results warrant validation by interventional prospective studies with a larger sample size to test whether optimized β-lactam dosing in critically ill patients with Gram-negative BSI can improve patient outcomes when an fCmin/MIC >1.3 is achieved.
Funding
This study was carried out as part of our routine work. J.A.R. received salary funding from the National Health and Medical Research Council of Australia; Practitioner Fellowship (APP1117065). We wish to acknowledge institutional and salary funding from the Australian National Health and Medical Research Council for Centre of Research Excellence (APP1099452).
Transparency declarations
None to declare.
