


Abstract
Bone mineral density (BMD) decreases with ART initiation with a tenofovir disoproxil fumarate-containing regimen, although bone tissue quality increases. The impact of dolutegravir (DTG)/abacavir (ABC)/lamivudine (3TC)-based ART initiation on bone health parameters is not clear.
To study the impact of DTG/ABC/3TC-based therapy on bone health parameters in ART-naive individuals with HIV after 48 weeks of treatment.
An observational, prospective and analytical study of treatment-naive patients with HIV undergoing a DTG/ABC/3TC-based regimen at 48 week follow-up. Changes in bone strength parameters (BMD, bone microarchitecture and bone tissue quality) were assessed with non-parametric methods.
Sixteen HIV-infected ART-naive patients starting DTG/ABC/3TC were included. BMD in the lumbar spine showed a significant decrease of −2.25% (P = 0.007) and −4.1% in the femoral neck (P = 0.007). Bone microarchitecture, as measured by trabecular bone score, also decreased significantly by −2.5% (P = 0.03). In contrast, bone quality [bone material strength index (BMi)], as measured by microindentation, significantly increased with respect to baseline after 48 weeks of treatment, showing better bone properties of +6.53% (P < 0.001). No significant changes were found in bone turnover markers. In addition, a positive significant correlation between the CD4/CD8 cell count ratio at baseline and changes in BMSi after 48 weeks of treatment was observed (Spearman’s rho = 0.4974; P = 0.04).
After a 48 week treatment with DTG/ABC/3TC-based ART, BMD and trabecular bone score decreased while bone tissue quality, as measured by microindentation, improved significantly. The state of the immune system at ART initiation is related to bone quality recovery. An overarching approach to assess bone toxicity in ART-treated patients is needed.
Introduction
Due to the introduction of combination ART, HIV has become a chronic disease, and HIV patient survival has improved so much so as to achieve a life expectancy similar to that of the general population.1–3 As a result of such advances, new challenges have emerged such as improving quality of life of HIV patients and reducing non-AIDS comorbidities, including osteoporosis.4
In people living with HIV (PLWHIV), there is a loss of bone mineral density (BMD) and bone tissue quality, which is attributable in part to inflammatory changes induced by exposure to the virus.5 The role of ART in impaired bone health has also been established.6,7 However, as previously published, after administering a tenofovir disoproxil fumarate-based ART regimen, our group reported a significant decrease in BMD but an increase in bone tissue quality.8 It has been consistently proven that tenofovir disoproxil fumarate exposure is associated with increased fracture risk, especially in the first year after ART initiation. However, some studies indicate that starting ART may reduce the incidence of fractures regardless of the regimen chosen.9
The mechanisms behind these associations are not clear. HIV infection and/or the toxicity of ART,6,7 particularly that of tenofovir disoproxil fumarate, have been strongly associated with their development, but without conclusive evidence.10 Moreover, there is a correlation between the inflammatory status induced by HIV infection and bone quality measured by microindentation.11 Dolutegravir (DTG)/abacavir (ABC)/lamivudine (3TC) seems to have a cleaner profile with respect to bone density. Abacavir or lamivudine does not have the same impact on BMD as tenofovir disoproxil fumarate. However, there is little information regarding its association with all bone health components.12,13
Controversy surrounds the association made between bone impairment and an increased risk of fracture in an HIV-infected population.14 Information about fracture risk provided by BMD is not complete.8 Additional information about both bone microarchitecture as measured by trabecular bone score (TBS) and bone tissue quality as measured by microindentation may be useful in improving bone health diagnoses in ART-treated PLWHIV, beyond BMD alone. Based upon prior results in tenofovir disoproxil fumarate-treated patients,8 we assessed the hypothesis that patients treated with a DTG/ABC/3TC-based therapy will have improved bone tissue quality after initiation of treatment.
Patients and methods
Study participants
ART-naive PLWHIV above 18 years old about to initiate DTG/ABC/3TC were recruited from Hospital del Mar in Barcelona, Spain. Individuals who had been diagnosed with chronic hepatitis B or chronic hepatitis C, chronic kidney disease, chronic endocrine conditions, malabsorption syndrome, advanced liver disease, neoplasia, bone diseases or who had previously received treatments that could potentially affect the bone, such as systemic glucocorticoids or antiosteoporotic medications, were considered ineligible. This study was approved by the local Clinical Research Ethics Committee, and all participants gave written informed consent (2016/6793/I).
Study procedures
At baseline and after 48 weeks of open-label DTG/ABC/3TC (50 mg/600 mg/300 mg) treatment, participants underwent DXA of the hip and lumbar spine (Hologic QDR 4500 SR, Hologic, Inc., Bedford, MA, USA) for BMD assessment and OsteoProbe® for microindentation and bone tissue quality (Active Life Scientific Inc., Santa Barbara, CA, USA). The OsteoProbe procedure has been previously described.5,8 In brief, the testing takes place on the anterior face of the mid-tibia under local anaesthesia. A needle applied through the skin is pushed into the bone surface with a force of 30 N during less than 1 ms, creating an indentation, or microfracture, on the bone surface. The software registers the distance from the needle tip immediately before impact and immediately after, a distance called the total indentation. Repeated measurements in the same area are taken, and immediately afterwards five measurements are performed on a piece of polymethylmethacrylate (PMMA). The bone material strength index (BMSi) is calculated as 100 times the ratio of the mean total indentation in the PMMA and the tibia.
Bone health assessment
BMD (g/cm2) and T-score were taken from lumbar spine, femoral neck and hip. TBS was extracted from the lumbar spine DXA measurements using iNsight v2.1 (Med.Imaps, Merignac, France). TBS values were considered to be normal when above 1.35; partially degraded bone microarchitecture when between 1.20 and 1.35; and degraded microarchitecture when below 1.20. Bone tissue quality was quantified by the BMSi.5 A BMSi was considered excellent above 90; well, 80–90; admissible, 70–80; poor, 60–70; and very poor if below 60. To minimize interobserver variation, all measurements for this study were taken by two trained investigators (J.S.-F. and R.G.-F.).
Laboratory assays
Chemiluminescent immunoassays to determine several routine bone-specific laboratory values were performed between 8 and 10 am after a 10 h fast. Each immunoassay had an interassay coefficient of variation of 10%. We specifically measured levels of intact parathyroid hormone (Siemens); bone alkaline phosphatase (Roche Diagnostics); the amino propeptide of type I collagen (PINP) (Siemens); cross-linked collagen type I C-telopeptide (Siemens); serum 25-hydroxyvitamin D (Roche Diagnostics); high sensitivity C-reactive protein (hsCRP) (Immulite 2000, Siemens); calcium; phosphate (Roche Diagnostics); creatinine (Immulite 2000, Siemens); lactic acid dehydrogenase (LDH) (Roche Diagnostics); erythrocyte sedimentation rate (ESR) (Immulite 2000, Siemens); β-2 microglobulin (Immulite 2000, Siemens); and pro-coagulation parameters such as d-dimer [immunoturbidimetry (ACL TOP300)] and fibrinogen [Clauss method (ACL TOP300)].
Statistical analysis
Sample size was calculated according to previous publications.5,8,12 Accepting an alpha risk of 0.05 and a beta risk of 0.2 in a two-sided test, 14 participants were needed to recognize a difference greater than or equal to 5 BMSi units as statistically significant. The standard deviation was assumed to be 5. A drop-out rate of 10% was anticipated. An alternative sample size calculation was done taking into consideration changes in BMD. Taking into account previous publications8 and if we wanted to detect changes of a 5% (−0.050 g/cm2) decrease in the femoral neck BMD with the same risk assumption (alpha risk of 0.05 and a beta risk of 0.2 in a two-sided test), 13 subjects were necessary to recognize as statistically significant a difference greater than or equal to 0.05 g/cm2. The standard deviation was assumed to be 0.06. A drop-out rate of 10% was anticipated. We considered the more conservative approach.
Values are expressed as median values (IQR), and non-parametric tests were used, when deemed appropriate.
Multivariate linear regression models were fit to estimate the association between changes in bone health markers (BMD, TBS and BMSi), due to inflammatory and HIV markers, as well as that of bone turnover, adjusting for the following potential confounders: sex, age and BMI.
Results with P < 0.05 (two-tailed) were considered statistically significant. Analyses were performed using Stata/IC 14.2.
Results
Patient characteristics
Nineteen individuals were recruited. Three participants were later excluded as one had started glucocorticoids and the other two experienced a change in ART during the study.
The median age was 36 years (32–42) and 13 (81%) were male. All the patients completed the 48 week follow-up visit. Table 1 shows the baseline characteristics of the included participants.
Baseline characteristics of the study population
| Baseline value (N = 16) | |
|---|---|
| Age (years) | 36 (32–42) |
| Male, n (%) | 13 (81%) |
| BMI (kg/m2) | 24 (21–28) |
| Smoking, n (%) | 9 (56%) |
| Alcohol (>10 g/day), n (%) | 0 |
| Ex-IVDU, n (%) | 0 |
| Recreational drugs, n (%) | 3 (18%) |
| Previous fracture, n (%) | 0 |
| Family history of fracture, n (%) | 0 |
| Prevalent spine fractures, n (%) | 0 |
| eGFR <60 mL/min | 0 |
| eGFR (CKD-EPI) (mL/min) | 92 (79–97) |
| Years since HIV diagnosis | 0 (0–0) |
| Nadir CD4 cell count (cells/mm3) | 316 (193–776) |
| Current CD4 cell count (cells/mm3) | 453 (193–776) |
| Ever met AIDS criteria, n (%) | 2 (15%) |
Results are shown as median values (IQR), unless indicated otherwise.
At baseline, the median time since HIV diagnosis was less than 1 year, with a median nadir CD4 cell count of 316 cells/mm3 (27–627), a median current CD4 cell count of 453 cells/mm3 (193–776) and a median CD4/CD8 cell count ratio of 0.359 (0.112–0.695).
The initiation of ART elicited distinct effects regarding bone strength
The surrogate markers of bone strength (BMD, TBS and BMSi) behave differently after the initiation of ART (Table 2). From baseline to 48 weeks of treatment, we observed a significant decrease in spine BMD from a median of 1.013 g/cm2 (0.964–1.08) to 1.024 g/cm2 (0.951–1.065) (−2.25%, P = 0.007), as well as in femoral neck BMD from 0.835 g/cm2 (0.797–1.023) to 0.81 g/cm2 (0.778–1.006) (−4.1%, P = 0.03). Total hip BMD, however, remained unchanged [0.974 g/cm2 (0.937–1.173) versus 0.964 g/cm2 (0.943–1.17); +0.09%, P = 0.837].
BMD, markers of bone turnover, calcium metabolism, and inflammation and procoagulation
| Baseline | 48 weeks | Difference | P valuea | |
|---|---|---|---|---|
| BMD | ||||
| femoral neck BMD (g/cm2) | 0.835 (0.797–1.023) | 0.81 (0.778–1.006) | −0.025 | 0.031 |
| femoral neck T-score | 1 (0.725–1.275) | 0.9 (0.65–1.15) | −0.1 | 0.682 |
| lumbar spine BMD (g/cm2) | 1.013 (0.964–1.08) | 1.024 (0.951–1.065) | 0.011 | 0.009 |
| lumbar spine T-score | 0.7 (0.25–1.25) | 0.8 (0.45–1.4) | 0.1 | 0.072 |
| total hip BMD (g/cm2) | 0.974 (0.937–1.173) | 0.964 (0.943–1.17) | −0.01 | 0.924 |
| total hip T-score | 0.85 (0.6–0.975) | 0.8 (0.5–1) | −0.05 | 0.336 |
| TBS | 1.359 (1.334–1.371) | 1.321 (1.318–1.329) | −0.038 | 0.031 |
| BMSi | 84 (82.75–90) | 91.5 (87–94) | 7.5 | <0.001 |
| Bone turnover | ||||
| PINP (ng/mL) | 40.17 (22.5–46.91) | 50.1 (37.21–59.7) | 9.93 | 0.065 |
| bone alkaline phosphatase (μg/mL) | 9.42 (8.67–11.7) | 12 (10.05–13.3) | 2.58 | 0.213 |
| C-telopeptide (ng/mL) | 0.475 (0.293–0.628) | 0.422 (0.23–0.561) | −0.053 | 0.789 |
| Calcium metabolism | ||||
| parathyroid hormone (pg/mL) | 25.5 (21.25–39) | 41 (33.5–54.5) | 15.5 | 0.207 |
| 25-hydroxyvitamin D (ng/mL) | 19.5 (12.25–30.5) | 18.5 (15.25–19.75) | −1 | 0.135 |
| calcium (mg/dL) | 9.5 (9.1–9.55) | 9.67 (9.18–9.9) | 0.17 | 0.441 |
| phosphate (mg/dL) | 3.3 (3.1–3.35) | 3.3 (3–3.38) | 0 | 0.646 |
| Creatinine | 0.81 (0.71–1) | 0.99 (0.95–1.07) | 0.18 | 0.085 |
| Inflammation and coagulation | ||||
| hsCRP (mg/dL) | 0.34 (0.17–0.69) | 0.13 (0.05–0.29) | −0.21 | 0.157 |
| LDH (UI/L) | 347 (321–394) | 303 (263–356) | −44 | 0.003 |
| ESR (mm/h) | 30 (12–41) | 8 (4–14) | −22 | 0.02 |
| d-dimer (ng/mL) | 270 (190–665) | 230 (220–293) | −40 | 0.444 |
| fibrinogen (mg/dL) | 291 (240–379) | 319 (239–398) | 28 | 0.138 |
| β-2 microglobulin (mg/L) | 2.58 (2.16–2.96) | 1.82 (1.71–1.94) | −0.76 | 0.179 |
Results are shown as median values (IQR).
P values versus baseline. Significant values are indicated in bold.
Bone microarchitecture score at the spine, as measured by TBS, also significantly decreased from 1.359 (1.334–1.371) to 1.321 (1.318–1.329) (−2.5%, P = 0.03) from baseline to 48 weeks of treatment.
As measured by microindentation, percentage change of BMSi values of bone tissue quality at the 48 week marker of DTG/ABC/3TC-based therapy was significantly higher with respect to baseline [84 (82.75–90) versus 91.5 (87–94); +6.53%, P < 0.001]. This result was indicative of improved bone tissue quality after the initiation of treatment (Figure 1).
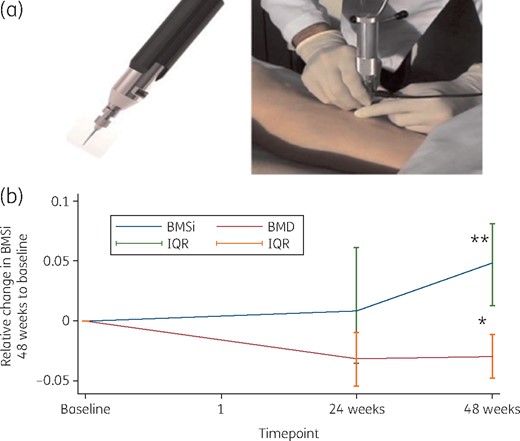
(a) Bone tissue quality assessed by microindentation. General view of the device (left) and the technique (right). (b) Graph showing the comparison between BMD and BMSi after starting DTG/3TC/ABC-based ART in HIV-infected ART-naive individuals Results are expressed as BMSi. Error bars represent the IQR. *P = 0.03; **P < 0.001. This figure appears in colour in the online version of JAC and in black and white in the print version of JAC.
Bone turnover markers
We did not detect significant changes in bone turnover markers. Only a trend in increasing formation marker PINP was identified (Table 2). On the other hand, we did detect a significant reduction in inflammation, being measured by an unspecific marker such as ESR of 30 mm/1st hour (12.44) to 8 mm/1st hour (4.14); −73% P = 0.02, but not by hsCRP [from 0.33 mg/dL (0.13–0.79) to 0.13 (0.05–0.29] mg/dL; −60% P = 0.158), or β-2 microglobulin [from 2.58 (2.16–2.96) to 1.82 (1.71–1.94) mg/L; −30% P = 0.179] (Table 2).
Predictors of change in bone health parameters
We further studied the factors that impacted on bone health among the participants after the initiation of ART. Traditional HIV-related factors were studied as predictors of relative change in bone tissue quality. We found no correlation between nadir CD4 cell count and changes in BMSi (Spearman’s rho = 0.219; P = 0.435), or with entry viral load (Spearman’s rho = −0.197; P = 0.464).
However, we did find a significant positive correlation between CD4/CD8 cell count ratio at baseline and changes in BMSi after 48 weeks of treatment (Spearman’s rho = 0.4974; P = 0.04).
No correlation between percentage change of BMSi and inflammatory status, as measured by ESR or CRP, was found (ESR: Spearman’s rho = −0.311; P = 0.388; CRP: Spearman’s rho = −0.407; P = 0.242). There was also no correlation between bone turnover markers at entry and percentage change in BMSi.
When studying the impact of the immune system balance at baseline on changes in BMD, no correlation was found with CD4/CD8 cell count ratio, nadir CD4 cell count, viral load or time since diagnosis. Moreover, no correlation with inflammatory status and changes in BMD at the spine or femur was observed.
Multivariable linear regression analysis
In a multivariate linear regression analysis, after adjusting for age and BMI, BMSi at baseline was associated with percentage change in BMSi at 48 weeks of ART (β coefficient −0.007; P = 0.01). No statistically significant influence of nadir CD4 cell count, baseline glomerular filtration rate (GFR) or baseline vitamin D levels was observed.
Complications
During this study, we did not encounter any complications related to the techniques used.
Discussion
We have reported a comprehensive assessment of different levels of bone health in treatment-naive HIV patients who started DTG/ABC/3TC-based ART. We found an increase of bone tissue quality after 48 weeks of treatment regardless of BMD.
The gold standard for assessing fracture risk has been BMD; however, other parameters also seem to accurately measure fracture propensity. We are now able to measure some of them.
Our data show how patients starting this regimen experienced a steady decrease of around 3% in BMD during the first year. This finding is similar to observations made in previous publications concerning abacavir/lamivudine-based ART15 and in contrast to the 5% decrease reported in tenofovir disoproxil fumarate-based ART.8 This decrease seems to continue in the long term according to McComsey et al.,15 who reported a 1.3% and 3.3% decrease in spine and hip BMD, respectively, after 96 weeks of abacavir/lamivudine-based therapy. Nonetheless, those receiving tenofovir disoproxil fumarate/emtricitabine treatment showed a decrease of 2.6% and 4.0%, respectively.15
There is growing evidence that the incidence of fracture among HIV-infected individuals is only partly correlated with reduced BMD. Other possibly important factors such as microarchitecture or bone tissue quality have additional relevance. PLWHIV experience a higher rate of osteoporosis-related fractures when compared with HIV-negative individuals.13,16 In a recent study, Barletta et al.17 showed a higher incidence of osteoporosis-related fractures in PLWHIV. Surprisingly though, in that same study, viral suppression and length of time on ART were associated with fracture risk reduction, including regimens containing tenofovir disoproxil fumarate. This finding underscores the importance of parameters separate from BMD to assess the risk of fracture.
Measuring other keystone elements of bone strength such as bone tissue quality also provides additional information and may more accurately assess bone health status. Interestingly, we found that the initiation of abacavir/lamivudine-based therapy was associated with a significant improvement in bone tissue quality of 6%. This increase is quantitatively similar to what we have seen in tenofovir disoproxil fumarate-treated individuals.8 In both cases, the increase observed is independent of BMD or other parameters. Microindentation is a sensitive tool for detecting bone changes18 and propensity to fracture not attributable to loss of BMD.19 Taking that all into account, we believe that our results suggest that changes induced by HIV are ultimately responsible for a large portion of fracture risk, and that starting ART and controlling the infection may at least partially restore the damage caused by the virus. Consequently, the appearance of a fracture will depend not solely on the treatment selected but also on other factors more closely related to HIV infection. In a previous study we found an association between HIV and the Wnt/β-catenin pathway as one of the potential players in bone strength. The action of ART on the effect of HIV in this (and other) pathways could be one of the potential explanations of the bone quality improvement.11
The balance of the immune system as measured by the CD4/CD8 cell count ratio impacts the recovery of bone quality after starting ART. Such a correlation showed that those patients with a better balanced immune system before the start of treatment experienced improved bone quality recovery with ART. These findings go hand in hand with other previous publications, in which a persistently low CD4/CD8 cell count ratio during otherwise effective ART was associated with increased innate and adaptive immune activation, an immunosenescent phenotype and higher risk of morbidity and mortality.20 Bone is an organ directly affected by systemic inflammation; changes in the immune compartment will impact its health. Inflammation as a consequence of HIV persistence has been associated with BMD through the RANK pathway.11
ART, particularly tenofovir disoproxil fumarate, has been reported to impact BMD and increase bone fractures. ART is more likely to be beneficial than deleterious for bone. The most generally accepted regimen as an option to avoid bone toxicity was abacavir/lamivudine-based treatment. In a randomized simplification trial21 comparing abacavir/lamivudine versus tenofovir disoproxil fumarate/emtricitabine, it was reported that those patients receiving the latter had greater bone loss compared with those receiving the former. Previous studies associated increased bone turnover and bone loss with initiation of ART; however, it is unclear whether the change in BMD was a result of specific drugs, immune reconstitution or suppression of HIV replication. In fact, with DTG/ABC/3TC therapy, a significant decrease of BMD after ART in two different sites was observed, with no significant changes in bone turnover markers.
Our study has some limitations that must be considered. One such limitation is that it is a single-centre study with a very limited sample size. Microindentation is a relatively new technique, but the longitudinal design of the study and the fact that the technique is performed by the same investigators helps to minimize potential inexperience with the technique. In this study, we have not included an active comparator, so it is difficult to distinguish the effects of the drug itself and the effects of the ART initiation and the immune reconstitution.
Since the sample size was calculated to find differences in BMSi but not in other parameters, it is clearly insufficient to find differences in other markers such as those of bone turnover or inflammation.
In conclusion, we report a longitudinal study in which ART-naive HIV patients are assessed prospectively, and bone tissue quality is assessed directly. We find that even while BMD and TBS decrease after 48 weeks of DTG/ABC/3TC treatment, bone tissue quality did improve in most patients. Since the different components of bone strength behave differently, an overarching approach to assess bone toxicity in ART-treated patients is needed.
Funding
This work was supported by the Centro de Investigación Biomédica en Red de Fragilidad y Envejecimiento Saludable (CIBERFES) (grant number CB16/10/00245), the FIS Project from Instituto de Salud Carlos III, Ministerio de Ciencia e Innovación (grant numbers PI13/00589 and PI16/01860) and FEDER funds. T.T.B. is supported in part by K24 AI120834.
Transparency declarations
None to declare.
