


Abstract
Patients with primary HIV-1 infection (PHI) are a particular population, giving important insight about ongoing evolution of transmitted drug resistance-associated mutation (TDRAM) prevalence, HIV diversity and clustering patterns. We describe these evolutions of PHI patients diagnosed in France from 2014 to 2016.
A total of 1121 PHI patients were included. TDRAMs were characterized using the 2009 Stanford list and the French ANRS algorithm. Viral subtypes and recent transmission clusters (RTCs) were also determined.
Patients were mainly MSM (70%) living in the Paris area (42%). TDRAMs were identified among 10.8% of patients and rose to 18.6% when including etravirine and rilpivirine TDRAMs. Prevalences of PI-, NRTI-, first-generation NNRTI-, second-generation NNRTI- and integrase inhibitor-associated TDRAMs were 2.9%, 5.0%, 4.0%, 9.4% and 5.4%, respectively. In a multivariable analysis, age >40 years and non-R5 tropic viruses were associated with a >2-fold increased risk of TDRAMs. Regarding HIV diversity, subtype B and CRF02_AG (where CRF stands for circulating recombinant form) were the two main lineages (56% and 20%, respectively). CRF02_AG was associated with higher viral load than subtype B (5.83 versus 5.40 log10 copies/mL, P=0.004). We identified 138 RTCs ranging from 2 to 14 patients and including overall 41% from the global population. Patients in RTCs were younger, more frequently born in France and more frequently MSM.
Since 2007, the proportion of TDRAMs has been stable among French PHI patients. Non-B lineages are increasing and may be associated with more virulent CRF02_AG strains. The presence of large RTCs highlights the need for real-time cluster identification to trigger specific prevention action to achieve better control of the epidemic.
Introduction
HIV epidemiology is constantly evolving worldwide, and regular surveillance studies allow monitoring of several important aspects of the epidemic: emergence of transmitted drug resistance-associated mutations (TDRAMs), HIV genetic diversity shifts and global transmission patterns. Thus, the widespread use of combination ART has resulted in a substantial reduction of HIV-related morbidity and mortality. Despite major progress in HIV treatment, the emergence of TDRAMs has remained stable, between 10% and 12% of new infections, since 1999 in France.1–4 In Europe, TDRAM prevalence was 8.3% between 2008 and 2010, with a majority of NRTI mutations and a larger baseline impact on NNRTI-based regimens.5 Thus, TDRAMs are a major component of sentinel national surveillance networks worldwide as their evolution may lead to virological failures.
The HIV-1 subtype B lineage accounts for about 12% of all HIV infections worldwide and is predominant in most Northern countries.6 Over the last 15 years, the epidemiology of HIV-1 in Europe is increasingly heterogeneous with a decreasing subtype B proportion, still representing about two-thirds of the treatment-naive population in France and Europe in the early 2000s,7–9 raising questions about potential issues in diagnosis, clinical management or pathogenesis. In France, recent data showed the spread of non-B subtypes in individuals of French origin, with a particular involvement of MSM groups in this dynamic.10,11
Moreover, HIV-1 pol sequences widely generated for routine genotypic resistance testing allow characterization of clustering patterns12–14 and can help to implement and evaluate prevention interventions.15 Recently, Ladner et al.16 outlined that advances in the speed and granularity of pathogen genome generation have improved the capability to track HIV transmission with potential improvements in the design and implementation of public health interventions. The population of patients diagnosed at the stage of primary HIV-1 infection (PHI) appears of particular interest for such studies as 13%–29% of them belong to recent transmission clusters (RTCs) between 1999 and 2014 in France14,17,18 or 34% in the UK between 1999 and 2003.19
Our objective was to monitor the frequency of TDRAMs, HIV molecular diversity and clustering patterns in the particular population of PHI patients diagnosed in France between 2014 and 2016.
Patients and methods
Study population
Between 2014 and 2016, patients diagnosed at the time of PHI through the French network of virology laboratories (n=46) were included in the study. All patients were included at the time of PHI and were naive of ART. Enrolment criteria were: (i) a negative or indeterminate HIV ELISA associated with a positive p24 antigenaemia or detectable plasma HIV RNA; (ii) a positive HIV ELISA with a western blot or immunoblot profile compatible with ongoing seroconversion (incomplete profile with absence of antibodies to Pol proteins); or (iii) a negative test for HIV antibodies within 6 months before the positive HIV serology. The study was approved by the required ethics committee (Comite Consultatif de Traitement de l'Information dans la Recherche Scientifique et Medicale) and by the national data confidentiality watchdog organization (Commission Nationale Informatique et Libertes), in keeping with French law. Patients received full information on their participation in the study and did not oppose the use of their data.
Genotypic resistance analysis
Genotypic resistance tests were performed onsite, on plasma samples collected before initiation of ART using either commercial assays (ViroSeq HIV-1 genotyping system, Abbott, Rungis, France) or the consensus technique of the ANRS Resistance Study Group (www.hivfrenchresistance.org). All laboratories participate in the annual ANRS quality assurance programme.20 HIV-1 TDRAMs were defined using the 2009 Stanford TDRAMs list21 for NRTIs, first-generation NNRTIs and PIs. TDRAMs for etravirine, rilpivirine and integrase inhibitors were defined using the 2017 French ANRS algorithm v27 (www.hivfrenchresistance.org) and the 2017 IAS-USA list of resistance mutations.22 For doravirine, the following resistance mutations were retained: V106A, V106M, V108I, H221Y, F227L, F227C, F227V, M230I, L234I and P236L.23 The HIV env gene was sequenced and HIV genotropism was determined using the Geno2Pheno algorithm [false-positive rate (FPR) 10% for all viral subtypes].
Genotypic susceptibility scores (GSSs) were estimated using the ANRS algorithm v27. Each drug was scored as susceptible (score of 1) or intermediate/resistant (score of 0). For each recommended first-line ART combination in France, i.e. tenofovir disoproxil fumarate or tenofovir alafenamide and emtricitabine in association with rilpivirine, darunavir/ritonavir, raltegravir, elvitegravir/cobicstat or dolutegravir, and abacavir/lamivudine in association with dolutegravir,24 the arithmetic sum of the individual score for the specific drugs provided the total treatment-related GSS. We also estimated resistance to drugs used in pre-exposure prophylaxis (PrEP) (tenofovir disoproxil fumarate/emtricitabine or tenofovir disoproxil fumarate/lamivudine).
Phylogenetic analysis
All protease, reverse transcriptase and integrase sequences were subtyped using Comet25 and HIV Blast (https://www.hiv.lanl.gov/content/index). Discordant results were confirmed by phylogenetic reconstruction using approximate maximum likelihood with FastTree 2.126 under the GTR-G nucleotide substitution model and reference sequences available in the HIV database (https://www.hiv.lanl.gov/content/index).
Phylogenetic relationships and clustering patterns were also determined on the protease+reverse transcriptase fragment of the pol gene. All sequences underwent phylogenetic reconstruction using the same process. RTCs were retrieved using ClusterPicker 1.2.3 with a maximum pairwise genetic distance at 4.5% and a minimum branch support at 95%. As ClusterPicker uses a p-distance and not genetic distances obtained with the GTR-G nucleotide substitution model, clusters were also manually checked and retrieved using FigTree 1.4.3.
Statistical methods
Variables were summarized as number and proportion for categorical variables, and median and IQR for continuous variables. The 95% CI of the proportions of participants with at least one TDRAM were calculated (overall, NRTIs, NNRTIs, PIs and integrase inhibitors). Univariable and multivariable logistic regression analyses were used to identify epidemiological variables associated with TDRAMs: age, gender, transmission route, CD4 cell count, viral load, subtype, tropism, cluster size, CDC stage, country of birth, region of diagnosis and year of inclusion. Univariable analyses were used to determine whether age, CD4 cell count and plasma HIV RNA viral load were better modelled as continuous variables or categorical variables (tertiles), based on Akaike’s information criterion (AIC).
A non-parametric Kruskal–Wallis test and Fisher’s exact test were used to compare distributions of continuous and categorical variables, respectively, of patient characteristics according to viral subtype [B, CRF02 (where CRF stands for circulating recombinant form), unique recombinant forms (URFs) and other non-B] and cluster size (not included in a cluster, included in a cluster of size ≤3 clusters and included in a cluster of size >3 clusters). All P values were two-sided with a significance level of 0.05. For P values below 0.05, the groups were compared two by two with a significance level of 0.01 to account for the multiplicity of tests. Analyses were performed with IBM SPSS Statistics version 24 and Stata SE version 13 software for Windows.
Data availability
Data are only available upon request, in accordance with French ethical laws, as they contain potentially identifiable information on persons living with HIV included in the study. Anyone requesting access to the cohort data would be required to submit a concept sheet for review and approval by the ANRS AC43 and requested ethics committee. Interested parties can contact the study principal investigator (Dr Marie-Laure Chaix; [email protected]).
Results
Study population
Overall, 1121 patients were included in our study: 355 patients in 2014, 381 in 2015 and 385 in 2016. General characteristics of the study subjects are shown in Table 1. Patients were mainly men (90%) and 70% were MSM. Most patients (70%) were from France and 7% were from sub-Saharan Africa. A total of 42% of all French PHI patients were observed in the Paris area (Ile-de-France region), which contains 18% of the global French population (https://www.insee.fr/fr/statistiques/3627376). Median CD4 cell count and plasma HIV-1 viral load measured at the time of PHI were 478 cells/mm3 (IQR=329–636) and 5.51 log10 copies/mL (IQR=4.71–6.46), respectively.
Demographic and clinical patient characteristics according to viral subtypes, 2014–16 (n=1121)
| Total | B | CRF02_AG | URFs | Other | Pa | |
|---|---|---|---|---|---|---|
| n (%) | 1121 (100) | 628 (56) | 222 (20) | 64 (6) | 207 (18) | |
| Age (years), median (IQR) | 36 (28–45) | 36 (28–44) | 37 (30–48) | 35 (28–44) | 36 (28–47) | 0.105 |
| Men, n (%) | 1009 (90) | 604 (96) | 182 (82) | 54 (84) | 169 (82) | <0.001 |
| Country of birth, n (%) | <0.001 | |||||
| France | 790 (70) | 472 (75) | 148 (67) | 46 (72) | 124 (60) | |
| other European countries | 37 (3) | 21 (3) | 5 (23) | 4 (6) | 7 (3) | |
| sub-Saharan Africa | 74 (7) | 8 (1) | 32 (14) | 3 (5) | 31 (15) | |
| other/unknown | 220 (20) | 127 (20) | 37 (17) | 11 (17) | 45 (22) | |
| Route of transmission, n (%) | <0.001 | |||||
| MSM | 788 (70) | 492 (78) | 130 (59) | 46 (72) | 120 (58) | |
| heterosexual | 199 (18) | 55 (9) | 65 (29) | 12 (19) | 67 (32) | |
| IVDU | 5 (0) | 3 (0) | 1 (0) | 1 (2) | 0 (0) | |
| other/unknown | 129 (12) | 78 (12) | 26 (12) | 5 (8) | 20 (10) | |
| Region of diagnosis, n (%) | <0.001 | |||||
| Paris area | 476 (42) | 242 (39) | 105 (47) | 41 (64) | 88 (43) | |
| other region | 645 (58) | 386 (61) | 117 (53) | 23 (36) | 119 (57) | |
| Year of diagnosis, n (%) | 0.164 | |||||
| 2014 | 355 (32) | 221 (35) | 62 (28) | 18 (28) | 54 (26) | |
| 2015 | 381 (34) | 204 (32) | 75 (34) | 24 (38) | 78 (38) | |
| 2016 | 385 (34) | 203 (32) | 85 (38) | 22 (34) | 75 (36) | |
| CDC stage, n (%) | 0.931 | |||||
| A | 827 (96) | 461 (96) | 169 (96) | 45 (94) | 152 (97) | |
| B | 20 (2) | 11 (2) | 4 (2) | 2 (4) | 3 (2) | |
| C | 13 (2) | 8 (2) | 3 (2) | 1 (2) | 1 (1) | |
| Viral load (log10 copies/mL), median (IQR) | 5.51 (4.71–6.46) | 5.40 (4.66–6.26) | 5.83 (4.96–6.60) | 5.45 (4.68–6.73) | 5.65 (4.76–6.56) | 0.004 |
| CD4 cell count (cells/mm3), median (IQR) | 478 (329–636) | 495 (340–650) | 437 (294–591) | 491 (307–590) | 459 (334–650) | 0.040 |
| Included in a cluster, n (%) | <0.001 | |||||
| no | 664 (59) | 365 (58) | 122 (55) | 29 (45) | 148 (71) | |
| yes | 457 (41) | 263 (42) | 100 (45) | 35 (55) | 59 (29) | |
| Cluster size, n (%) | <0.001 | |||||
| not included in a cluster | 664 (59) | 365 (58) | 122 (55) | 29 (45) | 148 (71) | |
| included in a small cluster (≤3) | 214 (19) | 154 (25) | 30 (14) | 11 (17) | 19 (9) | |
| included in a large cluster (>3) | 243 (22) | 109 (17) | 70 (32) | 24 (38) | 40 (19) |
aStatistically significant P values (<0.05) are indicated in bold.
TDRAMs
Viruses from 121 patients (10.8%, 95% CI=9.0–12.8) had ≥1 TDRAM according to the Stanford 2009 list, representing 41/355 (11.5%) individuals infected in 2014, 44/381 (11.5%) in 2015 and 36/385 (9.4%) in 2016 (P=0.53) (Figure 1). Considering the Stanford 2009 list, the French ANRS 2017 algorithm and the 2017 IAS-USA list, the prevalence of TDRAMs rose to 18.6% (95% CI=16.4–21.0). The prevalence of PI-, NRTI- and first-generation NNRTI-associated TDRAMs was 2.9% (95% CI=2.0–4.1), 5.0% (95% CI=3.8–6.4) and 4.0% (95% CI=2.9–5.3), respectively. TDRAMs to second-generation NNRTIs (rilpivirine and etravirine) not included in the Stanford 2009 list were observed in 9.4% of viruses. The most prevalent TDRAMs were E138A/R/K, V106I and V90I. Overall, resistance to at least one NNRTI was 12.7% (95% CI=10.8–14.8). Prevalence of sequences with ≥1 doravirine TDRAMs was 1.0% (95% CI=0.5–1.7). According to the Stanford 2009 list, viruses from 109 patients (9.7%) had single-class resistance, 11 (1.0%) had dual-class resistance (NRTI+NNRTI in 8 cases, NRTI+PI in 2 cases and NNRTI+PI in 1 case) and 1 (0.09%) had triple-class resistance. Integrase inhibitor-related TDRAMs, analysed in 855 strains with integrase sequences available up to amino acid 230 or more, were observed in 46/855 (5.4%, 95% CI=4.0–7.1): L74M n=8, E92Q/G n=1, T97A n=12, E138K n=3, E157Q n=17, S230R n=2 and R263K n=1. Double mutants E92Q+T97A and L74M+T97A were each observed in one patient. Only 1 R263K (0.2%) was detected among the 414 available sequences up to amino acid 263. In 37 cases, integrase inhibitor mutations were identified without any other mutation in reverse transcriptase or protease genes. In nine cases, integrase inhibitor mutations were associated with NRTI and/or NNRTI mutations with the following patterns: D67N+K219Q+G190A+E157Q, M41L+T215E+E157Q, K65R+M184V+E92Q+T97A, T215I+T97A, K103N+E138G+T97A, E138A+L74M, V179I+E157Q, V90I+E157Q and V90I+L74M. Detailed prevalence for each mutation is given in Tables S1 to S4 (available as Supplementary data at JAC Online). Genotropism had been tested for 523 patients, with 80 (15.3%) harbouring X4/DM-tropic viruses.
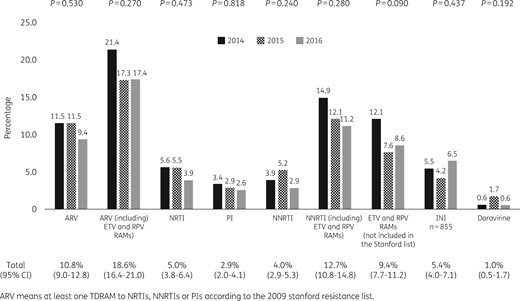
Frequency of TDRAMs to NRTIs, NNRTIs, PIs and integrase inhibitors according to the year of inclusion. ETV, etravirine; RPV, rilpivirine; INI, integrase inhibitor.
In multivariable analysis, age >40 years old [OR=2.3 (95% CI=1.2–4.5) for 40–50 years old and OR=2.9 (95% CI=1.4–6.2) for >50 years old] and a non-R5 tropic virus [OR=2.7 (95% CI=1.2–6.1)] were the only factors significantly associated with TDRAMs, while baseline characteristics such as gender, transmission route, CD4 cell count, viral load, CDC stage, country of birth, region of diagnosis, viral subtype, cluster size and year of inclusion were not (Figure 2).
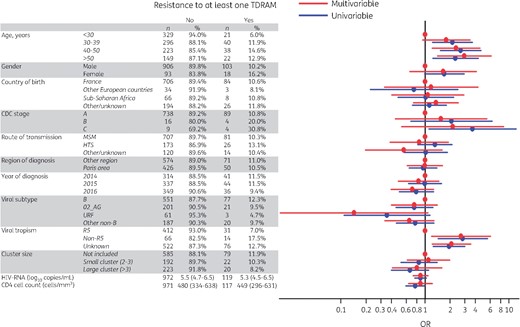
Univariable and multivariable analysis of risk factors for TDRAMs according to the Stanford list. HTS, heterosexual. This figure appears in colour in the online version of JAC and in black and white in the print version of JAC.
Pattern of TDRAMs according to antiretroviral classes and impact on first-line strategies and PrEP
The pattern of TDRAMs is described in Figure 3. Overall, prevalence of resistance to the most commonly prescribed drugs was: 16.3% and 0.2% to atazanavir/ritonavir and darunavir/ritonavir, respectively; 2.0%, 0.5% and 0.4% to abacavir, lamivudine/emtricitabine and tenofovir disoproxil fumarate/tenofovir alafenamide, respectively; 5.3%, 4.9%, 4.2% and 3.9% to etravirine, rilpivirine, nevirapine and efavirenz, respectively; and 4.1%, 2.7% and 2.1% to elvitegravir/cobicstat, dolutegravir and raltegravir, respectively.
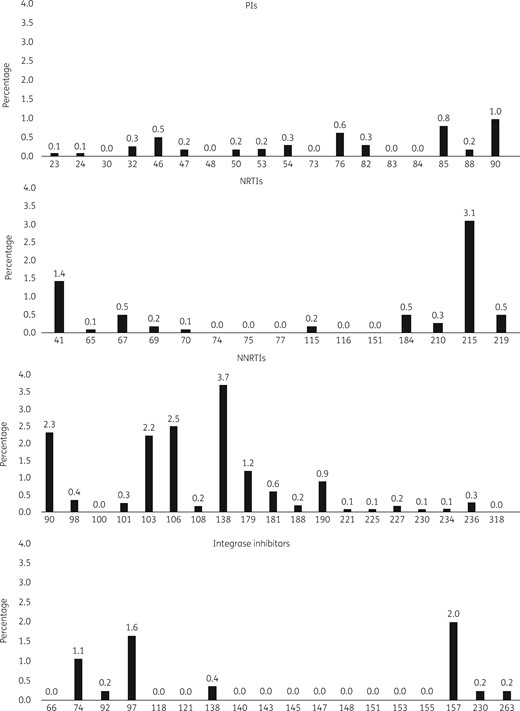
Frequency of TDRAMs according to gene position.
The analysis of the GSS for each of the first-line recommended ART combinations showed class-related disparities. The proportion of fully active (GSS=3) tenofovir disoproxil fumarate/emtricitabine/darunavir-based regimens was 99.0%. This rate decreased to 94.6% for rilpivirine-based combinations, mostly explained by the polymorphic E138A/K substitution (3.3% of patients). Considering integrase inhibitor-based strategies, the proportion of fully active combinations was 97.4% for tenofovir disoproxil fumarate or tenofovir alafenamide/emtricitabine/raltegravir, 95.4% for elvitegravir/cobicstat-containing regimens and 95.7% for the abacavir/lamivudine/dolutegravir regimen. Considering drugs used in PrEP, 99.2% of viruses were fully susceptible to tenofovir/emtricitabine or lamivudine, 0.7% were resistant to emtricitabine/lamivudine or tenofovir disoproxil fumarate, and only one virus (0.09%) was resistant to tenofovir disoproxil fumarate/emtricitabine or lamivudine with an association of K65R and M184V mutations.
HIV-1 diversity
Among all included patients 56%, 20% and 24% were infected with subtype B, CRF02_AG or other HIV-1 group M lineages, respectively (Table 2). CRF02_AG tended to be increasingly represented across years. Subtype B included more male patients (96%) than the three other lineage categories (82%, 84% and 82% for CRF02_AG, URFs and the group of other lineages, respectively, P<0.001 for all comparisons). Subtype B presented more MSM (78%) than CRF02_AG (59%, P<0.001) and the group of other lineages (58%, P<0.001), but not the URF group. Subtype B also presented a higher proportion of patients of French origin (75%) than CRF02_AG (67%, P=0.02) and the group of other lineages (60%, P<0.001), but not the URF group. Compared with subtype B, CRF02_AG and URFs were most represented in the Paris area [47% versus 39% (P=0.03) and 64% versus 39% (P<0.0001), respectively]. CRF02_AG also presented higher viral loads [median of 5.83 log10 copies/mL (IQR=4.96–6.60) versus 5.40 log10 copies/mL (IQR=4.66–6.26), P=0.004] and lower CD4 cell counts [median of 437 cells/mm3 (IQR=294–591) versus 495 cells/mm3 (IQR=340–650), P=0.004] compared with subtype B. No difference was observed for these parameters between subtype B, URFs or the group of other lineages.
Frequency of different HIV-1 subtypes and CRFs among the 1121 patients
| Subtype | n | Percentage |
|---|---|---|
| B | 628 | 56.0 |
| CRF02_AG | 222 | 19.8 |
| URF | 64 | 5.7 |
| F | 40 | 3.6 |
| A | 34 | 3.0 |
| C | 29 | 2.6 |
| CRF01_AE | 26 | 2.3 |
| CRF06_cpx | 15 | 1.3 |
| D | 9 | 0.8 |
| CRF60_BC | 8 | 0.7 |
| G | 7 | 0.6 |
| CRF22_01A1 | 5 | 0.4 |
| CRF25_cpx | 4 | 0.4 |
| CRF37_cpx | 4 | 0.4 |
| CRF12_BF | 3 | 0.3 |
| CRF42_BF | 3 | 0.3 |
| CRF11_cpx | 3 | 0.3 |
| CRF07_BC | 3 | 0.3 |
| H | 3 | 0.3 |
| CRF45_cpx | 2 | 0.2 |
| CRF28_BF | 2 | 0.2 |
| CRF18_cpx | 2 | 0.2 |
| CRF56_cpx | 2 | 0.2 |
| CRF33_01B | 1 | 0.1 |
| CRF24_BG | 1 | 0.1 |
| CRF20_BG | 1 | 0.1 |
RTCs
The phylogenetic tree is depicted in Figure S1. Among the global sequence data set, 457 (41%) patients were infected with strains included in RTCs. Among those, 214 (47%) were included in 77 and 20 small RTCs of two and three sequences, respectively. The remaining 243 (53%) sequences were included in large RTCs including from 4 to 12 sequences. Sampling dates of viral strains included in each large RTC are depicted in Figure 4.
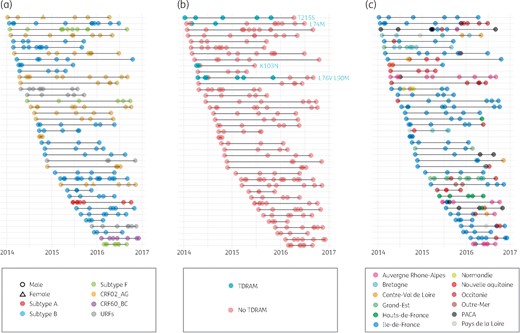
Time distribution of large RTCs (>3 sequences included). Each line represents a distinct large cluster of transmission, while each dot depicts the inclusion date of each corresponding patient. (a) Colours and shapes represent viral lineage and patient’s sex. (b) Colours represent the presence or absence of TDRAMs. (c) Colours represent the region of diagnosis. PACA, Provence-Alpes-Côte d'Azure. This figure appears in colour in the online version of JAC and in black and white in the print version of JAC.
Clinical and demographic analyses of patients corresponding to viral strains not included in an RTC, included in a small RTC (≤3) or included in a large RTC (>3) are depicted in Table 3. Patients born in France and MSM were more represented among the clustering groups than in the non-clustering group [74% versus 67% (P=0.009) and 81% versus 63% (P<0.001)]. Regarding viral lineages, subtype B was more represented among small RTCs than in other groups (72% versus 52%, P<0.001) and CRF02_AG was more represented among large RTCs than in other groups (29% versus 17%, P<0.001). Patients included in large RTCs were younger than those in small RTCs (median of 31 versus 34 years old, P=0.01). The latter patients were also younger than non-clustering patients (median of 34 versus 38 years old, P<0.001). Regarding large RTC geographical dispersion, the Paris area encompassed 48% of all patients from large RTCs, with 31 out of the 39 large RTCs including at least one patient from this region. The proportion of patients included from Auvergne Rhone-Alpes and Occitanie appeared to be slightly increased (Table S5). However, these latter observations need to be treated with caution and confirmed in the future as such variations are mostly led by the sudden expansion of a few large RTCs.
Demographic and clinical patient characteristics according to non-inclusion/inclusion in a recent transmission cluster, 2014–16 (n=1121)
| Total | Not included in a cluster | Included in a small cluster (≤3) | Included in a large cluster (>3) | Pa | |
|---|---|---|---|---|---|
| n (%) | 1121 (100) | 664 (59) | 214 (19) | 243 (22) | |
| Age (years), median (IQR) | 36 (28–45) | 38 (30–47) | 34 (26–45) | 31 (26–39) | <0.001 |
| Male, n (%) | 1009 (90) | 568 (86) | 200 (93) | 241 (99) | <0.001 |
| Country of birth, n (%) | <0.001 | ||||
| France | 790 (70) | 448 (67) | 158 (74) | 184 (76) | |
| other European countries | 37 (3) | 23 (3) | 5 (2) | 9 (4) | |
| sub-Saharan Africa | 74 (7) | 66 (10) | 4 (2) | 4 (2) | |
| other/unknown | 220 (20) | 127 (19) | 47 (22) | 46 (19) | |
| CDC stage, n (%) | 0.199 | ||||
| A | 827 (96) | 495 (96) | 153 (94) | 179 (98) | |
| B | 20 (2) | 11 (2) | 5 (3) | 4 (2) | |
| C | 13 (1) | 8 (2) | 5 (3) | 0 (0) | |
| Route of transmission, n (%) | <0.001 | ||||
| MSM | 788 (70) | 421 (63) | 170 (82) | 197 (81) | |
| heterosexual | 199 (18) | 168 (25) | 19 (9) | 12 (5) | |
| IVDU | 5 (0) | 4 (1) | 1 (0) | 0 (0) | |
| other/unknown | 129 (12) | 77 (11) | 18 (9) | 31 (14) | |
| Region of diagnosis | 0.125 | ||||
| Paris area | 476 (42) | 273 (41) | 86 (40) | 117 (48) | |
| other region | 645 (58) | 391 (59) | 128 (60) | 126 (52) | |
| Year of diagnosis, n (%) | <0.001 | ||||
| 2014 | 355 (32) | 196 (30) | 93 (43) | 66 (27) | |
| 2015 | 381 (34) | 229 (34) | 60 (28) | 92 (38) | |
| 2016 | 385 (34) | 239 (36) | 61 (29) | 86 (35) | |
| Subtype | <0.001 | ||||
| B | 628 (56) | 365 (55) | 154 (72) | 109 (45) | |
| CRF02_AG | 222 (20) | 122 (18) | 30 (14) | 70 (29) | |
| URF | 64 (6) | 29 (4) | 11 (5) | 24 (10) | |
| other | 207 (18) | 148 (22) | 19 (9) | 40 (16) | |
| Viral load (log10 copies/mL), median (IQR) | 5.51 (4.71–6.46) | 5.49 (4.72–6.36) | 5.72 (4.86–6.60) | 5.51 (4.62–6.56) | 0.322 |
| CD4 cell count (cells/mm3), median (IQR) | 478 (329–636) | 460 (319–631) | 476 (329–643) | 498 (379–640) | 0.120 |
aStatistically significant P values (<0.05) are indicated in bold.
Only four large RTCs included sequences identified with TDRAMs: one with T215S; one with L74M; one with K103N; and one with an association of L76V and L90M (Figure 3). In these four clusters, TDRAMs achieved transmission into several successive patients, but did not achieve sustainable transmissions as they were not retrieved among the last included patients of their corresponding clusters. Of note, the mutation that lasted longest was T215S, known for its lower fitness cost.27
Discussion
Among PHI patients diagnosed in France from 2014 to 2016, overall TDRAM prevalence was 10.8% according to the Stanford list and 18.6% including etravirine and rilpivirine TDRAMs. These prevalences are stable compared with a previous survey in France4 and in line with recent epidemiological European studies in PHI or naive patients that reported TDRAM prevalence of around 10%.5,11,28–30
Overall, and as stated in other European studies, T215 revertants and K103N substitution were the most prevalent TDRAMs. The NNRTI class, including etravirine and rilpivirine TDRAMs, presented the highest resistance level, followed by NRTI and PI resistance. Rilpivirine and etravirine mutations were not associated with viral subtypes and, thus, their variations are not explained by modification of subtype distribution. As previously described, the frequency of doravirine resistance-associated mutations was very low (1.0%),23 but the prevalence of the E138A/K substitution that decreases susceptibility to rilpivirine was higher at 3.3%. This might affect virological responses to first-line rilpivirine-based regimens without pre-therapeutic resistance testing. Regarding integrase inhibitor resistance, except for one R263K, only polymorphic resistance mutations were observed, mostly E157Q (1.5%) and T97A (1.2%). Keeping these reassuring results in mind, but also the non-negligible proportion of integrase inhibitor-based initial regimens showing at least one TDRAM to the other included drugs associated with a potential risk of virological failure for integrase inhibitors with non-fully active backbones,31 the choice of a PI-based (particularly darunavir-based) and/or an integrase inhibitor-based (particularly dolutegravir-based) combination over NNRTI-based regimens should be implemented to reduce the risk of early failure and possible forward transmission of TDRAMs. This is in line with the SPREAD study showing the greatest impact of TDRAMs on NNRTIs5 and as stated by European guidelines for the management of PHI.32 Concerning the use of PrEP, only 0.09% of patients were resistant to tenofovir disoproxil fumarate/emtricitabine and tenofovir disoproxil fumarate/lamivudine combinations.
The higher prevalence of TDRAMs observed with non-R5 tropism virus can be explained by a probable higher duration of treatment among patients presenting TDRAMs and virological failure allowing transmission, thus presenting more frequently a non-R5 tropism virus. Fortunately, TDRAMs did not seem able to sustain their transmissions across large RTCs as none of the four large RTCs identified with TDRAMs presented transmission of the mutations during the whole study period.
Regarding HIV molecular epidemiology, subtype B decreased among French PHI patients from 75% during the 1999–2010 period3 to 62% and 53% in 2014 and 2016, respectively. Conversely, CRF02_AG increased from 14% during 1999–20103 to 17% and 22% in 2014 and 2016, respectively. Other non-B non-CRF02_AG lineage also increased from 11% during 1999–2010 to 20% and 25% in 2014 and 2016, respectively.3 Interestingly, 24% of these other lineages in our study are URFs, underlining the increasing complexity of HIV epidemiology. CRF02_AG was more represented among large RTCs than among other populations (29% versus 17%) and presented higher viral load and lower CD4 cell counts. When analysing those differences among the population of French origin, the difference in CD4 cell counts was not maintained, which can be explained by lower CD4 cell counts observed in the population from sub-Saharan Africa.33 However, the viral load difference between subtype B and CRF02_AG remained statistically significant among patients born in France (5.79 versus 5.42 log10 copies/mL, P=0.012), underlying a potential higher virulence of CRF02_AG. To the best of our knowledge, this is the first report of higher viral loads associated with CRF02_AG and needs to be confirmed by further study and in non-PHI populations. Thus, because of such possible virulence variations and different susceptibility or resistance patterns to antiviral therapy,34–36 the spread of non-B sequences needs to be monitored and considered in upcoming studies.
RTCs included 41% of all PHI patients. This rate is higher than previously described among French PHI patients, from 12.7% to 29% between 1999 and 2014.14,17,18 However, this difference can also be explained by various cluster definitions used in those studies. Our rate is also close to those observed in the IPERGAY cohort, including patients using PrEP, or in the Montreal PHI cohort at 45% and 49%, respectively.37,38 Regarding the RTC geographical dispersion, the Paris area encompassed 48% of all patients from large RTCs, with 31 out of the 39 large RTCs including at least one patient from this region. The proportion of patients included from Auvergne Rhone-Alpes and Occitanie appeared to be slightly increasing (Table S5). However, these latter observations need to be treated with caution and confirmed by future studies as these variations were mostly led by the expansion of a few large RTCs. Patients included in RTCs showed the same particular characteristics previously described worldwide, with higher prevalence of: (i) male gender, as shown in a previous French study and in a Swiss cohort;14,39 (ii) MSM route of transmission;14,19 and (iii) younger ages, as reported in France14 and in the UK,19 but not in Canadian or Swiss data.39,40
A classic limitation of our work, as for all similar studies, is the coverage of the targeted population. Indeed, only patients consulting at the time of PHI can be included and this can lead to an over-representation of some populations. Moreover, insufficient coverage of all clinically and biologically detected PHI can also bias the conclusion. In France, 12% of new HIV diagnoses are done at the time of PHI, corresponding to 600–700 cases each year.41 Thus, our study presents good coverage of the French PHI population with the inclusion of about 60% of all detected PHI.
Monitoring HIV clusters is crucial in tracking the leading edge of HIV epidemics and designing effective interventions. PHI individuals contribute disproportionately to the spread of the HIV epidemic as highlighted by the high clustering level identified in the current work. Identifying past and currently growing clusters should help to identify the current hotspots of transmission and have a significant impact on HIV epidemic prevention. Previous studies demonstrated that such an identification of core transmitters can successfully impact local transmissions12,42,43 and can become an effective and cost-effective resource for public health intervention on localized outbreaks,15 especially if associated with social networks allowing identification of critical parameters of the epidemic (e.g. populations at higher risk to transmit).44–47 New approaches combining social data and molecular analyses can be particularly valuable for public health interventions, especially as PrEP is increasingly implemented, but will need nationwide surveillance and intervention programmes to allow such intervention and evaluate their efficiency.
In the current work, we established a stable level of TDRAMs among PHI patients in recent years and revealed the important role of RTCs in HIV transmission throughout France, with a large hub in the Paris area. CRF02_AG is actively spreading among large RTCs, participating in the epidemiological shift from subtype B to CRF02_AG observed in French MSM, and is associated with higher viral loads, suggesting a possible higher virulence that will need to be monitored in the future.
We are indebted to the patients, without whom this work would not have been possible.
Acknowledgements
This study was presented at the Conference on Retroviruses and Opportunistic Infections, Boston, MA, USA, 2018 (Abstract 0529) and the Conference on Retroviruses and Opportunistic Infections, Seattle, WA, USA, 2019 (Abstract 0867).
Members of the AC43 ANRS Resistance Group
Amiens, C. Roussel; Angers, H. Le Guillou-Guillemette, A. Ducancelle; Argenteuil, L. Courdavault; Avicenne, C. Alloui, P. Honore; Besançon, Q. Lepiller, D. Bettinger; Bordeaux, P. Bellecave, P. Pinson-Recordon, C. Tumiotto; Brest, S. Vallet, C. Payan, J. C. Duthe; Caen, M. Leroux, J. Dina, A. Vabret; Clermont-Ferrand, A. Mirand, C. Henquell; Créteil-Henri Mondor, M. Bouvier-Alias; Dijon, A. Simohamed; Fort de France, G. Dos Santos; Genève, S. Yerly, C. Gaille, W. Caveng, S. Chapalay, A. Calmy; Grenoble, A. Signori-Schmuck, P. Morand; HU Paris Sud, C. Pallier, M. Raho-Moussa, M. Mole, M.-J. Dulucq; Lille–Tourcoing, L. Bocket, K. Alidjinou; Limoges, S. Ranger-Rogez; Lyon, M. A. Trabaud, V. Icard, J. C. Tardy; Marseille, C. Tamalet; Metz/Thionville, C. Delamare; Montpellier, B. Montes; Nancy, E. Schvoerer, H. Fenaux; Nantes, A. Rodallec, E. André-Garnier, V. Ferré; Nice, A. De Monte; Orléans, A. Guigon, J. Guinard; Paris-Bichat Claude Bernard, D. Descamps, C. Charpentier, B. Visseaux, G. Peytavin; Paris-Cochin, P. Tremaux; Paris-Necker, V. Avettand-Fenoel; Paris-Pitié-Salpêtrière, C. Soulié, I. Malet, M. Wirden, A. G. Marcelin, V. Calvez, P. Flandre, L. Assoumou, D. Costagliola; Paris-Saint Antoine, L. Morand-Joubert, S. Lambert-Niclot, D. Fofana, N. Boukli; Paris-Saint Louis, C. Delaugerre, M. L. Chaix, N. Mahjoub; Paris-Tenon, C. Amiel; Poitiers, G. Giraudeau, A. Beby-Defaux, D. Plainchamp; Rennes, A. Maillard; Rouen, E. Alessandri-Gradt, M. Leoz, J. C. Plantier; Strasbourg, P. Gantner, H. Delagreverie, S. Fafi-Kremer, P. Fischer; Toulouse, S. Raymond, J. Izopet, J. Chiabrando; Tours, K. Stefic, F. Barin, G. Fajole, O. Burgault; Versailles, S. Marque-Juillet.
Funding
This study was supported in part by the French ANRS agency (Agence Nationale de Recherche sur le Sida et les hépatites virales).
Transparency declarations
None to declare.
References
Prise en charge du VIH - Recommandations du groupe d’experts.
EACS Guidelines—Version 9.1.
.
Author notes
Members are listed in the Acknowledgements section.
