


Abstract
Reducing antibiotic prescribing is a priority for health authorities responsible for preventing antimicrobial resistance. Northern Ireland has high rates of antimicrobial use. We implemented a social norm feedback intervention and evaluated its impact.
To estimate the size and duration of the effect of a social norm feedback letter to GPs who worked in the 20% of practices with the highest antimicrobial prescribing.
The letter was sent in October 2017 to 221 GPs in 67 practices. To assess the effect of the intervention, we used a sharp non-parametric regression discontinuity (RD) design, with prescribing rates in the four calendar quarters following the intervention as the outcome variables.
In the quarter following the intervention (October to December 2017) there was a change of −25.7 (95% CI = −42.5 to −8.8, P = 0.0028) antibiotic items per 1000 Specific Therapeutic group Age-sex Related Prescribing Units (STAR-PU). At 1 year, the coefficient was −58.7 (95% CI = −116.7 to −0.7, P = 0.047) antibiotic items per 1000 STAR-PU. The greatest change occurred soon after the intervention. Approximately 18900 fewer antibiotic items were prescribed than if the intervention had not been made (1% of Northern Ireland’s annual primary care antibiotic prescribing).
A social norm feedback intervention reduced antibiotic prescribing in the intervention practices. The diminishing effect over time suggests the need for more frequent feedback. The RD method allowed measurement of the effectiveness of an intervention that was delivered as part of normal business, without a randomized trial.
Introduction
Unnecessary antibiotic consumption increases the risk of antimicrobial-resistant infections, Clostridioides (Clostridium) difficile infection and adverse drug reactions.1,2 A global effort is underway to reduce antibiotic use.3 Northern Ireland has high antibiotic consumption compared with the rest of the UK.4,5 Around 85% of antibiotics used in the publicly funded Health and Social Care service (HSC) are prescribed in primary care.4 Following the recent Review of Antimicrobial Resistance, the UK Government aims to reduce inappropriate antibiotic use by 50% by 2020.6,7 The Northern Ireland Department of Health committed to this goal and HSC introduced measures to reduce antibiotic use.7 These included promoting the TARGET toolkit for primary care8,9 and the Start Smart then Focus guidance for secondary care,10 providing ward-level antibiotic prescribing feedback through a dashboard, funding general practices to identify an antibiotic champion, piloting near-patient C-reactive protein testing and introducing the e-Bug education programme and targets for the reduction of antibiotic use.5 Since 2017 all general practices in Northern Ireland have also had access to a practice-based pharmacist, whose role has included antibiotic stewardship. Evaluating the effect of any single intervention is challenging in the context of such activities and secular and seasonal changes.
Behavioural science can be an important tool to address inappropriate antibiotic prescribing.11 It has successfully influenced decision-making, often in low-cost, relatively simple environmental changes (‘nudges’) that facilitate desirable behaviours without forbidding choices.12 Providing descriptive social norm feedback is an example of a nudge and has been shown to change behaviour in a variety of settings including college drinking,13 food choice,14 hotel linen reuse15 and littering.16 Recently, it has been shown to reduce inappropriate antibiotic prescribing in primary care.17,18
In a 2014 trial, a letter signed by the Chief Medical Officer (CMO) for England was sent to GPs who worked in practices in the top 20% for prescribing antibiotics in England.18 The letter stated that the practice’s antibiotic prescribing was higher than 80% of practices in its area. It was designed so that a simple and striking message was supported by information about steps that could be followed to address prescribing.18,19 The letter was associated with a 3.3% relative reduction in antibiotic prescribing in the intervention practices. Patient-focused campaign materials tested in the same trial had no effect.18 A similar intervention tested in a randomized trial in Australia targeted the highest 30% of individual prescribers of antibiotics and demonstrated a 9%–12% reduction in antibiotic prescribing in the 6 months following the feedback letter.20 A randomized trial carried out in the USA showed that peer comparison feedback delivered by e-mail significantly reduced inappropriate antibiotic prescribing.17 In Northern Ireland, routine information about practice-level antibiotic consumption with peer comparison was already available to practices through a routine quarterly report consisting of tables and charts. In light of recent successful interventions elsewhere that provided this feedback more directly to individual prescribers in formats informed by behavioural science, we adopted the same social norm feedback approach used in England for use in Northern Ireland and evaluated the effect size and duration using regression discontinuity (RD) design, which has comparable robustness to a randomized trial and is suited to interventions delivered on the basis of a threshold value.21–24
Methods
Ethics
This intervention was part of normal service and this study was a service evaluation that did not require research ethics approval according to UK Health Research Authority guidance.
Intervention assignment and outcome measurement
The intervention assignment was made at general practice level on the basis of practices being in the highest prescribing 20% by standardized total antibiotic prescribing rate between 1 July 2016 and 30 June 2017. The total amount of antibiotics (medicines from the BNF Chapter 5, Section 1) prescribed (measured in items issued) was obtained from the Electronic Prescribing Database (EPD) as part of normal HSC business intelligence. The EPD records all dispensed medications paid for by the HSC service in primary care. The prescribing was standardized to give a rate per 1000 Specific Therapeutic group Age-sex Related Prescribing Units (STAR-PU).25 STAR-PU is an age and gender-weighted population that allows comparison between general practice populations. The weights were derived by the Northern Ireland Department of Health for the age and gender composition of the Northern Ireland population and are therefore not directly comparable to those used in England. The STAR-PU for each practice was provided by the Department of Health for April 2018 (the midpoint of the follow-up period).
The outcome measures were the standardized total antibiotic prescribing rates after intervention (1 October 2017 to 31 September 2018) for the main outcomes of the study and between intervention assignment and the intervention (1 July to 30 September 2017) for sensitivity analysis.
Intervention procedure
We used the English social norm feedback ‘nudge’ letter with minimal changes. The letter was signed by Northern Ireland’s CMO, Dr Michael McBride, and sent on behalf of the Northern Ireland Department of Health to every GP in the top 20% antibiotic prescribing practices between 1 July 2016 and 30 June 2017. The Health and Social Care Board (the commissioner for general medical services) identified the named individual GPs who worked in the intervention practices so that they could be written to directly. There was no pre-announcement of the intervention. The letters were posted to each GP on 9 October 2017. The measures of antibiotic prescribing used in this study were for whole practices, not individual prescribers, though the feedback was addressed to the individual GPs in each practice.
Study participants
At the time of the intervention, there were 338 general practices in Northern Ireland. The letter was sent to 221 GPs who worked in the 67 practices with the 20% highest standardized antibiotic prescribing rates between 1 July 2016 and 30 June 2017. We did not attempt to control for the movement of intervention or control GPs between practices, related to mergers, closures and normal staff recruitment, during the follow-up period.
Statistical methods
RD analyses
We used an RD design to assess the effect of the intervention. RD studies estimate the treatment effects in non-experimental settings where the intervention is chosen on the basis of a threshold of an assignment variable.21,22 RD requires mild assumptions and causal inference is more credible than in other natural experiment methods.22,26 We used this method to take advantage of the threshold that determined whether practices received the intervention. For practices near to the threshold, whether or not they received an intervention was ‘as good as randomised’.22
Analyses were conducted in R version 3.5.1.27 For analysis, the assignment variable was centred to make the threshold equal to 0 antibiotic items per STAR-PU by subtracting 1173 antibiotic items per 1000 STAR-PU, which was equivalent to the top 20% antibiotic prescriber threshold. We plotted a smoothed histogram and used the McCrary test28 in rddtools version 0.4.0 to check for density discontinuities in the assignment variable that would suggest practices could manipulate their rank precisely.29 We drew scatter plots with fitted locally estimated scatter plot smoothing (LOESS) regression lines either side of the threshold to visualize the relationships between the assignment and outcome variables.30
We used the sharp RD method as the assignment variable was perfectly associated with intervention status. We used the Imbens and Kalyanaraman31 (IK) 2012 method for bandwidth selection in rddtools. We used a non-parametric local linear regression design with a triangular kernel. Significance was accepted at P < 0.05. The pre-intervention total antibiotic dispensing rate was the assignment variable and the post-intervention rates were the outcome variables. We conducted analyses for each quarter of follow-up data separately and for the time range from the intervention (at the start of October 2017) to the end of each quarter for the following year.
Sensitivity analyses
We performed a ‘placebo’ analysis of alternative thresholds and we plotted the local area treatment effect (LATE) against bandwidth to investigate the effects of bandwidth selection on the effect estimate.
To ensure that the coincidental merging of some practices around the time of the intervention did not influence the results, we repeated the RD analyses with the exclusion of seven practices that had merged with another practice during the pre- or post-intervention period (sensitivity analysis A). The practices that closed during the study (and which therefore were missing follow-up data) were excluded from all analyses. We conducted a further sensitivity analysis (sensitivity analysis B) excluding one practice whose antibiotic prescribing decreased markedly in the follow-up period.
As a further sensitivity test (sensitivity analysis C), we performed the RD analysis using the antibiotic prescribing rate in the quarter July to September 2017 (before the intervention) as the outcome variable. The aim of this analysis was to identify whether the results might be susceptible to any confounding, such as by other routine measures to improve antimicrobial stewardship.
Estimates of change in prescribing and costs
We interpreted the RD estimate as a weighted average treatment effect, as described by Lee and Lemieux.22 The STAR-PU weights based on the registered population for each general practice (i.e. the weighted registered population) at 1 April 2018 were provided by the Department of Health, Northern Ireland. The number of antibiotic prescriptions avoided was estimated by multiplying the effect estimate from the RD analyses (total antibiotic items per 1000 STAR-PU) by the sum of the STAR-PU weighting for the intervention practices and dividing by 1000.
To estimate the approximate cost of each antibiotic item avoided, we investigated the change in antibiotic consumption in the year before and after the intervention for the 65 intervention practices using data from the OpenDataNI website.32 We calculated the average actual cost per item, at the October 2017 to September 2018 prices, of antibiotics which showed a reduction in consumption and applied this average cost to the reduction due to the intervention. This approximation relies on the assumption that the cost of antibiotics not prescribed as a result of the intervention had a similar mean cost to those that were generally less frequently prescribed in the post-intervention period than in the pre-intervention period.
When estimating the change in the number of prescriptions and cost in sensitivity analyses, in order to allow comparison with the main analysis, the effect rate estimate was multiplied by the sum of the denominator for all 65 intervention practices. This therefore assumes that the excluded practices experienced the average treatment effect.
Results
Data were available from 331 practices for the full follow-up period (65 practices that received the letter and 266 practices that received no intervention). Attrition was due to the merging and closure of practices. Approximately 18% of the Northern Ireland registered population was registered at intervention practices and these practices prescribed ∼24% of antibiotic items dispensed (Table 1).
Registered patients and STAR-PU by intervention status
| Practices (n) | Practices in final analyses (n) | Registered patients at practices in final analyses, 1 April 2018 (n) | STAR-PU at practices in final analyses, 1 April 2018 (n) | Estimated antibiotic items dispensed by practices in final analyses, 1 July 2016 to 30 June 2017 (%) | Estimated antibiotic items dispensed by practices in final analyses, 1 October 2017 to 30 September 2018 (%) | |
|---|---|---|---|---|---|---|
| Nudge letter | 67 | 65 | 357810 | 322627 | 423811 (23.5) | 389785 (22.9) |
| No intervention | 271 | 266 | 1610472 | 1451480 | 1376167 (76.5) | 1309658 (77.1) |
| Total | 338 | 331 | 1968282 | 1774107 | 1799979 | 1699443 |
The assignment variable showed no evidence of discontinuous density (Figure S1, available as Supplementary data at JAC Online; P = 0.46).28 This indicates that there was no precise manipulation of the assignment variable that could make the RD design inappropriate. Inspection of a scatter plot of the assignment variable and the outcome variable (Figure 1) and the RD binned average plot (Figure 2) from October to December 2017, immediately following the intervention, reveals a step change with the intervention. Less pronounced steps are visible in the subsequent calendar quarters individually and in the full time period of follow-up (Figure S2 and Figure S3).
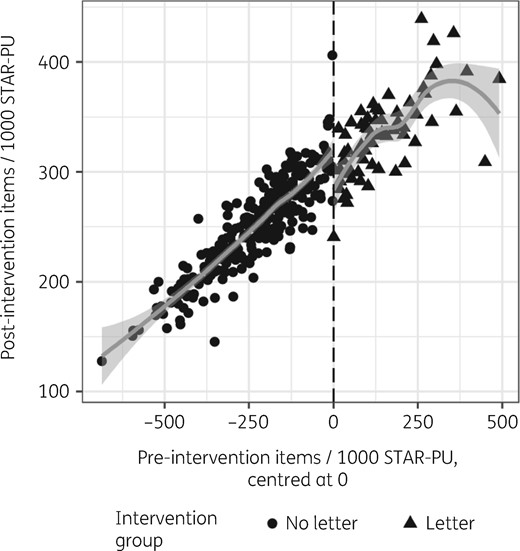
Scatter plot of pre-intervention total antibiotic prescribing and post-intervention antibiotic prescribing, October to December 2017.
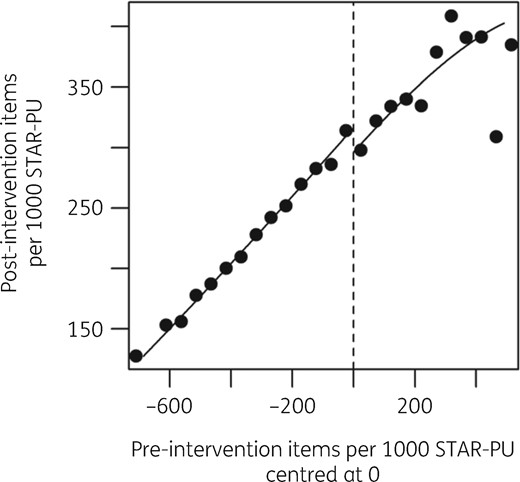
RD plot showing local averages of binned pre-intervention and post-intervention total antibiotics items per 1000 STAR-PU, the intervention threshold and separate fitted regression lines, October to December 2017.
In the first quarter following the intervention (October to December 2017), there was a change of −25.7 (95% CI = −42.5 to −8.8, P = 0.0028) antibiotic items per 1000 STAR-PU (Table 2). Plots of the LATE against bandwidth with 95% CI shows that the bandwidth selected by the IK method was conservative (Figure S4). A sensitivity analysis using ‘placebo’ thresholds with the IK-selected bandwidth showed no evidence of alternative thresholds existing (Figure S5).
RD analyses showing effect estimate at quarterly intervals, October 2017 to September 2018
| Quarter | Individual quarters | From October 2017 to end of quarter | ||||||
|---|---|---|---|---|---|---|---|---|
| coefficient (95% CI) | P | estimated change in antibiotic prescriptions | estimated dispensing cost difference | coefficient (95% CI) | P | estimated change in antibiotic prescriptions | estimated dispensing cost difference | |
| Oct–Dec 2017 | −25.7 (−42.5 to −8.8) | 0.0028 | −8275 | −£25571.17 | −25.7 (−42.5 to −8.8) | 0.0028 | −8275 | −£25571.17 |
| Jan–Mar 2018 | −14.7 (−36.1–6.7) | 0.18 | −4734 | −£14628.72 | −40.2 (−76.8 to −3.6) | 0.031 | −12957 | −£40037.08 |
| Apr–Jun 2018 | −12.9 (−28.8–3.0) | 0.11 | −4163 | −£12864.44 | −54.2 (−101.5 to −6.8) | 0.025 | −17475 | −£53997.40 |
| Jul–Sep 2018 | −3.7 (−16.2–8.8) | 0.56 | −1196 | −£3695.59 | −58.7 (−116.7 to −0.7) | 0.047 | −18938 | −£58519.96 |
With each subsequent quarter, the coefficient increased by a diminishing amount, to −58.7 (95% CI = −116.7 to −0.7, P = 0.047) antibiotic items per 1000 STAR-PU after 1 year. In the final three quarters of follow-up, none of the individual calendar quarters showed a significant change in antibiotic prescribing rate from the pre-intervention period, though in incremental time periods the overall change in the antibiotic prescribing rate was detected (Table 2). In sensitivity analyses A (excluding practices that experienced mergers) and B (excluding one practice that showed marked improvement following the letter), the pattern of results was similar (Table S1 and Table S2). Sensitivity analysis B showed that without one practice that improved markedly following the intervention, the cumulative effect was detectable only up to 6 months of follow-up.
An analysis using the same assignment variable time period but the pre-intervention antibiotic prescribing rate in July to September 2017 as the outcome (sensitivity analysis C) showed no effect associated with the threshold (effect estimate = 0.0, 95% CI = −13.0 to 13.0, P = 1; Figure S6 and Table S3). This supports the interpretation that the change following the intervention was due to the intervention itself and not due to any other programme of prescribing support for practices. RD bandwidths and numbers of observations included are reported in Table S4.
Interpreting the RD estimate as the weighted average treatment effect,22 at the end of 1 year of follow-up, ∼18938 fewer antibiotic items had been prescribed due to the intervention.
During the year of follow-up, there was an overall reduction in antibiotic prescribing of 21849 items compared with the previous year in the intervention practices (Table S5), though some antibiotics were prescribed more frequently due to changes in guidance and practice (for example, pivmecillinam). Antibiotics that had a reduced rate of prescription (i.e. excluding those antibiotics with increased rates of use) had a mean cost of £3.09 per item. If the 18938 antibiotic items avoided due to the intervention followed the same pattern of reduction as in the general reduction, the cost avoided of the antibiotics not prescribed was ∼£58500.
Discussion
Reducing inappropriate antibiotic prescribing is a complex challenge that requires understanding of the factors underlying prescribing behaviours and the design of interventions for behaviour change that are easy, attractive, social and timely.19 We found that a social norm feedback intervention, previously successful in England,18 also worked in Northern Ireland.
A reduction of 59 items per 1000 STAR-PU over 1 year is an ∼5% reduction in standardized prescribing rates for practices close to the cut-off threshold. The reduction in antibiotic prescribing by ∼19000 antibiotic items represents an ∼4.6% reduction in antibiotic prescribing by the intervention practices and a 1% reduction in Northern Ireland’s primary care antibiotic prescribing. This is a considerable contribution to reducing antibiotic use. Approximately £58500 less was spent by the health service on antibiotics due to the intervention in the year of follow-up. The effect that we observed was comparable to that reported by Hallsworth et al.18 The largest reductions were in amoxicillin, ciprofloxacin, clarithromycin, co-amoxiclav, trimethoprim and erythromycin. Ciprofloxacin and co-amoxiclav are among the ‘4C’ antibiotics that increase the risk of C. difficile infection.33 Resistance to co-amoxiclav in Gram-negative bloodstream infections has increased markedly in recent years, so this reduction in consumption is welcome.20
The effect of the intervention appeared to wane over the course of the year, which is an important finding. The diminishing effect could be supposed to relate to the annual influenza season presenting more opportunities to prescribe appropriately, but the main intervention effect was seen before influenza was circulating.34 It seems likely that the feedback became less pressing to prescribers over time. This finding could be used to test variations on the ‘dosing schedule’ in future interventions. We will be interested to observe whether future ‘doses’ maintain their effectiveness.
A feedback intervention offers several advantages over traditional, more complex, face-to-face interventions. The cost of the intervention was very low, amounting to the cost of preparing and posting letters, as well as a modest amount of person-time from our teams in planning, delivering and evaluating the effects of the intervention. Second, a feedback letter does not make further demands on GPs’ time. Finally, a letter can easily be repeated and adapted to future contexts.
The measurable success of this intervention is welcome, as it is often difficult to be certain that any one policy intervention has had an effect, given the lack of randomization, and in a context of seasonal variation, regression to the mean and numerous potentially confounding initiatives. We have shown that the RD design can be effectively used for healthcare policy interventions that are delivered based on meeting a threshold.23 This robust method gives easily interpretable effect estimates. RD could be used for the monitoring and evaluation of existing interventions where it would not be appropriate to repeat randomized trials, but where other use of other observational methods would be complicated by confounding and bias.
One drawback of the RD design is that it has less power than a randomized trial.35 Another issue with the conduct of RD studies is the large number of different choices that can be applied when selecting bandwidth or kernel, which could impact on the effect size and significance.27 We chose to use the widely used standard RD methods of non-parametric regression, IK bandwidth and triangular kernel, and we conducted sensitivity analyses to demonstrate that our choices were reasonable. In the RD literature, there is debate about generalizing the RD estimate ‘away from the threshold’. According to Lee and Lemieux,22 in the presence of heterogeneous treatment effects, the discontinuity gap can be interpreted as a weighted average across all observations, with observations closest to the threshold being weighted most heavily. We have used this assumption to estimate the overall effect of the intervention.
GPs are not the only healthcare professionals who prescribe antibiotics in primary care and it is a limitation of this study that we were unable to target prescribing nurses, pharmacists and optometrists because details of these prescribers employed by each practice were not available to us. We do not have information about whether the intervention reduced inappropriate antibiotic prescribing, or whether any harm resulted from the intervention. There is an urgent need for much more detailed information about the indication for antibiotics prescribed, which can only be met on a population level by codified diagnostic information with prescribing data.
This intervention is an example of a low-cost, simple behavioural ‘nudge’ that policymakers can use to effectively meet their goals without introducing new policies or rules. The use of the RD design allowed us to confirm and estimate the treatment effect in a robust study in the course of normal service delivery and it could be applied to other public health policy interventions that are delivered based on a threshold.
Acknowledgements
We thank the Department of Health, Northern Ireland, for its support for this intervention. We also thank staff in the Business Services Organisation and Department of Health, Northern Ireland, for providing data for analysis in this report.
Funding
This study was carried out as part of our routine work.
Transparency declarations
None to declare.
References
WHO. Global Action Plan on Antimicrobial Resistance.
Public Health Agency. Surveillance of Antimicrobial Use and Resistance in Northern Ireland, Annual Report, 2017.
Department of Health, DEFRA. Government Response to the Review on Antimicrobial Resistance September 2016.
Department of Health Advisory Committee on Antimicrobial Resistance and Healthcare Associated Infection (ARHAI). Start Smart—Then Focus. Antimicrobial Stewardship Toolkit for English Hospitals.
Public Health Agency. Surveillance of Antimicrobial Use and Resistance in Northern Ireland, Annual Report,
