


Abstract
Patients with septic shock may undergo extensive physiological alterations that can alter antibiotic pharmacokinetics.
To describe the population pharmacokinetics of ciprofloxacin in septic shock and to define recommendations for effective ciprofloxacin dosing in these patients.
Adult patients with septic shock treated with ciprofloxacin were eligible for inclusion. Concentrations were measured by HPLC-MS/MS. Population pharmacokinetic modelling was performed with Monte Carlo simulations then used to define dosing regimens that optimize the PTA of an AUC/MIC ratio >125 for different MICs and fractional target attainment (FTA) of empirical and targeted therapy against Pseudomonas aeruginosa.
We included 48 patients with median Simplified Acute Physiology Score (SAPS) II of 49 and 90 day mortality of 33%. Ciprofloxacin pharmacokinetics was best described by a two-compartment linear model including CLCR and body weight as covariates on CL and central volume respectively. With a dose of 400 mg q8h and CLCR of 80 mL/min, >95% PTA was achieved for bacteria with MICs ≤0.25 mg/L. For empirical treatment of P. aeruginosa, 600 mg q8h only reached a maximum of 68% FTA. For directed therapy against P. aeruginosa, a dose of 600 mg q8h was needed to achieve sufficient AUC/MIC ratios.
In patients with septic shock, standard ciprofloxacin dosing achieved concentrations to successfully treat bacteria with MICs ≤0.25 mg/L and then only in patients with normal or reduced CLCR. To cover pathogens with higher MICs or in patients with augmented renal CL, doses may have to be increased.
Introduction
Correct dosing, timing and administration of antibiotics is one of the primary treatments for patients with septic shock. The prescription of antibiotics is most often made empirically whilst the causative pathogen is unknown. Sepsis pathophysiology leads to vasoplegia and altered vessel permeability with increased capillary leakage causing tissue oedema, particularly in the context of aggressive fluid resuscitation. These alterations can impact the pharmacokinetics (PK) of administered drugs, including antibiotics and, because of these alterations, standard dosing may lead to suboptimal drug concentrations.1
In recent years there has been an increasing focus on how these alterations will impact the concentrations of β-lactam antibiotics and there is a growing body of evidence that in certain circumstances, where renal CL is high, doses have to be increased far above standard dosing regimens to achieve sufficient drug concentrations.2,3 However, less is known for how other classes of antibiotics, such as quinolones, are affected by the sepsis pathophysiology.
Quinolones are a class of antibiotics discovered >50 years ago as a byproduct in chloroquine synthesis.4 They act by inhibiting DNA gyrase and topoisomerase IV, which are essential for DNA synthesis, transcription and cell division.
Ciprofloxacin is a second-generation quinolone and is used both as the sole agent in various infections and in a combination regimen, with a β-lactam antibiotic, in empirical treatment of severe infections. It is one of the most frequently prescribed antibiotics in the world and is classified by the WHO as an essential medicine and a critically important antibiotic.5
As bacterial killing by quinolones is concentration dependent, the pharmacodynamic (PD) properties are optimized through achieving either a high Cmax during the dosing interval, relative to the MIC of the bacteria, or a high AUC relative to the MIC.6
The optimal PK/PD targets for quinolones are suggested to be a Cmax/MIC ratio of 8–10 and an AUC/MIC ratio of >125.6,7 Whether these target exposures are consistently met in patients with septic shock is not well understood and we therefore undertook this study to describe the population PK of ciprofloxacin and to define maximally effective ciprofloxacin dosing regimens in these patients.
Patients and methods
Setting
We conducted a single-centre observational PK study at the University Hospital of Copenhagen (Rigshospitalet), which is a tertiary referral mixed ICU with 23 beds and ∼1200 admissions per year. The scientific ethics committee of Copenhagen, Denmark (approval no. H-3-2014-074), the Danish Data Protection Agency (approval no. 30-1252) and the Danish Health and Medicines Authority (registration no. 2014062429) approved the study. The study was registered with the European Clinical Trials Database (EudraCT-no. 2014-002555-26) and Clinical Trials (NCT02240277) and monitored according to Good Clinical Practice (GCP) by the GCP unit of the University of Copenhagen (project no. 2014-699).
Written informed consent was obtained from the patients’ legal substitute decision makers and from the patients.
Study population
Adult patients (≥18 years old) with septic shock were eligible for inclusion if they were started on empirical or targeted treatment with ciprofloxacin as the sole agent or in combination with other antimicrobials. All treatment strategies, including choice and dosing of antibiotics were at the discretion of the treating doctor. Septic shock was defined as sepsis with persistent hypotension (systolic blood pressure <90 mmHg or mean arterial pressure <65 mmHg) despite adequate fluid resuscitation or the requirement of vasopressor support.8,9 We excluded patients with: (i) serum creatinine concentration ≥170 μmol/L on the day of sampling; (ii) use of renal replacement therapy; (iii) pregnancy; or (iv) a history of allergy to ciprofloxacin.
Study protocol
Ciprofloxacin was administered as an infusion over 45–60 min. A serum concentration curve was analysed by collecting seven blood samples per subject from an existing arterial or central line in 4 mL lithium–heparin anticoagulant vials during a single dosing interval. The collection timepoints were: pre-infusion (0 mins), during infusion (30 min and 45 min) and post-infusion (1 h, 2 h, 4 h and 8 h after commencing infusion). Urine collection was performed simultaneously during the 8 h dosing interval and analysed for creatinine and urea concentrations. Additional clinical and demographic data of the patient were collected from the department’s clinical information system.
Sample handling and storage
Blood samples were immediately stored at 4°C and centrifuged at 2000 g for 10 min within 4 h of sampling. Plasma samples were pipetted into cryovials and stored at −80°C until analysis of ciprofloxacin concentrations.
Ciprofloxacin analysis in plasma and urine
Ciprofloxacin was measured in plasma and urine by a validated HPLC-fluorescence method on a Shimadzu Prominence HPLC system (Kyoto, Japan). Samples were assayed alongside matrix-matched calibrators and quality controls and met batch acceptance criteria (US FDA 2001).
Sample preparation
Urine was diluted 1/100 to bring it within the instrument concentration range. Plasma or diluted urine (100 μL) was treated with 6% trichloroacetic acid to precipitate any proteins. The supernatant (0.5 μL) was submitted to the instrument.
Chromatography
The stationary phase was a Waters Xbridge C18, 2.1 × 30 mm, 2.5 μm column (Milford, USA) operated at 50°C. The mobile phase was 3% acetonitrile and 97% 25 mM phosphate buffer at pH 3.0 (v/v). The mobile phase was delivered isocratically at 0.4 mL/min producing a backpressure of ∼1400 psi. The run time was 15 min with ciprofloxacin being well separated (11.6 min) from all other chromatographic peaks.
Detection
Ciprofloxacin was monitored by fluorescence at an excitation of 278 nm and emission of 456 nm.
Validation
The assay method was validated with reference to the FDA criteria for bioanalysis (US FDA, 2001). The method was linear from 0.1 to 10 μg/mL for plasma and CAMHB and from 10 to 1000 μg/mL for urine (undiluted). Precision and accuracy were tested at three concentrations for each matrix. Precision was within 6.0%, 7.5% and 12.0% and accuracy was within 1.8%, 4.4% and 14.3% for CAMHB, plasma and urine, respectively.
Population PK modelling
To describe ciprofloxacin concentrations, one- and two-compartment models were developed with the Non-parametric Adaptive Grid (NPAG) algorithm within the freely available Pmetrics software package for R (Los Angeles, CA, USA).10,11 Elimination from the central compartment and intercompartmental distribution into the peripheral compartment (two-compartment model) were modelled as first-order processes. Discrimination between different models used comparison of the −2 log likelihood (−2LL) and assessment of goodness-of-fit models. A P value of <0.05 was considered statistically significant.
Population PK covariate screening
Age, gender, BMI, serum creatinine, calculated CLCR using the Cockcroft–Gault (CG) equation, estimated glomerular filtration rate (eGFR), urine creatinine (UCr), urea, albumin, serum protein, fluid balance in the preceding 24 h, fluid balance during ICU stay, SOFA, APACHE II and Simplified Acute Physiology Score (SAPS) II scores and length of ICU stay were evaluated as clinically relevant and physiologically plausible covariates. Covariate selection was performed using a stepwise linear regression from R on all covariates and Bayesian posterior parameters. Potential covariates were separately entered into the model and statistically tested by use of the −2LL values. If inclusion of the covariate resulted in a statistically significant improvement in the −2LL values (P < 0.05) and/or improved the goodness-of-fit plots, then the covariate was retained in the final model.
Model diagnostics
Goodness of fit was assessed by linear regression, with an observed–predicted (both population- and individual-predicted concentrations) plot, coefficients of determination and −2LL values. Predictive performance was based on mean prediction error (bias) and the mean bias-adjusted squared prediction error (imprecision) of the population and individual prediction models. The internal validity of the population PK model was assessed by the bootstrap resampling method (n = 1000) and normalized prediction distribution errors (NPDEs).12 Using the visual predictive check (VPC) method, parameters obtained from the bootstrap method were plotted with the observed concentrations. NPDE plots were checked for normal distribution characteristics and trends in the data errors.
PTA
Monte Carlo simulations (n = 1000) were employed using Pmetrics software to determine the ciprofloxacin PTA of achieving the PK/PD target of AUC/MIC ratio >125 for various MICs (0.008 to 2.0 mg/L) during the intermittent infusion. Intravenous intermittent doses of 200, 400 and 600 mg q8h and q12h were simulated. Four different body weights (60, 80, 100 and 140 kg) at fixed CLCR of 78 mL/min were simulated. Furthermore, three different levels of renal function, using CLCR calculated with the CG equation (CLCR of 30, 80 and 150 mL/min) at a fixed body weight of 76 kg were also included in the simulation process. Lastly, the effect of an initial bolus dose of 800 mg on PTA, on a regular dose of 400 mg q8h, was simulated with a fixed CLCR of 78 mL/min and at various weights. A priori a dosing regimen was considered successful if the PTA was ≥95%.
Fractional target attainment (FTA) calculation
The MIC distribution of Pseudomonas aeruginosa from the EUCAST database (available at www.eucast.org; date accessed 16 December 2017) was used to determine FTA. The FTA identifies the likely success of treatment by comparing the PD exposure (PTA) of ciprofloxacin against an MIC distribution. A priori a dosing regimen was considered successful if the FTA was ≥95%. The MIC distribution for susceptibility of P. aeruginosa (an MIC of 0.5 mg/L) was used to determine the FTA for directed therapy. Furthermore, the entire MIC distribution (MICs for susceptible and resistant isolates) was tested to determine the FTA, as would be encountered with empirical monotherapy.
Results
Patients
We included 49 patients with septic shock: 26 males and 23 females, with a median age of 64 years. One male patient withdrew consent, leaving 48 patients in the final analysis. The demographics and clinical data are presented in Table 1. Soft tissue infection was the most common cause of sepsis, followed by a pulmonary focus. The patients had a median SAPS II score of 49 and SOFA score of 8 (at day of inclusion) with a mortality rate at 90 days of 33%. The prescribed daily dose was 400 mg q12h in 42 patients and 600 mg q12h in six patients.
Demographics and clinical data for included patients
| Characteristics | Patient values |
|---|---|
| Age (years) | 64 (24–89) |
| Sex (male/female) | 25/23 |
| BMI (kg/m2) | 26 (17–55) |
| Serum creatinine (μmol/L) | 98 (39–220) |
| 8 h CLCR (mL/min) | 67 (7–204) |
| Serum albumin (g/L) | 19 (11–34) |
| Fluid balance in ICU (mL) | +12 (−4349 to 16 380) |
| Fluid balance in the last 24 h (mL) | +964 (−3352 to 5040) |
| Days of treatment before sampling | 1.3 (0–10) |
| Origin of sepsis, n (%) | |
| lung | 13 (27) |
| abdomen | 9 (19) |
| urinary tract | 0 |
| soft tissue | 19 (40) |
| other | 7 (15) |
| APACHE II score (at admission) | 26 (10–41) |
| SAPS II | 49 (22–87) |
| SOFA score (at day of inclusion) | 8 (5–14) |
| Survival (% at 90 days) | 67 |
Data presented are median (range) or number of patients.
PK model
For the enrolled patient population, the median (IQR) AUC was 70.4 (54.6–92.7) mg·h/L. A two-compartment linear model best described the time course of the total plasma ciprofloxacin concentrations (Figure 1) with zero order input of drug into the central compartment. CLCR on drug CL (normalized to the sample mean value of 76 mL/min) and body weight (normalized to the sample mean value of 77 kg) on central V, were supported for inclusion in the final model. After including these covariates, the −2LL values decreased (by 1174.1 and 898.6, respectively) and the overall goodness-of-fit improved i.e. covariates exclusion versus covariates inclusion (P < 0.05). Both of these covariates were retained in the final model.
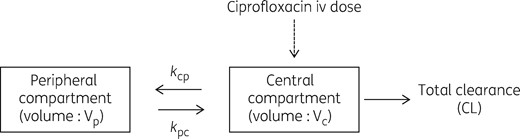
Structural PK model for ciprofloxacin. kcp, rate constant for drug distribution from the central to peripheral compartment; kpc, rate constant for drug distribution from the peripheral to central compartment.
where CL is the typical value of ciprofloxacin clearance, CLCR is creatinine clearance (mL/min), V is the typical value of ciprofloxacin volume of distribution, WT is the body weight.
The mean (SD) population PK parameter estimates from the final covariate two-compartment model are shown in Table 2. The diagnostic plots to confirm the goodness of fit of the model were considered acceptable and are shown in Figures 2(a, b) and 3. The final covariate models were then used for dosing simulations.
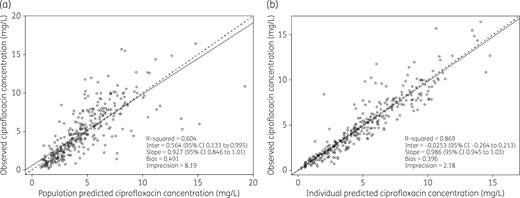
Diagnostic plots for the final covariate two-compartment model. Observed versus population-predicted total ciprofloxacin concentrations (a) and individual predicted total ciprofloxacin concentrations (b).
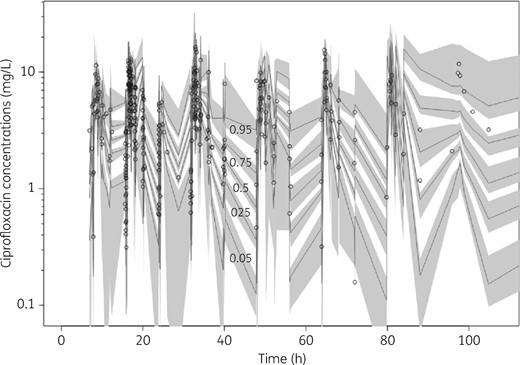
VPC of total ciprofloxacin plasma concentrations. The median and 5th to 95th percentiles of simulated data, with their respective 95% CIs, are shown. Individual circles represent observed data.
Parameter estimates for ciprofloxacin from the final covariate two-compartment population PK model
| Parameters | Mean | SD | Coefficient of variation | Median |
|---|---|---|---|---|
| CLCIP (L/h) | 15.241 | 6.538 | 42.897 | 14.480 |
| Vc (L) | 38.564 | 21.282 | 55.186 | 37.971 |
| kcp (h−1) | 2.461 | 2.816 | 114.397 | 1.653 |
| kpc (h−1) | 1.304 | 4.299 | 329.656 | 0.671 |
| Parameters | Mean | SD | Coefficient of variation | Median |
|---|---|---|---|---|
| CLCIP (L/h) | 15.241 | 6.538 | 42.897 | 14.480 |
| Vc (L) | 38.564 | 21.282 | 55.186 | 37.971 |
| kcp (h−1) | 2.461 | 2.816 | 114.397 | 1.653 |
| kpc (h−1) | 1.304 | 4.299 | 329.656 | 0.671 |
CLCIP, total ciprofloxacin CL; Vc, central V; kcp, rate constant for drug distribution from the central to peripheral compartment; kpc, rate constant for drug distribution from the peripheral to central compartment.
Dosing simulations
PTA
Figure 4 shows the PTAs of AUC/MIC ratio >125 for ciprofloxacin intermittent infusion (200, 400 and 600 mg, q8h and q12h) with a CLCR of 30, 80 and 150 mL/min, at fixed body weight (76 kg). At the lowest daily dose (200 mg q12h) and the highest CLCR (150 mL/min), the highest MIC for obtaining a PTA ≥95% was 0.032 mg/L, which was increased to 0.125 mg/L with a dose of 400 mg q12h. Only the highest dose (600 mg q8h) and the lowest CLCR (30 mL/min) achieved sufficient target attainment for an MIC of ≤0.5 mg/L. The influence of body weight (at a fixed CLCR of 78 mL/min) on PTA was less compared with variation in CLCR and is shown in Figure 5. The results were similar to the variation in CLCR in that a dose of 200 mg q12h was sufficient for target attainment of MICs of ≤0.064 mg/L and that a dose of 400 mg q12h was sufficient for MICs of ≤0.125 mg/L. Simulations using an 800 mg first dose, followed by 400 mg q8h doses, demonstrated an increase in PTA on day 1 of therapy, particularly up to MICs of 0.5 mg/L, with a PTA up to 75%–85%, depending on patient weight, compared with PTAs of 26%–49% with the standard 400 mg q8h.
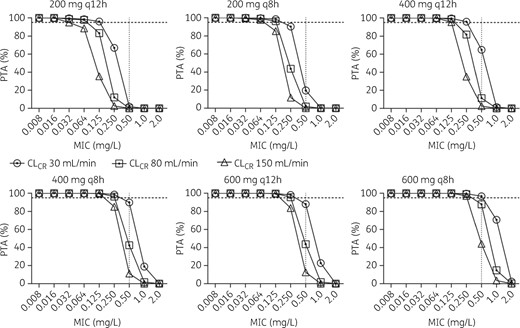
Monte Carlo simulation for ciprofloxacin PTA (AUC/MIC >125) at different CLCRs. Dotted horizontal line indicates 95%, above which the PTA was considered successful.
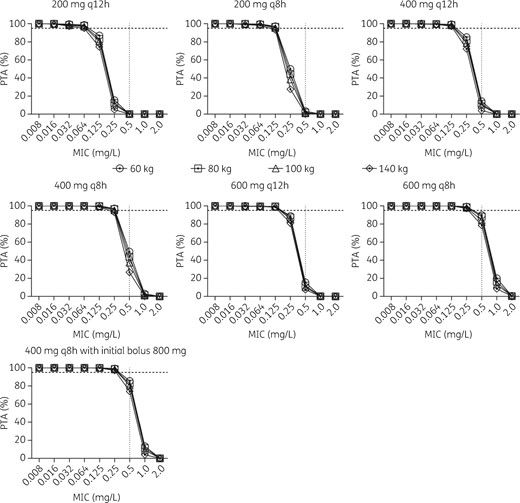
Monte Carlo simulation for ciprofloxacin PTA (AUC/MIC >125) at different weights. Dotted horizontal line indicates 95%, above which the PTA was considered successful.
FTA
As expected, simulation of empirical treatment of P. aeruginosa achieved poorer target attainment compared with targeted treatment. In fact, no dosing regimen achieved a ≥95% FTA in empirical treatment, as shown in Figure 6(a). For targeted treatment, a dose of 400 mg q12h reached an FTA of 93%, 82% and 69% for a CLCR of 30, 80 and 150 mL/min, respectively (Figure 6b). For different body weights, the variation was again less compared with variations in CLCR, with an FTA of ∼80% for targeted treatment and ∼60% for empirical treatment with a 400 mg q12h dosing regimen Figure 6(c, d).
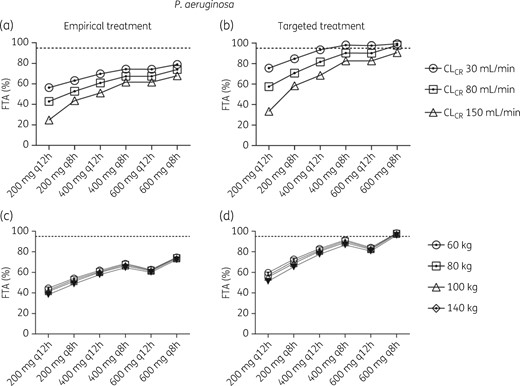
FTA for empirical (a, c) or targeted (b, d) treatment of P. aeruginosa at different CLCR (a, b) or weight (c, d). The EUCAST MIC distribution of 0.016–512 mg/L was used for empirical treatment and ≤0.5 mg/L for targeted treatment and considered successful if the FTA was ≥95%.
Discussion
In this PK/PD study of ciprofloxacin dosing in patients with septic shock we have shown that what today is considered normal dosing, i.e. 800–1200 mg/day, in many instances will result in exposures that are likely insufficient to achieve optimal exposures against strains of P. aeruginosa at the susceptibility breakpoint.
In the final covariate model, CLCR and weight were the two factors that significantly explained PK differences between the included patients and improved the fit of the model. From a steady-state point of view, the CL of the drug is the factor most affecting the drug concentration and V may be considered more important for the initial dosing and time to reach the steady-state concentrations. This was also reflected in the PTA and FTA simulations where the different CLCRs tested had a larger impact on the PTA compared with weight, where the variation between the two extremes simulated (60 versus 140 kg) was considerably less. As also shown in our simulations, a bolus dose should be considered as this increases the target attainment by 35%–45% at higher MICs. The increase was seen in all simulated weights, indicating that it would benefit target attainment for all patients, but the highest increment was seen in what would be considered the obese population, likely because they tend to have a larger V. For continued treatment, patient weight would be less important and doses should be adjusted exclusively according to alterations in renal CL. As for other antibiotics with PK strongly related to renal function it is thus important to avoid underdosing in patients with augmented renal CL2 as well as to avoid potentially toxic concentrations in patients with severely impaired renal function.
The results of the PTA simulation indicate that to achieve an optimal exposure (AUC/MIC >125) with a standard dose of 400 mg q12h, for all levels of CLCR, the MICs for the bacteria treated should be ≤0.125 mg/L; for bacteria with MICs ≥0.25 mg/L a higher daily dose of 1200 mg has to be used in patients with normal CLCR (i.e. 80 mL/min) but would fail in patients with increased CLCR (i.e. 150 mL/min). With higher MICs (>0.25 mg/L), there was no dose that achieved PTA above 95%. Since the breakpoints for susceptibility for many common bacteria, where ciprofloxacin would be considered an adequate choice, are around or above this level (e.g. MIC breakpoint for Enterobacteriaceae is 0.25 mg/L), this is troublesome in settings where local antibiograms indicate that many isolates have MICs approaching the susceptibility breakpoint and should therefore prompt the administration of at least 1200 mg/day ciprofloxacin.
The FTA data demonstrated that for empirical therapy (i.e. attempting to cover 95% of P.aeruginosa with all reported MICs, including resistant strains) it was impossible to achieve target exposures. Even at the highest daily dose simulated of 1800 mg and the lowest CLCR of 30 mL/min there would only be a 79% success rate. With directed therapy, the 95% target was also difficult to achieve with normal dosing and normal CLCRs. At a daily dose of 1200 mg the target was only reached if the renal CL was reduced to 30 mL/min and the highest dose (1800 mg) investigated in this study was needed to achieve >95% FTA with a normal CLCR of 80 mL/min. Even though ciprofloxacin in general is considered safe, with a low toxicity profile,13 the risk of adverse events for the highest daily dosage simulated in this study has not been thoroughly investigated. It is also not clear whether toxicity is mainly peak driven or AUC driven so that potential adverse effects could be reduced by altering the number of administrations per day.
Should a 95% success rate be considered too unobtainable, a 90% limit could be used and still clinically relevant, in which case successful FTA would be achieved with a daily dose of 1200 mg (400 mg q8h or 600 mg q12h). This underachievement of an adequate AUC/MIC is likely a risk factor for emergence of resistance and more difficult-to-treat infections.
Relation to previous PK/PD trials
Together with the present study, there is a growing body of evidence that traditional dosing of ciprofloxacin is not achieving optimal PD targets. In a study on 32 critically ill patients, van Zanten etal.14 concluded that with a ciprofloxacin dose of 400 mg q12h, an AUC/MIC >125 was only achieved in isolates with an MIC of ≤0.125 mg/L and for higher MICs there was a stepwise reduction in target attainment. They did not simulate for different levels of CLCR but found that increasing renal SOFA score predicted a higher AUC, probably due to increased renal dysfunction.14 A poor target achievement was also observed in a study of 80 hospitalized patients receiving 400–1200 mg of ciprofloxacin daily. For bacteria with MICs of ≤0.25 and ≤0.5 mg/L and a desired efficacy target of AUC/MIC >125, only 79% and 25% of patients, respectively, attained this target and a daily dose of 1600 mg was required for a target attainment above 90% for the highest MIC value. Conil et al.15 evaluated a standard dose of 400 mg twice daily in a mixed population of critical care patients, mainly trauma, and found that the mean AUC/MIC was 83 (±74) for MIC of 0.5 mg/L and 42 (±37) for MIC of 1 mg/L, again demonstrating that standard dosing does not attain sufficient plasma concentrations for treatment of bacteria where ciprofloxacin is a recommended choice of treatment.15
Strengths
This is one of the largest trials investigating ciprofloxacin PK/PD in patients with septic shock admitted to ICU. The sample size allows for a reliable estimate of the PK in this population and thus for high external validity.16 The study has focused on a vulnerable patient population that is known to have significant alterations in physiology and also high variation in PK. It is also a patient population that has the most to gain from an optimized antibiotic administration since treatment failure increases the risk of negative clinical outcome.
Limitations
As we measured plasma concentrations of ciprofloxacin and the PD properties in this compartment, we are not able to draw any conclusions on ciprofloxacin concentrations in other tissues. However, the PK of quinolones in blood is likely to be very similar to that in other tissue compartments.6 As stated above, we chose to set the limit for successful target attainment to 95%, which can be considered high. However, even with a somewhat lower level the results would only show a small variation and demonstrate that with our results it would still be difficult to achieve concentrations necessary to treat bacteria with MICs ≥0.25 mg/L. Most of the included patients were treated with other antibiotics in combination with ciprofloxacin. We can therefore not make any associations for plasma ciprofloxacin exposure and patient outcome or bacterial eradication.
Conclusions
This study shows that there is a high risk of underdosing ciprofloxacin in patients with septic shock, especially in isolates close to the susceptibility breakpoint. In these patients, doses of at least 1200 mg/day are required. An initial bolus dose greatly improves the target attainment. However, higher doses may also increase the risk of adverse events, which might go undetected in critically ill patients who are prone to similar adverse events due to their underlying disease and concomitant treatment with other drugs and interventions. Therapeutic drug monitoring to tailor dosing should be considered to increase the likelihood of therapeutic target achievement and avoid unnecessary high concentrations.
Funding
This work was funded by Skane Region Research Funds for F. S.. J. A. R would like to acknowledge funding from the Australian National Health and Medical Research Council for a Centre of Research Excellence (APP1099452) and Practitioner Fellowship (APP1117065).
Transparency declarations
None to declare.
