


Abstract
Farm-level quantification of antimicrobial usage (AMU) in pig farms.
In a cross-sectional study, AMU data on group treatments administered to a single batch of fattening pigs from birth to slaughter (group treatment data) and antimicrobials purchased during 1 year (purchase data) were collected at 180 pig farms in nine European countries. AMU was quantified using treatment incidence (TI) based on defined (DDDvet) and used (UDDvet) daily doses and defined (DCDvet) and used (UCDvet) course doses.
The majority of antimicrobial group treatments were administered to weaners (69.5% of total TIDDDvet) followed by sucklers (22.5% of total TIDDDvet). AMU varied considerably between farms with a median TIDDDvet of 9.2 and 7.1 for a standardized rearing period of 200 days based on group treatment and purchase data, respectively. In general, UDDvet and UCDvet were higher than DDDvet and DCDvet, respectively, suggesting that either the defined doses were set too low or that group treatments were often dosed too high and/or administered for too long. Extended-spectrum penicillins (31.2%) and polymyxins (24.7%) were the active substances most often used in group treatments, with the majority administered through feed or water (82%). Higher AMU at a young age was associated with higher use in older pigs.
Collecting farm-level AMU data of good quality is challenging and results differ based on how data are collected (group treatment data versus purchase data) and reported (defined versus used daily and course doses).
Introduction
During their general assemblies of 2015, WHO, the World Organisation for Animal Health (OIE) and the Food and Agriculture Organization (FAO) re-emphasized the importance of the public health crisis posed by antimicrobial resistance (AMR).1–3 Since there are strong indications of animal–human transmission of AMR4,5 and that antimicrobial usage (AMU) is the strongest driver for selection of AMR,6,7 it is important to reduce veterinary AMU.8
To target AMU in food-producing animals, WHO and the OIE recommend that the quantities of antimicrobials used in food-producing animals are monitored.9,10 In Europe, sales data of antimicrobials are monitored in a standardized manner by the European Surveillance of Veterinary Antimicrobial Consumption (ESVAC) project and reports show that considerable differences exist between countries.11 In ESVAC reports, no distinction is made between livestock species, whereas it is known that there are differences in AMU between species. Pig production accounts for a large proportion of AMU in animal production.12–14 Furthermore, ESVAC sales figures at the country level do not take into account the large differences in dosage between different antimicrobial compounds nor show how antimicrobials are used between different age categories of livestock species.8
Standardized AMU quantification will allow for benchmarking between farms in different geographical areas, regions, etc., and will also allow the study of its association with animal health, production characteristics and AMR. However, before the aforementioned associations with AMU can be explored, more detailed data such as the assessment of exposure (e.g. exposure duration) are required at the farm level.15
Therefore, this study aimed to quantify AMU for pigs at the farm level in nine European countries in a standardized manner. This study was conducted within the European research project EFFORT (Ecology from Farm to Fork Of microbial drug Resistance and Transmission), which investigates the epidemiology and ecology of AMR in food-producing animals, the environment and humans to quantify AMR exposure pathways for humans.
Materials and methods
Ethics
Written informed consent from the participating farmers was obtained.
Selection of farms
A cross-sectional study was conducted in Belgium, Bulgaria, Denmark, France, Germany, Italy, Poland, Spain and the Netherlands. To obtain a sample of farms that were comparable within and between countries, 20 conventional farrow-to-finish pig farms, with no other livestock for commercial intentions, were selected in each country according to the following inclusion criteria: a minimum of 150 sows and 600 finishing places and using a batch management system. The farms were required not to have contact with each other through trade and each farm had only one owner. Farms were selected based on these criteria in agreement with local farming organizations, and also partially based on convenience (e.g. distances to farms). As a result, the sample of farms in each country cannot be considered representative for the pig sector in that country. The country-specific selection procedure (Appendix A) together with characteristics of the sampled farms (Table S1) and an illustration of the swine industry in each participating country (Figure S1) are available as Supplementary data at JAC Online and elsewhere.16
Overview of the quantification of antimicrobial group treatments administered to a single batch of fattening pigs from birth to slaughter expressed in TI per 100 pigs at risk, based on DDDvet, UDDvet, DCDvet and UCDvet
| Country | TI200DDDvet | TI200UDDvet | Relative deviation TI200DDDvet vs TI200UDDveta | TI200DCDvet | TI200UCDvet | Relative deviation TI200DCDvet vs TI200UCDveta |
|---|---|---|---|---|---|---|
| A | 9.2 (3.1–31.9) | 7.5 (3.4–20.8) | 12 (−31 to 52) | 1.7 (0.3–7.9) | 1.0 (0.5–3.4) | 40 (−61 to 69) |
| B | 6.5 (0.8–24.9) | 5.3 (0.8–17.6) | 19 (−30 to 53) | 1.2 (0.4–5.3) | 1.1 (0.7–5.2) | −1 (−70 to 41) |
| C | 9.1 (1.1–23.8) | 7.1 (1.2–13.1) | 17 (−11 to 44) | 2.5 (0.2–6.8) | 2.4 (0.4–5.8) | 6 (−94 to 54) |
| D | 17.5 (9.3–50.1) | 13.7 (5.7–34.2) | 25 (4–36) | 3.6 (1.4–8.1) | 3.3 (1.3–4.9) | 14 (−18 to 50) |
| E | 5.5 (0.0–11.7) | 6.3 (0.0–13.3) | −7 (−81 to 39) | 0.6 (0.0–1.6) | 0.7 (0.0–1.6) | 12 (−71 to 49) |
| F | 0.0 (0.0–4.9) | 0.0 (0.0–5.8) | 10 (−19 to 39) | 0.0 (0.0–0.9) | 0.0 (0.0–0.9) | 25 (−34 to 44) |
| G | 12.9 (5.4–19.6) | 9.8 (6.9–16.9) | 20 (−35 to 41) | 2.5 (1.3–6.7) | 2.0 (1.3–3.5) | 28 (−51 to 63) |
| H | 56.7 (13.5–94.1) | 55.6 (9.4–83.3) | 8 (−30 to 25) | 9.2 (4.1–13.1) | 5.6 (2.9–7.7) | 39 (20–55) |
| I | 0.5 (0.01–3.2) | 0.4 (0.01–2.2) | 2 (−57 to 68) | 0.2 (0.003–0.6) | 0.1 (0.002–0.3) | 36 (−2 to 75) |
| Overall | 9.2 (0.0–46.6) | 7.3 (0.0–44.2) | 14 (−37 to 45) | 1.6 (0.0–9.2) | 1.3 (0.0–5.3) | 25 (−50 to 60) |
| 0.96b | 0.94b |
TI200 summarizes the TIs for the age categories (sucklers, weaners and finishers) for a standardized rearing period of 200 days. TI200DDDvet and TI200UDDvet express the percentage of pigs that received a dose of antimicrobials each day or, equivalently, during which percentage of time a pig was treated with antimicrobials in its entire life. TI200DCDvet and TI200UCDvet express the percentage of pigs for which a treatment was initiated. The relative deviation between TI200DDDvet and TI200UDDvet [(TI200DDDvet–TI200UDDvet)/TI200DDDvet] and between TI200DCDvet and TI200UCDvet [(TI200DCDvet – TI200UCDvet)/TI200DCDvet] is also shown. A positive deviation indicates that a higher dose was used than defined by ESVAC. Median values are shown, with 10th and 90th percentiles in brackets, per country and overall, as well as the overall Spearman correlation for the relative deviations, with P value in brackets.
Values shown are the median (10th–90th percentile).
Spearman correlation coefficients (P < 0.001).
Collection of AMU records
The farms were visited between June 2014 and December 2015. From each farm, data were collected on antimicrobial group treatments from birth to slaughter during the rearing of one batch of fattening pigs (further referred to as group treatment data). A group treatment was defined as each treatment applied simultaneously to all animals present in, at least, the smallest housing unit. Individual treatments were not included as these are prone to recall bias as they are often not well recorded.17 Furthermore, data on antimicrobials purchased during the year preceding the visit were acquired (further referred to as purchase data). Data collection was based on a questionnaire developed within the EFFORT consortium (Appendix B). The collected variables applied in the AMU quantification are described in Appendix C.
Data processing
Data were entered into EpiData 3.1 (EpiData Association, Denmark) and checked for quality. Further data quality checks were performed using ActivePerl 5.24.1 (ActiveState Software Inc.) and SAS 9.4 (SAS Institute Inc., Cary, NC, USA). Ten percent of all questionnaires were entered twice and compared in SAS to check for data entry quality. All inconsistencies were corrected and datasets from countries with >5% of inconsistencies were thoroughly re-evaluated. Data required for AMU quantification were imported into Microsoft Excel and a second, more in-depth, data quality control was performed. Finally, an online database was created which consisted of all study data and metadata. All farms were anonymized to ensure that results cannot be traced back to individual farms. Countries were anonymized as required by one participating country.
AMU quantification
TIDDDvet and TIUDDvet express the percentage of pigs that received a dose of antimicrobials each day or, equivalently, during which percentage of time a pig was treated with antimicrobials in a certain production phase or its entire life.18 TIDCDvet and TIUCDvet express the percentage of pigs for which a treatment was initiated.
UDDvet values were derived from the data on the truly administered products and UCDvet values were obtained by multiplying UDDvet with the treatment duration. DDDvet and DCDvet values were used as provided by ESVAC.19 Whenever, for a given combination of active substance and administration route, no DDDvet and DCDvet values were defined by ESVAC, the values as described by Postma et al.20 were used or the data were obtained from the summary of product characteristics of that specific product. LA factors were used as described by Postma et al.20 To obtain the treatment duration for LA formulations the number of days the treatment was applied was multiplied by the LA factor. The detailed calculation of TI is described in Appendix C, Tables S2 and S3.
Overview of the quantification of antimicrobials purchased during 1 year for fattening pigs from birth to slaughter and sows expressed in TI per 100 pigs at risk, based on DDDvet values per age category (sucklers, weaners, finishers and sows) and for fattening pigs combined from birth to slaughter for a standardized rearing period of 200 days (TI200)
| Country | TIDDDvet sucklers | TIDDDvet weaners | TIDDDvet finishers | TI200DDDvet | TIDDDvet sows |
|---|---|---|---|---|---|
| A | 9.1 (0.4–45.5) | 23.5 (1.9–67.8) | 1.5 (0.0–14.9) | 8.1 (2.7–31.4) | 0.4 (0.02–3.7) |
| B | 2.4 (0.0–16.8) | 13.2 (0.0–45.3) | 0.9 (0.01–7.2) | 6.3 (0.4–15.0) | 0.3 (0.0–3.6) |
| C | 0.3 (0.0–19.4) | 0.0 (0.0–24.7) | 0.0 (0.0–2.4) | 0.6 (0.0–16.1) | 0.0 (0.0–0.9) |
| D | 32.5 (8.9–118.0) | 135.0 (48.3–254.4) | 11.7 (1.8–24.9) | 30.1 (14.2–58.5) | 0.8 (0.4–6.2) |
| E | 6.3 (0.8–23.6) | 14.1 (2.9–94.4) | 0.8 (0.0–3.9) | 8.4 (2.8–32.1) | 0.7 (0.2–4.4) |
| F | 1.6 (0.0–33.7) | 1.0 (0.0–4.8) | 0.8 (0.0–3.1) | 1.8 (0.3–5.9) | 0.3 (0.05–4.4) |
| G | 10.4 (0.2–102.9) | 60.1 (1.4–150.0) | 5.3 (0.1–11.9) | 17.3 (3.3–42.7) | 0.2 (0.0–4.6) |
| Ha | 1.8 (0.0–10.2) | 15.4 (30.0–37.9) | 4.4 (0.9–10.3) | 7.6 (4.0–12.0) | 0.0 (0.0–0.6) |
| I | 0.0 (0.0–2.1) | 0.6 (0.0–40.3) | 0.3 (0.0–26.8) | 0.6 (0.1–35.1) | 0.0 (0.0–0.0) |
| Overall | 4.5 (0.0–36.7) | 13.5 (0.0–132.4) | 1.2 (0.0–13.5) | 7.1 (0.2–35.6) | 0.2 (0.0–3.5) |
Median values are shown, with 10th and 90th percentiles in brackets, per country. TIDDDvet expresses the percentage of pigs that received a dose of antimicrobials each day or, equivalently, during which percentage of time a pig was treated with antimicrobials in a certain production phase or its entire life.
It should be taken into account that for the following farms the period for which the purchase of antimicrobials was reported was <6 months: country B (n = 2), country H (n = 4), country G (n = 11), country C (n = 17) and country I (n = 20).
For country H, antimicrobials administered through premedicated feed were not included in the purchase data, because the feed company could not exactly distinguish what proportion of feed was delivered to each specific farm.
Proportion (as a percentage) of amount of antimicrobials used as group treatment (based on TI with DDDvet values for a batch of fattening pigs observed from birth to slaughter) by antimicrobial class: total use, within-country and by age categorya
| Class | ATCvet code | Total | A | B | C | D | E | F | G | H | I | Suckler | Weaner | Finisher |
|---|---|---|---|---|---|---|---|---|---|---|---|---|---|---|
| Aminoglycosides | QJ01G | 1.3 | — | 2.3 (2) | 5.5 (3) | 1.2 (3) | — | — | 2.0 (5) | 0.7 (11) | 12.7 (2) | 50.5 | 44.7 | 4.8 |
| Amphenicols | QJ01BA | 0.4 | — | — | 0.01 (1) | 1.1 (13) | — | — | 0.1 (2) | 0.1 (5) | 12.3 (3) | 0.1 | 46.1 | 53.8 |
| Cephalosporins | QJ51DD | 4.4 | 3.5 (2) | 1.0 (3) | — | 10.2 (12) | — | — | 7.4 (2) | 1.9 (5) | 0.9 (3) | 93.5 | 5.9 | 0.6 |
| QJ51DE | ||||||||||||||
| Fluoroquinolonesb | QJ01MA | 1.3 | — | 3.4 (5) | — | 2.3 (10) | — | — | 1.9 (5) | 0.5 (16) | 11.0 (2) | 66.6 | 13.6 | 19.8 |
| QJ01MB | ||||||||||||||
| Linco & spec | QJ01FF52 | 0.2 | 0.9 (2) | — | 1.2 (4) | 0.002 (1) | 2.0 (1) | — | 0.005 (1) | — | — | 13.1 | 82.4 | 4.5 |
| Lincosamides | QJ01FF02 | 2.1 | — | 1.1 (1) | 0.5 (5) | 6.7 (5) | — | — | — | 0.9 (6) | 6.2 (2) | — | 67.2 | 32.8 |
| Macrolides | QJ01FA | 9.7 | 2.5 (4) | 16.1 (9) | 26.5 (12) | 6.1 (15) | 20.7 (5) | — | 21.7 (8) | 6.5 (20) | 0.6 (2) | 30.3 | 55.5 | 14.2 |
| Penicillins (β-lactamase-sensitive) | QJ01CE | 2.2 | 0.9 (2) | 0.5 (3) | 8.9 (12) | 0.02 (3) | — | — | 12.6 (11) | 0.6 (11) | — | 84.6 | 11.5 | 3.9 |
| Penicillins (extended-spectrum) | QJ01CA | 31.2 | 57.7 (17) | 46.9 (15) | 20.6 (16) | 27.3 (20) | 22.9 (10) | 50.8 (3) | 25.9 (17) | 27.0 (16) | 4.5 (4) | 29.3 | 66.6 | 4.0 |
| Pleuromutilins | QJ01XQ | 4.5 | — | — | 7.3 (6) | 2.6 (6) | — | — | 2.1 (8) | 8.9 (13) | 0.9 (1) | 2.8 | 87.5 | 9.6 |
| Polymyxins | QJ01XB | 24.7 | 11.1 (6) | 15.0 (4) | 0.8 (2) | 32.6 (17) | 40.3 (11) | 26.7 (2) | 7.1 (6) | 31.5 (18) | 50.0 (3) | 7.9 | 89.2 | 2.9 |
| Sulphonamides | QJ01EQ | 0.3 | — | — | — | 1.5 (4) | — | — | — | — | — | 91.1 | 8.9 | — |
| Tetracyclines | QJ01AA | 15.3 | 12.2 (8) | 13.7 (4) | 24.5 (14) | 7.2 (13) | 10.8 (5) | 3.1 (2) | 18.3 (14) | 20.8 (14) | 0.9 (2) | 2.0 | 83.3 | 14.7 |
| Trim & sulfa | QJ01EW | 2.4 | 11.2 (7) | — | 4.3 (4) | 1.3 (4) | 3.4 (2) | 19.5 (3) | 0.9 (1) | 0.7 (5) | — | 10.2 | 66.0 | 23.9 |
Linco & spec, lincomycin and spectinomycin; Trim & sulfa, trimethoprim and sulphonamides.
The number of farms within a country using a specific antimicrobial class is shown in brackets.
Other quinolones (e.g. flumequine) consisted of 0.03% of the treatments and therefore they were included in the class of fluoroquinolones.
To obtain the total TI with respect to a categorical variable (e.g. country), all TIs for the different antimicrobials were summed within the respective category of this variable.
Statistical analysis
Since TIs deviated from normality, median results are reported together with 10th and 90th percentiles. Relative deviations between TIDDDvet and TIUDDvet [(TIDDDvet–TIUDDvet)/TIDDDvet] and between TIDCDvet and TIUCDvet [(TIDCDvet–TIUCDvet)/TIDCDvet] were calculated to explore to what extent UDDvet and UCDvet matched with DDDvet and DCDvet, respectively. Positive deviations indicated that a higher dose was used than defined by ESVAC. Associations between TIDDDvet and TIUDDvet and between TIDCDvet and TIUCDvet were estimated with Spearman correlation coefficients. Relationships between TIs for different age categories were compared by fitting Loess curves after TIDDDvet variables were log10-transformed to deal with the problem of a skewed distribution. Before transforming the data, a value of 1 was added to all observations to overcome the problem of zero use in a particular age category.8 The relationships between TIs of fattening pigs (sucklers, weaners and finishers) were based on group treatment data, while the relationship between TIs of sows and sucklers was based on purchase data. Cross-tabulation was used and graphs were prepared to visualize the results with R version 3.3.1 (https://cran.r-project.org).
Results
AMU quantification using TIDDDvet
Antimicrobials were administered as group treatments on 780 occasions by 159 farms, meaning that 21 farms (11.7%) did not report antimicrobial group treatments from birth to slaughter for the batch of pigs from which the data were collected (Table S4, Appendix D). The majority of the treatments were applied in the beginning of the rearing period, with peaks at week 1 (16.9%), week 4 (10.9%) and week 9 (7.3%) (Figure 1). Based on group treatment data, TI200 varied considerably between the samples of farms within a country (Figure 2, Table 1), with a median TI200 of 9.2 (10th–90th percentile: 0.0–46.6) and a maximum of 113.6. Regarding age categories, the highest AMU was observed in weaners (69.5% of total TIDDDvet), followed by sucklers (22.5% of total TIDDDvet) and finishers (8.0% of total TIDDDvet). This observation was also confirmed at the country level, except for country C, where AMU in sucklers was higher compared with weaners (Table S5, Appendix D).
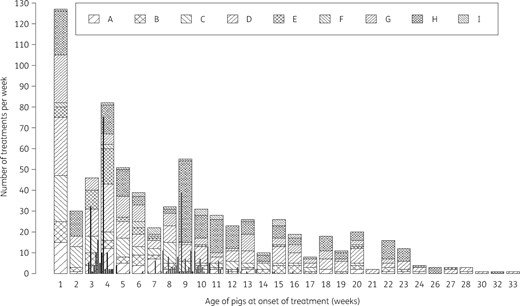
This histogram shows the number of antimicrobial group treatments per week applied to a batch of fattening pigs from birth to slaughter based on 750 treatments (30 instances of treatments missing). The stacked bars show the distribution of treatments between countries. The full black and grey lines denote the frequency distribution of the weaning age and the age of the weaners at transfer to the grow-finishing barns, respectively.
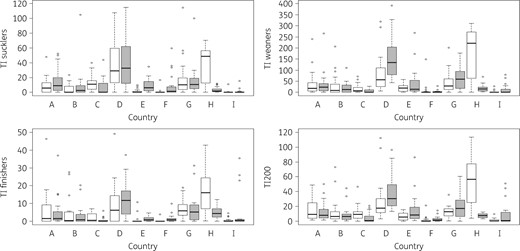
Country-level comparison of TI per 100 pig-days at risk between group treatment data (white boxplots) and purchase data (grey boxplots) for different age categories (sucklers, weaners and finishers) and combined for a standardized lifespan of 200 days (TI200) based on DDDvet. To enhance the comparison between the boxplots some outlying observations are not shown. The full black line within each boxplot represents the median. The whiskers (dashed lines) extend to the most extreme data point within the range of 1.5×IQR from the box. Outliers, data points outside the range of the whiskers, are shown as open circles. Group treatment data were obtained from a single batch of fattening pigs from birth to slaughter, while purchase data were data on antimicrobials purchased during 1 year. Whenever the period during which antimicrobials were purchased deviated from 1 year, the amount of antimicrobials purchased was corrected to 1 year. It should be taken into account that for the following farms the period for which the purchase of antimicrobials was reported was <6 months: country B (n = 2), country H (n = 4), country G (n = 11), country C (n = 17) and country I (n = 20). For country H, antimicrobials administered through premedicated feed were not included in the purchase data because the feed company could not exactly distinguish what proportion of feed was delivered to each specific farm.
Antimicrobial products were purchased by 168 farms, meaning that 12 (6.7%) farms did not report any purchased products during the year preceding the visit (Table S4, Appendix D). For 30% of the farms purchasing antimicrobial products, the period for which they reported to have purchased antimicrobials was less than 6 months. Furthermore, for 52 purchased products (3.1%), mainly from country F (n = 45), the age category for which the antimicrobial was purchased was missing and these missing values were imputed based on other observations for the same product and on the knowledge about the product.
Based on purchase data, the median TI200 was 7.1 (10th–90th percentile: 0.2–35.6), with a maximum TI200 of 96.4, and the median TI for sows was 0.2 (10th–90th percentile: 0.0–3.5) (Table 2). The highest TIs were observed in weaners for all countries, except for countries C and F, where AMU was the highest in sucklers.
For corresponding age categories [sucklers, weaners, finishers and from birth to slaughter (TI200)] only moderate correlations between group treatment and purchase data were observed for TIDDDvet and TIDCDvet, ranging from 0.39 to 0.50 (all P < 0.001). Removing the 43 farms for which the period they reported to have purchased antimicrobials was less than 6 months did not improve the associations (data not shown). A very large difference between group treatment and purchase data for country H was observed: antimicrobials administered through premedicated feed were not included in the purchase data because the feed company could not exactly distinguish what proportion of feed was delivered to each specific farm (Figure 2).
Relationship between indicators for AMU quantification
Overall a higher daily dose of antimicrobials was administered as group treatment to a batch of fattening pigs from birth to slaughter than doses defined by ESVAC: the median deviation for TI200 between TIDDDvet and TIUDDvet was 14% (10th–90th percentile: −37% to 45%) (Table 1). Except for country E, this median deviation was positive at the country level for all countries (Figure 3). Furthermore, the used course dose was in general higher than the defined course dose, with a median deviation between TIDCDvet and TIUCDvet of 25% (10th–90th percentile: −50% to 60%). Since the latter deviation was in general larger than the deviation between TIDDDvet and TIUDDvet, this indicates that besides the use of higher doses the duration of group treatments was also longer than recommended. This was also observed at the country level, since the median deviations between TIDCDvet and TIUCDvet were larger than between TIDDDvet and TIUDDvet for all countries, except for B, C and D. Regarding age categories, the largest deviations in used daily and course doses were observed for sucklers and weaners (Tables S5 and S6, Appendix D). Despite large deviations between different indicators for AMU quantification, results were highly correlated at the farm level, with Spearman correlation coefficients of 0.91 or higher (all P < 0.001). TIDCDvet results for purchase data are presented in Table S7 (Appendix D).
![Country-level overview of the relative deviation between TIs calculated with DDDvet, UDDvet, DCDvet or UCDvet based on group treatment data from birth to slaughter (TI200) for a batch of fattening pigs. TI200DDDvet and TI200UDDvet express the percentage of pigs that received a dose of antimicrobials each day, or equivalently, during which percentage of time a pig was treated with antimicrobials in its entire life. The left plot compares TI200DDDvet and TI200UDDvet [(TI200DDDvet–TI200UDDvet)/TI200DDDvet] and the right plot compares TI200DCDvet and TI200UCDvet [(TIDCDvet–TIUCDvet)/TIDCDvet]. A positive deviation indicates that a higher dose was used than defined by ESVAC. To enhance the comparison between the boxplots some outlying observations are not shown. The full black horizontal line at 0% represents no deviation between TIs. The full black line within each box plot represents the median. The whiskers of each box plot (dashed lines) extend to the most extreme data point within the range of 1.5×IQR from the box. Outliers, data points outside the range of the whiskers, are shown as open circles.](https://oup.silverchair-cdn.com/oup/backfile/Content_public/Journal/jac/74/3/10.1093_jac_dky503/1/m_dky503f3.jpeg?Expires=1750473321&Signature=AhWlbsVqK1VnAYAvtQ9AmDgxV8s8YsUwDHaBqz0PgUSRRenbmrJAvVnQqNLJs~ba6WanAjrYafBur-fnWs77ZCc~uhHdvqyjNp4vUmfHqs9yn-rQ1Ez4K9maFXKjyqmxugTJzs6E2vJdpuQFlPBkGuyXB-teEh5O6nsdny7oy0kDEVIbtts9Nmrj~IJgTblMs7CrJnrRTE-nUHYy99QXgURtNFNE2u43DxxRNawF4~csBwgGwhaMtfm39nK7qdn4spV2Kjk25-VrpPbXV-YWYRPduqtWJPB~z7D7dWzNnaZBTpaBV0KVVB05714H6apuJrUG4me3EERGVPsWrLfCAA__&Key-Pair-Id=APKAIE5G5CRDK6RD3PGA)
Country-level overview of the relative deviation between TIs calculated with DDDvet, UDDvet, DCDvet or UCDvet based on group treatment data from birth to slaughter (TI200) for a batch of fattening pigs. TI200DDDvet and TI200UDDvet express the percentage of pigs that received a dose of antimicrobials each day, or equivalently, during which percentage of time a pig was treated with antimicrobials in its entire life. The left plot compares TI200DDDvet and TI200UDDvet [(TI200DDDvet–TI200UDDvet)/TI200DDDvet] and the right plot compares TI200DCDvet and TI200UCDvet [(TIDCDvet–TIUCDvet)/TIDCDvet]. A positive deviation indicates that a higher dose was used than defined by ESVAC. To enhance the comparison between the boxplots some outlying observations are not shown. The full black horizontal line at 0% represents no deviation between TIs. The full black line within each box plot represents the median. The whiskers of each box plot (dashed lines) extend to the most extreme data point within the range of 1.5×IQR from the box. Outliers, data points outside the range of the whiskers, are shown as open circles.
Positive associations between age categories were noticed, indicating that higher AMU at a young age was associated with higher use in older pigs (Figure 4). This was also reflected in Spearman correlation coefficients of 0.48 (sows–sucklers), 0.46 (sucklers–weaners), 0.47 (sucklers–finishers) and 0.37 (weaners–finishers) for the relationship between TIs.
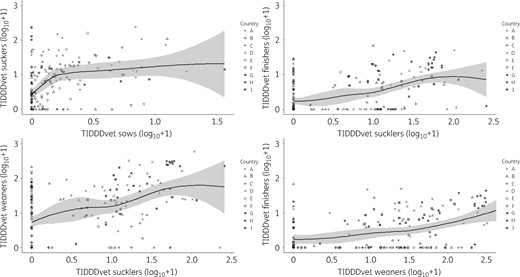
After log10 transformation of TIs based on DDDvet values, Loess curves (with 95% confidence band) were fitted between different age categories (sucklers, weaners, finishers and sows). TIDDDvet expresses the percentage of pigs that received a dose of antimicrobials each day or, equivalently, during which percentage of time a pig was treated with antimicrobials in a certain production phase or its entire life. The relationships between TIs of fattening pigs (sucklers, weaners and finishers) were based on group treatment data, while the relationship between TIs of sows and sucklers was based on purchase data. Each farm is represented with a point, the shape of which denotes the country where the sampled farm was from. The figure shows positive associations between TIs in different age categories.
Qualitative results on group treatment data
Based on TIDDDvet, the majority of the antimicrobials were administered through feed or water (82%), 18% were administered parenterally and only 0.007% consisted of topical treatments. Considerable differences between countries were observed regarding the administration route: country C administered most of the antimicrobials parenterally (59%), followed by countries G (36%), D (22%), B (18%), I (19%), A (12%), E (11%), F (9%) and H (7%). In terms of TIDDDvet, 61% of the treatments of sucklers were parenteral, while the majority of the treatments of weaners and finishers were oral (95% and 90%, respectively).
The average treatment duration for parenterally administered antimicrobials was 2.6 days (minimum 1; median 3; maximum 14) for non-LA formulations and 5.2 days (1.8; 5; 28) for LA formulations, while for oral treatments this was 10.6 days on average (1; 7; 80) and 2.2 days (1; 1; 5) for topical treatments. Moreover, 10% of the oral treatments were applied for a period of at least 21 consecutive days.
In terms of TIDDDvet, extended-spectrum penicillins (31.2%) and polymyxins (24.7%) were the most frequently used antimicrobial classes, followed by tetracyclines (15.3%) and macrolides (9.7%) (Table 3). Extended-spectrum penicillins, polymyxins and tetracyclines were mainly used for weaners, while cephalosporins, fluoroquinolones and β-lactamase-sensitive penicillins were more frequently administered to sucklers.
The most frequent indications for treatment were general (37.5%), intestinal (24.4%) and respiratory disorders (20.1%). Less frequently reported indications for treatment were locomotor (4.4%), nervous (8.1%), dermatological (0.8%) and other disorders (4.8%) (Table S8, Appendix D).
Discussion
With a standardized methodology at the farm level this study gained more insight into the AMU patterns of 180 farrow-to-finish farms in nine countries. Given the fact that the 20 sampled farms in each country were not necessarily representative for that country, the results do not necessarily give a good description of country-level AMU, but rather a detailed description of farm-level AMU taking into account variation throughout nine European countries. This study was able to confirm on a larger scale the main findings of Sjölund et al.8, i.e. large differences in AMU between farms and age groups; mainly oral administration; positive associations between age categories; and considerable use of highest priority critically important antimicrobials for human medicine (HPCIAs). Furthermore, by collecting detailed data on antimicrobial group treatments to a batch of fattening pigs, additional results were obtained, such as the moment and duration of treatment and used daily and course doses.
Only moderate correlations in TIs between the group treatment and purchase data were observed. The group treatment data covered only a single batch and might therefore under- or over-estimate AMU due to seasonal influences in the occurrence of clinical diseases, or due to incidental disease episodes.8 They may also be influenced by recall bias with respect to the truly administered products. The latter is why individual treatments were not included, as these are even more prone to recall bias as they are often not well recorded.17 It is described that the majority of antimicrobial treatments in pig production are group treatments.17,21 Purchase data were presumed to provide a more robust overview of the actual use, since they covered multiple batches and included individual treatments. Yet, for each type of data, challenges in data collection were encountered that might influence data quality. For group treatment data, farmers had to make a good estimation of the live weight at treatment. Furthermore, for 20% of the treatments, assumptions had to be made on daily feed and water intake, since doses were expressed per amount of feed or water. For purchase data, the exact moment of AMU is not known and standard live weights were therefore used. When an antimicrobial was purchased for multiple age categories, assumptions had to be made with respect to what proportion of the antimicrobial was used in each age group. This could result in an under- or over-estimation of AMU in a specific age group. Moreover, 30% of the farms were only able to report purchase data for a period up to 6 months and in country H the feed company could not exactly distinguish what proportion of feed was delivered to each specific farm. From this study it became clear that collecting good quality farm-level AMU data is challenging and shows the need for user-friendly data collection systems.15,22
When comparing used daily and course doses with defined doses, very strong correlations at the farm level were observed. Nonetheless, considerable deviations between the used and defined doses were present. Firstly, UDDvet values were generally higher than DDDvet values. Although DDDvet values were not specifically developed to describe under- or overdosing, the deviations suggest that either the administered doses were too high or the DDDvet values are set too low. The latter are based on detailed dosing data from only nine European Union Member States19 and might therefore not cover all variability in suggested doses of antimicrobial products. In a study where defined doses were assigned in four countries, considerable deviations from the consensus defined dose were observed for individual products with the same active substance and administration route.20 Secondly, UCDvet values were generally higher than DCDvet values with larger deviations compared with the daily doses. Together with the observation that 10% of the oral group treatments were applied for a period of at least 21 consecutive days, this suggests that the group treatments were often administered for too long a period in this study. Therefore, an important step towards reducing AMU is to comply with the recommended daily dose and treatment duration.23
Peaks in frequency of treatment were observed during weeks 1, 4 and 9 of the rearing period. As argued by Sjölund et al.8, these results strongly suggest that it is common practice in many pig farms to apply treatments to entire batches of pigs at strategic timepoints when pigs are judged most likely to become infected, i.e. at birth and castration (week 1), at weaning (week 4) and at the start of the finishing period (week 9). Moreover, in accordance with Sjölund et al.,8 results indicated that higher AMU at a young age was associated with higher use in older pigs. Possible reasons for these associations are the attitude of the farmer,24,25 the overall higher disease pressure in some farms8 and the higher disease susceptibility following the effect of AMU at a young age on the bacterial composition.26 Therefore, reducing AMU should already start at a young age (sucklers), even if the total amount used at this stage is still limited, as this AMU seems to affect AMU in the consecutive rearing periods (weaners and finishers).10 In a recent study the restriction of prophylactic use in weaners by removing antimicrobials from the feed had minimal effects on health and welfare indicators.27
The majority of antimicrobial group treatments were administered orally, although considerable differences at the country level were observed. Only in country C were the majority of the treatments applied parenterally (59%), while only 7% of the treatments were parenteral in country H. It has been argued that the predominant route of administration also influences the average AMU levels.8 Oral administration of antimicrobials is likely more easily applied to entire batches compared with parenteral treatments and therefore have a larger impact on AMU, while parenteral administrations allow for more flexible and targeted treatment of diseased animals. Furthermore, in the present study, oral treatments were generally applied for longer compared with parenteral treatments. Finally, studies showed that for some antimicrobials and bacteria, oral administration of antimicrobials selected for AMR to a greater extent compared with parenteral treatments,28,29 while others observed no significant difference between administration routes with respect to resistance.30 More research has been suggested to elucidate the potential effect of the administration route on resistance.31 Another factor towards more responsible AMU could therefore be the consideration of parenteral treatment of individuals rather than oral treatment of an entire batch, whenever possible.10
In this study, colistin (polymyxins) was frequently used in weaned piglets. However, polymyxins have recently been added to the list of HPCIAs32 and the use of such antimicrobials in food-producing animals is discouraged.10 Also, macrolides, the fourth most frequently used class in this study, belong to the HPCIA for human medicine list, according to WHO, when considering action on AMU in food-producing animals.10,32 The use of other HPCIAs such as third- and fourth-generation cephalosporins and fluoroquinolones was relatively low. WHO recommends that HPCIAs should only be used for treatment of refractory infections in food-producing animals, based on veterinary diagnosis and bacterial cultivation and susceptibility results,10 whereas the European Parliament has asked in a recent resolution for a ban on the veterinary use of antimicrobials that are critical for preventing or treating life-threatening infections in humans.33
The fact that no group treatments were reported in 11.7% of the farms, for the studied batch, showed that it is possible to rear pigs without systematic use of antimicrobials. Furthermore, there was at least one farm in each participating country that did not report group treatments in either sucklers, weaners or finishers during the observed rearing period. However, the large variation in quantitative and qualitative AMU between farms shows that there is still room for improvement towards responsible AMU. For instance, as mentioned above, one could reduce AMU at strategic timepoints in combination with increased biosecurity34,35 and restrict the use of HPCIAs. Further research is needed to explore what the main drivers for AMU are.
Acknowledgements
We thank all researchers who visited the farms to collect the data and samples (other than those listed below as EFFORT consortium members): K. L. Nielsen, B. E. Hoelstad, P. Ryt-Hansen, C. Nielsen, M. Brunon, B. Gawlik, E. Guyrova, N. Cholakov, T. Ivanova, M. Gherpelli and V. Carfora.
The farmers and their herd veterinarians are acknowledged for their participation in the study.
Members of the EFFORT consortium
J. Wagenaar (UUVM), H. Graveland (UUVM), D. Heederik (UUVM), H. Schmitt (UUVM), R. Luiken (UUVM), L. Van Gompel (UUVM), D. Mevius (UUVM), A. van Essen (WBVR), B. Gonzalez-Zorn (UCM), G. Moyano (UCM), P. Sanders (ANSES), C. Chauvin (ANSES), J. David (ANSES), A. Battisti (IZSLT), A. Caprioli (IZSLT), J. Dewulf (UGent), T. Blaha (TIHO), K. Wadepohl (TIHO), M. Brandt (TIHO), F. Aarestrup (DTU), T. Hald (DTU), S. Duarte (DTU), D. Wasyl (NVRI), D. Krasucka (NVRI), B. Biernacki (NVRI), J. Szumiło (NVRI), H. Daskalov (NDRVI), H. Saatkamp (BEC) and K. Stärk (SAFOSO).
Funding
This work was supported by the by the European Commission under the Food, Agriculture and Fisheries, and Biotechnologies theme of the 7th Framework Programme for Research and Technological Development (Grant Agreement FP7-KBBE-2013–7-613754-EFFORT).
Transparency declarations
None to declare.
References
World Health Organization (WHO). Global Action Plan on Antimicrobial Resistance.
World Organisation for Animal Health (OIE). Final Report—83rd General Session.
Food and Agriculture Organization (FAO). Report of the Conference of FAO—Thirty-Ninth Session.
Joint Interagency Antimicrobial Consumption and Resistance Analysis (JIACRA).
World Organisation for Animal Health (OIE). Terrestrial Animal Health Code, Chapter 6.8: Monitoring of the Quantities and Usage Patterns of Antimicrobial Agents Used in Food-Producing Animals.
World Health Organization (WHO). WHO Guidelines on Use of Medically Important Antimicrobials in Food-Producing Animals.
European Medicines Agency (EMA). Sales of Veterinary Antimicrobial Agents in 30 European Countries in 2015.
The Danish Integrated Antimicrobial Resistance Monitoring and Research Programme (DANMAP). DANMAP 2013—Use of Antimicrobial Agents and Occurrence of Antimicrobial Resistance in Bacteria from Food Animals, Food and Humans in Denmark.
Monitoring of Antimicrobial Resistance and Antibiotic Usage in Animals in the Netherlands (MARAN). Monitoring of Antimicrobial Resistance and Antibiotic Usage in Animals in the Netherlands in 2016.
European Medicines Agency (EMA). Defined Daily Doses for Animals (DDDvet) and Defined Course Doses for Animals (DCDvet).
Network on Quantification of Veterinary Antimicrobial Usage at Herd Level and Analysis, Communication and Benchmarking to Improve Responsible Usage (AACTING). Guidelines for Collection, Analysis and Reporting of Farm-Level AMU, in the Scope of Antimicrobial Stewardship.
European Commission Notice.
World Health Organization (WHO). Critically Important Antimicrobials for Human Medicine—5th Revision 2016.
European Parliament. Resolution of 13 September 2018 on a European One Health Action Plan against Antimicrobial Resistance.
Author notes
Members are listed in the Acknowledgements section.
