


Abstract
Objectives: In Denmark, general practice is responsible for 75% of antibiotic prescribing in the primary care sector. We aimed to identify practice-related factors associated with high prescribers, including prescribers of critically important antibiotics as defined by WHO, after accounting for case mix by practice.
Methods: We performed a nationwide register-based survey of antibiotic prescribing in Danish general practice from 2012 to 2013. The unit of analysis was the individual practice. We used multivariable regression analyses and an assessment of relative importance to identify practice-related factors driving high antibiotic prescribing rates.
Results: We included 98% of general practices in Denmark (n = 1962) and identified a 10% group of high prescribers who accounted for 15% of total antibiotic prescriptions and 18% of critically important antibiotic prescriptions. Once case mix had been accounted for, the following practice-related factors were associated with being a high prescriber: lack of access to diagnostic tests in practice (C-reactive protein and urine culture); high use of diagnostic tests (urine culture and strep A throat test); a low percentage of antibiotic prescriptions issued over the phone compared with all antibiotic prescriptions; and a high number of consultations per 1000 patients. We also found that a low number of consultations per 1000 patients was associated with a reduced likelihood of being a high prescriber of antibiotics.
Conclusions: An apparent underuse or overuse of diagnostic tests in general practice as well as organizational factors were associated with high-prescribing practices. Furthermore, the choice of antibiotic type seemed less rational among high prescribers.
Introduction
The increasing prevalence of antibiotic resistance is regarded as a major public health concern by WHO1 and efforts to reduce antibiotic consumption are urgently needed to alleviate the associated immediate and long-term health problems.2–4
In Europe the majority of antibiotics are prescribed in the primary health care sector,5 and in Denmark general practice accounts for 75% of antibiotic prescribing in primary care.6 This equates to 425 prescriptions per 1000 inhabitants per year.6 By comparison, in a similar country, such as Sweden, general practice issues 390 prescriptions per 1000 inhabitants per year.7,8 A reduction in antibiotic use is theoretically possible as evidence suggests that immediate antibiotic treatment is not beneficial for the majority of patients who present with an acute infection in primary care.9,10
A Danish study11 from 1997 reported that the most liberal general practitioner (GP) issued 15 times as many prescriptions for antibiotics per patient as the most restrictive GP. Some degree of variation between practices is expected and explainable as case mix may vary substantially between GP clinics.12 Studies have identified several factors linked to high-volume prescribing of antibiotics in general practice, including patient-related factors (age, gender, comorbidities, smoking, zero tolerance of sickness, anxiety regarding serious illness, geographic location), and societal factors (pay for service, sick leave notes, social inequality).11,13–17 However, even after adjustment for case mix there may still be variation between practices over and above what might be expected. This excess variation could be explained by practice-related factors that are characteristic of high-prescribing practices and which, in turn, could point to ways of improving antibiotic stewardship in general practice.
Total antibiotic use and, specifically, use of non-recommended antibiotic agents such as macrolides, fluoroquinolones and third- and fourth- generation cephalosporins, i.e. critically important antibiotics,18,19 are important targets for interventions to reduce inappropriate prescribing among all GPs. Moreover, high prescribers may also constitute a specific risk group with regard to sub-optimal quality of treatment.
Using nationwide registry data, we set out to identify practice-related factors associated with high antibiotic prescribing rates and high prescribing rates for critically important antibiotics after accounting for case mix.
Methods
Data sources and variables
Antibiotic use
Outcome variables included the number of antibiotic prescriptions issued per 1000 patients per practice per year (as well as critically important antibiotics of the highest priority). We used this outcome to subsequently determine a dichotomized variable identifying high prescribers after accounting for case mix (see below for details).
Antibiotic prescribing by practice was obtained from the Danish National Prescription Registry.20 Data included all Danish citizens who had redeemed an electronic antibiotic prescription coded J01 under the Anatomical Therapeutic Chemical Classification System (ATC). The period from 1 July 2012 to 30 June 2013 was chosen to include an entire winter season.6 The critically important antibiotics included in our analysis were defined by WHO as of the highest priority and included macrolides and fluoroquinolones as well as third- and fourth-generation cephalosporins.18
Patient-related factors (case mix)
We also used the Danish National Prescription Registry to calculate the percentages of patients with selected chronic diseases per practice based on their exposure to specific medications the previous year:21 diabetes (ATC A10; antidiabetic drugs); heart failure (ATC C03C; high-ceiling diuretics); obstructive lung disease (ATC R03A + B; inhalants, adrenergics and other drugs); oral corticosteroid use (ATC H02AB; glucocorticoids) or multimorbidity (if two or more different ATC codes were present).
Registries from Statistics Denmark provided sociodemographic variables such as geographic location, educational status, unemployment, invalidity pensioners, family income, country of origin and patient gender and age. We accessed the National Patient Registry for information on duration of hospital stays in the previous year (Table S1).
Practice-related factors
We identified general practices by their unique code (encrypted) in the Danish National Provider Registry, in order to distinguish prescriptions issued by GPs from those issued by other medical providers in the primary care sector.6 The unit of analysis in our study was the individual practice. All Danes are eligible to register with a GP, and ∼98% of the population is listed with a general practice.22 In general, Danish GPs are required to be open for enrolment of a minimum of 1600 patients. Newly opened practices and practices that are closing may have fewer patients and we excluded practices with <500 patients as we regarded them as non-representative.
The following practice-related factors were included in the study (Table S2). We classified practices as single-handed practices if they had only one established GP. The remaining practices were categorized as group practices. Training practices were identified by specific codes pertaining to junior doctors in residency. We calculated provider age as the mean age of the providers in group practices. Gender was reported as ‘male’, ‘female’ or, if different genders were working together in a practice, ‘mixed’. We conceptualized a practice’s workload (business) using two variables: the number of listed patients per doctor and the number of consultations per listed patient in the practice. A prescription over the phone was assumed if only a telephone contact was registered during the week an antibiotic prescription was redeemed.
From the National Health Insurance Service Registry, we obtained information on billing according to the Danish fee for services principle20 to assess the use of diagnostic tools in the practice, such as C-reactive protein (CRP), urine culture, streptococcal rapid antigen detection test (strep A throat test), microscopy and tympanometry. From this registry, we were only able to determine whether a diagnostic test was used in the consultation; we did not have access to the results of any test performed.
For each practice, we calculated the percentages of diagnostic tests used in the specific practice population: CRP, tympanometry, strep A throat test, urine dipstick, leucocyte tests, urine culture in practice, susceptibility testing of uropathogens and urine microscopy. We categorized variables for point-of-care diagnostics, prescriptions over the phone and number of consultations per patient into low (first quartile), moderate (second and third quartiles) and high (fourth quartile). We included moderate use as the reference category in the analyses. A fourth category (missing) was added if >50 practices had missing data for a variable (i.e. practices did not have access to or did not use that particular test).
Patient and practice-related variables are provided in Tables S1 and S2 (available as Supplementary data at JAC Online).
Analyses
We performed the main multivariable analysis in three steps.
First, we analysed antibiotic prescribing in each practice, adjusting for the composition of the population in each practice (case mix): age, sex, chronic diseases, hospital admissions in the previous year, sociodemographics and geographic location (Table S1).
In the second step we analysed the residuals from the first model (i.e. the variation that was not explained by case mix). We plotted these residuals in a normal quantile–quantile (Q–Q) plot and identified high prescribers as deviating from the right tail of the normal distribution.
Finally, we constructed a logistic regression model to analyse covariates related to practices (practice-related factors) that were associated with high prescribing practices: GP age, GP gender, practice type, teaching practice, antibiotic prescriptions over the phone, workload factors, and access to and use of diagnostic tests (Table S2).
Our primary analysis was based on an assessment of the relative importance of the covariates in step (iii) (e.g. the percentage of the variance in the model that could be attributed to each practice-related factor). This was assessed as the mean increase in pseudo-R2 (McFadden), calculated for each individual factor by repeatedly adding factors across all multivariable regression models that could be constructed from the included factors.21–23 The most important factors (i.e. factors that accounted for the highest proportions of the predicted variance) were used in a final logistic regression model to assess the direction and statistical significance of the associations.
Analyses were performed in SAS version 9.4 and the R environment for statistical computing.
Ethics
The study was approved by the Danish Data Protection Agency (J.nr. 2012–41-0159). According to Danish law no approval from an ethics committee is required for strictly registry-based studies.
Results
Variation in antibiotic prescribing
A total of 1962 general practices, equivalent to 98% of Danish GP practices, representing 3455 GPs, were included in the analysis (Table 1). We excluded 43 practices due to small size (<500 listed patients). There was a 2.5-fold difference in the crude antibiotic prescribing volumes between practices in the 10th and 90th percentiles (259 versus 644 prescriptions per 1000 patients per practice per year). For critically important antibiotics this increased to a >4-fold difference (36 versus 157 prescriptions per 1000 patients per practice per year).
Selected characteristics of patient- and practice-related factors, including chronic medicine use, demographic data and diagnostic tests performed in practice; n = 1962 practices
| Characteristic | |
|---|---|
| Patient-related factors, mean percentage of patients in practice (SD) | |
| children <5 years | 5 (2) |
| older adults >65 years | 17 (6) |
| elderly >85 years | 2 (1) |
| female | 50 (7) |
| medicine usea | |
| insulin | 1 (0.4) |
| insulin or metformin | 4 (1) |
| thiotropium bromide | 1 (0.6) |
| any inhalant | 6 (2) |
| furosemide | 3 (1) |
| corticosteroid use (oral) | 2 (1) |
| ≥2 of above medicines | 2 (1) |
| Practice-related factors | |
| single-handed practices, number (%) of practices | 1210 (62) |
| group practices, number (%) of practices | 752 (38) |
| female GP-only practices, number (%) of practices | 542 (28) |
| male GP-only practices, number (%) of practices | 915 (47) |
| mixed GP practices, number (%) of practices | 505 (25) |
| training practices, number (%) of practices | 81 (4) |
| GP age (years), mean (SD) | 54 (12) |
| patient list size per GP, mean (SD) | 1644 (353) |
| telephone prescriptionsb/1000 patients, mean (SD) | 80 (4) |
| consultation rate/1000 patients, mean (SD) | 328 (70) |
| antibiotic prescriptions (number/1000 patients/year), mean (SD) | |
| any antibiotic | 435 (177) |
| critically important antibioticsc | 87 (58) |
| diagnostic testsd (number/1000 patients/year), mean (SD) | |
| CRP test | 240 (140) |
| leucocyte differential count | 190 (190) |
| strep A throat test | 80 (50) |
| tympanometry | 30 (30) |
| urine dipstick | 210 (100) |
| microscopy of urine | 100 (80) |
| urine culture (performed in practice) | 90 (70) |
| susceptibility testing (performed in practice) | 100 (70) |
Number of practices with missing (lack of access to or use of) diagnostic tests: CRP, 133; leucocyte differential count, 1538; strep A throat test, 9; tympanometry, 672; urine dipstick, 0; microscopy of urine, 930; urine culture, 332; susceptibility testing, 301.
Percentage of registered practice population that redeemed selected medications the previous year.
Percentage prescriptions over the phone out of total antibiotic prescriptions in practice.
Highest priority18 (macrolides, fluoroquinolones and third- and fourth- generation cephalosporins).
Percentage of diagnostic test use out of listed practice population.
Identification and quantification of high prescribers
Visual inspection of the Q–Q plot did not identify any practices with exceptionally low antibiotic prescribing rates. On the contrary, 10% of practices were classified as high prescribers when the number of antibiotic prescriptions increased to >155 above the expected number for a practice with a similar case mix per 1000 patients per practice per year (Figure 1). This figure roughly corresponds to one additional antibiotic prescription per work day than might be expected for an average GP with a similar case mix.
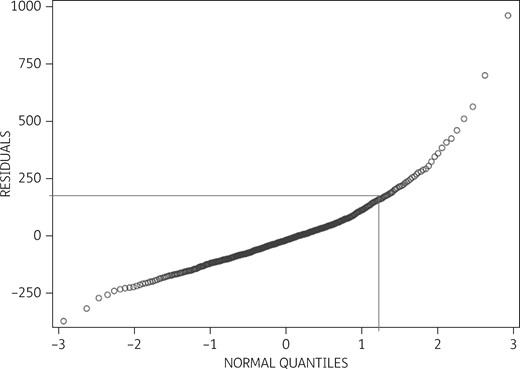
Q–Q plot of the residuals between actual and expected antibiotic prescribing after adjustment for case mix. The y-axis represents estimated residuals of the 1962 practices’ antibiotic prescribing per 1000 patients per year. The x-axis denotes the theoretical normal distribution. Ten percent of high prescribers issued more than 155 prescriptions per 1000 patients per year above the estimated average for practices with a similar case mix. Due to Danish data regulations, the presented graph depicts mean values from merged groups of five practices and as such may deviate slightly from the original.
This high-prescribing group of GPs served 9% of the Danish population but was responsible for 15% of the total antibiotic prescriptions from general practice, and the proportion of critically important antibiotics attributable to this group was 18%.
Practice-related determinants of high-volume antibiotic prescribing
Being a high prescriber in the full model, including all covariables, was associated with lack of access to the CRP test, low use (first quartile) of leucocyte differential count, high use (fourth quartile) of strep A throat tests and a low percentage of antibiotic prescriptions issued over the phone, as well as increasing GP age. A low number of consultations per 1000 patients decreased the likelihood of being a high prescriber, as did all-female GP practices (Table 2).
Multivariable logistic regression analyses after adjusting for case mix (full model and reduced model based on relative importance analysis; top five factors accounted for 63% of variation)
| Variable | Univariable OR (95% CI) | Full model OR (95% CI) | Reduced (relative importance analysis) model OR (95% CI) | |
|---|---|---|---|---|
| Female practice | 0.5 (0.4–0.7) | 0.6 (0.4–0.9) | not included | |
| Mixed practice | 0.5 (0.3–0.7) | 0.8 (0.4–1.6) | not included | |
| GP age increase by 10 years | 1.2 (1.1–1.4) | 1.2 (1.03–1.4) | not included | |
| Single-handed practice | 1.8 (1.3–2.5) | 1.2 (0.7–2.1) | not included | |
| List size increase by 1000 patients | 0.8 (0.5–1.2) | 0.8 (0.5–1.3) | not included | |
| Teaching practice | 0.9 (0.4–1.9) | 0.6 (0.2–1.4) | not included | |
| Number of consultations per patient | first quartile | 0.6 (0.3–0.9) | 0.5 (0.3–0.8) | 0.5 (0.3–0.7) |
| fourth quartile | 2.3 (1.8–3.7) | 1.3 (0.9–1.9) | 1.4 (1.02–2.0) | |
| Percentage of phone prescriptionsa | first quartile | 1.8 (1.3–2.6) | 1.8 (1.3–2.6) | |
| fourth quartile | 0.7 (0.5–1.1) | 0.9 (0.6–1.4) | ||
| Strep A throat test | first quartile | 1.2 (0.8–1.7) | 0.9 (0.6–1.4) | 1.1 (0.8–1.7) |
| fourth quartile | 2.8 (2.0–3.9) | 2.2 (1.5–3.1) | 2.3 (1.6–3.2) | |
| CRP test | missing | 2.6 (1.6–4.3) | 2.4 (1.3–4.4) | 3.7 (2.1–6.6) |
| first quartile | 1.1 (0.7–1.6) | 1.3 (0.8–2.0) | 1.5 (0.9–2.2) | |
| fourth quartile | 1.9 (1.3–2.7) | 1.2 (0.8–1.8) | 1.3 (0.9–1.8) | |
| Leucocyte differential count | missing | 1.0 (0.6–1.7) | 0.9 (0.6–1.6) | not included |
| first quartile | 2.2 (2.2–4.3) | 2.2 (1.1–4.7) | ||
| fourth quartile | 1.8 (0.9–3.7) | 1.5 (0.7–3.3) | ||
| Urine culture | missing | 1.7 (1.1–2.6) | 1.6 (0.9–2.7) | 1.7 (1.1–2.6) |
| first quartile | 1.4 (0.9–2.1) | 1.5 (0.9–2.4) | 1.4 (0.9–2.2) | |
| fourth quartile | 2.2 (1.5–3.3) | 1.5 (0.8–2.7) | 1.7 (1.1–2.5) | |
| Urine dipstick | first quartile | 0.8 (0.6–1.2) | 1.1 (0.7–1.9) | not included |
| fourth quartile | 1.3 (0.9–1.8) | 0.8 (0.6–1.2) | ||
| Susceptibility testing (uropathogens) | missing | 1.4 (0.9–2.1) | 0.9 (0.5–1.6) | not included |
| first quartile | 0.8 (0.5–1.3) | 0.8 (0.5–1.4) | ||
| fourth quartile | 1.9 (1.3–2.8) | 1.1 (0.6–1.9) | ||
| Microscopy (urine) | missing | 2.3 (1.5–3.5) | 1.2 (0.8–2.0) | not included |
| first quartile | 1.6 (0.9–2.9) | 1.2 (0.7–2.3) | ||
| fourth quartile | 2.0 (1.2–3.4) | 1.3 (0.7–2.3) | ||
| Tympanometry for otitis media | missing | 1.8 (1.3–2.6) | 1.5 (1.0–2.4) | not included |
| first quartile | 1.0 (0.6–1.7) | 1.6 (0.9–2.8) | ||
| fourth quartile | 1.0 (0.6–1.7) | 1.3 (0.7–2.3) | ||
Percentage of prescriptions over the phone out of total antibiotic prescriptions in practice.
In the analysis of relative importance, we found that five variables explained 63% of the predicted variation: strep A throat test (17%); percentage of antibiotic prescriptions over the phone out of the total antibiotic prescriptions in practice (15%); the number of consultations per patient in practice (15%); CRP (9%); and urine culture (8%). Additional factors explained <6% each (Table 3).
Relative importance model estimating the degree of variation in antibiotic prescribing attributable to included practice-related factors
| Variable | Percentage relative importance |
|---|---|
| Practice gender | 4.2 |
| GP age increase by 10 years | 5.5 |
| Single-handed practice | 2.1 |
| List size increase by 1000 patients | 1.4 |
| Teaching practice | 0.9 |
| Number of consultations per patient | 14.5 |
| Percentage of phone prescriptionsa | 14.6 |
| Strep A throat test | 17.1 |
| CRP test | 9.0 |
| Leucocyte differential count | 6.2 |
| Urine culture | 7.7 |
| Urine dipstick | 1.2 |
| Susceptibility testing (uropathogens) | 3.8 |
| Microscopy (urine) | 5.1 |
| Tympanometry for otitis media | 6.7 |
Percentage of prescriptions over the phone out of total antibiotic prescriptions in practice.
The reduced multivariable regression analysis with these five most important practice-related variables found that they were all associated with being a high prescriber. We observed a positive association for non-users of the CRP test; non-users as well as high users of urine culture; high users of strep A throat tests and a low percentage of antibiotic prescriptions issued over the phone out of total antibiotic prescriptions, as well as busy practices (i.e. a high number of consultations per 1000 patients). A low number of consultations per 1000 patients reduced the likelihood of being a high prescriber (Table 2).
High prescribers of antibiotics were also most likely to be high prescribers of critically important antibiotics of the highest priority (macrolides, fluoroquinolones and cephalosporins) (OR = 14.3, 95% CI 9.7–20.9). Apart from this important factor, lack of access to or use of tympanometry (OR = 2.2, 95% CI 1.3–3.5), high use (fourth quartile) of susceptibility testing for uropathogens (OR = 1.9, 95% CI 1.02–3.5) and GP age (OR = 1.3, 95% CI 1.1–1.6) were independent factors associated with prescribing critically important antibiotics. A low use (first quartile) of susceptibility testing for uropathogens decreased the risk (OR = 0.5, 95% CI 0.3–0.99).
Discussion
By using nationwide routine data we have characterized high-volume antibiotic prescribers in Danish general practice, i.e. GPs who prescribed more antibiotics than might normally be expected from patient-related factors (case mix). Overall, antibiotic prescribing was not confined to a particular group that was responsible for a large part of total antibiotic prescriptions. Nevertheless, a 10% group of high prescribers issued >155 prescriptions per 1000 patients per year above what might be expected when adjusting for case mix. Furthermore, high prescribers also demonstrated a less rational choice of antibiotics, with more frequent use of critically important antibiotics of the highest priority, such as macrolides and fluoroquinolones.
Lack of access to or use of certain diagnostic tests in practice (CRP and urine culture) as well as high use of some diagnostic tests (urine culture and strep A throat test) were associated with high prescribing practices. This was also the case for organizational factors, such as a low percentage of antibiotic prescriptions issued over the phone and busy practices (i.e. a high number of consultations per 1000 patients). A low number of consultations per 1000 patients reduced the likelihood of being a high prescriber of antibiotics (Table 2). Our analysis of the relative importance or contribution of each variable to the predictable variance, considering both its unique contribution and its contribution when combined with other variables,21 found that GP gender, GP age and type of GP practice did not account for much of the variation in the model (Table 3).
Case mix factors were responsible for the bulk of the variation in the antibiotic prescribing rate between practices, and this was especially due to differences in the prevalence of comorbid conditions in the practice populations.12,13 Previous studies have reported the analysis of patient- and practice-related factors in one model, thereby introducing a risk of interaction, and they have not always been able to adjust for a similar number of patient-related factors.13,14 By taking patient factors into account, the present findings make a strong case for determining which practice-related factors are important for the excess prescribing of antibiotics. There was a high level of agreement between the full and the reduced version of the multivariable model, providing evidence that the findings are robust. These practice-related factors may serve as focal points for future interventions to promote a prudent and judicious antibiotic prescribing pattern.
Few previous studies have looked at a comparable set of practice-related factors including the use of diagnostic tools. This study identified relevant factors that may potentially be addressed if interventions targeting high prescribers of antibiotics in general practice are likely to be successful. These included the rational use of diagnostic tests, specifically CRP, urine culture and strep A throat tests.
The association between workload in practice and antibiotic prescriptions has previously been described using a proxy variable such as the number of patients listed in the practice.15,24 Many consultations per patient could indicate short appointments and it might be quicker for the GP to prescribe an antibiotic than to take the time to explain to the patient why they do not need an antibiotic for their current illness.13 However, studies have suggested that, in fact, no extra time is gained by opting for a prescription.25 Another explanation could be residual confounding from a population with a high degree of comorbidity, despite our attempts to account for these factors by case mix. Finally, doctors who have fewer consultations per patient may have developed a ‘GP prescribing style’12 that relies less on drug use, such as antibiotics.
As the Danish Health Authority26 recommends examining a patient prior to antibiotic prescribing, it was surprising to find that a low percentage of prescriptions over the phone was positively associated with high prescribers. A possible explanation could be that the denominator (total antibiotic use) grows markedly more than the numerator (prescriptions over the phone) among high-prescribing practices. Many practices have trained non-medical staff to attend to the phone, which could influence the use of antibiotics, e.g. how many patients are booked in for review and how many are managed over the phone. However, we were not able to control for this parameter.
A significant proportion of the high prescribers did not have access to CRP testing in their practice. Such a test, along with the correct instructions and education on its use, might reduce the number of prescriptions by ruling out a serious infection27,28 and should be considered in future interventions to promote rational antibiotic use in high-volume prescribers. Only 21% of the practices had access to leucocyte differential count at the point of care, and the use of this test being in the lowest quartile was associated with an increased likelihood of being a high prescriber. This could indicate a sub-optimal use of the test in this group of GPs.
Overdiagnosis and spectrum bias29 might occur when diagnostic tests are used too extensively and outside of the target group. Multiple testing will, independently of test method, increase the rate of positive findings, false as well as true. The high use of the strep A throat test and culture for urinary pathogens among high prescribers might indicate such a non-rational use of tests, resulting in a risk of overtreatment of sore throat and urinary tract infections. An older regional study in Denmark, from the time before the use of the strep A throat test was widespread, found that high use was inversely associated with high prescribers.11 It is important to note that their definition of high prescribers differed substantially from the present study. In Denmark, the strep A throat test is now only recommended in patients with a minimum of two positive Centor criteria.30 We were unable, however, to assess the relevance of performing diagnostic tests with the present data. As practices receive a fee for performing diagnostic tests, future studies should ascertain the clinical relevance of the performed tests.
Previous studies have found inconsistent associations between high prescribers and GP age and gender.12,13,30 In the initial full model, which included all variables, we found that female practices were negatively correlated and the increasing age of GPs was positively correlated with being a high prescriber. However, our primary model based on relative importance did not incorporate GP age and GP gender, as the two variables combined accounted for <10% of the predicted variation (Table 3). This is in accordance with previous Danish studies.11,12
The correct level of antibiotic treatment cannot be determined from the present study. High prescribers account for 15% of total prescriptions from general practice. This is markedly less than reported differences among patients: 10% of children <6 years old accounted for 25% of the total use.31 Still, the particularly high selective pressure from high prescribers is a concern, especially as they also constitute a risk group for sub-optimal quality of antibiotic treatment, thus accelerating the risk of antibiotic resistance. Previous reports have suggested that an approach targeting high prescribers is feasible and Hallsworth et al.32 showed significant reductions in antibiotic use among high prescribers by the use of nudging letters. Other options to pursue in this group could include delayed prescribing,33 as well as clinical education and audits embedded in practice accreditation.34 Interestingly, van der Velden et al.34 found that high-prescribing practices were motivated and more adaptive to changes than low-prescribing practices.
The finding that most practices had quite uniform prescribing rates when accounting for case mix could be a stepping stone to discussing the correct or desired level of antibiotic use in general practice. Agreement on a set of national targets could be an important step forward in limiting inappropriate antibiotic prescriptions, in turn containing antibiotic resistance.
The use of population-based registries, including routine data from all practices in the country, makes selection bias unlikely and we have adjusted extensively for case mix to account for the explainable variation between practice populations. The findings of the full and reduced versions of the multivariable regression model were consistent regarding the practice-related factors (CRP, strep A throat test, prescriptions over the phone and a high number of consultations), adding credibility to the results. Still, we were unable to incorporate some important variables in the analysis, including clinical parameters (medical history, physical examination and the results of diagnostic tests) and clinical outcomes. Antibiotic prescribing in practice may be influenced by the general prescribing habits of the GP and psychological mechanisms regarding the perception and management of risks,12 which we were unable to control for in our model. Lastly, residual confounding is also a limitation.
The distinction between patient- and practice-related factors may be arbitrary for certain variables. We included the variables geographic location and ethnic group at the patient level, as they have previously been associated with high prescribers.13 It could, however, be argued that there is no medical explanation for differences in antibiotic use between ethnic groups or people in different geographic regions of Denmark. Still, we suggest that it is correct to include them as they could contain information as a proxy for some undefined characteristics of the particular location or ethnic group that may be less well captured in the remaining sociodemographic variables in our model.
Conclusions
We have presented evidence of important diagnostic and organizational factors that characterize high prescribers of antibiotics in Danish general practice. The 10% of highest prescribers accounted for 15% of the total antibiotic prescriptions from general practice and this group also demonstrated a less rational choice of antibiotic therapy. The present study does not provide any indication of the correct level of treatment, but suggests that antibiotic prescribing in Danish general practice was markedly more uniform when accounting for case mix. Lack of access to CRP testing and urinary culture, high use of strep A throat tests and urinary culture, a low percentage of phone prescriptions and a high number of consultations per patient were associated with an increased likelihood of being a high-prescribing practice. Incentives to reduce the use of antibiotics in high prescribers should be pursued, but our findings emphasize the need for the entire general practice sector to continuously work towards reducing inappropriate antibiotic prescribing.
Acknowledgements
We would like to thank Dagny Rós Niclasdottir for data management.
Funding
This work was supported by Helsefonden (grant number 13-b-0196) (R. A.). M. P. H. was supported by a postdoctoral scholarship in general practice and family medicine from the Novo Nordisk Foundation when the database was established.
Transparency declarations
None to declare.
Supplementary data
Table S1, Table S2 and Appendix S1 are available as Supplementary data at JAC Online (http://jac.oxfordjournals.org/).
