


Abstract
Objectives: To assess the population pharmacokinetics (popPK) of daptomycin at the conventional dose of 6 mg/kg/day in a cohort of oncohaematological patients.
Methods: Patients underwent serial blood sampling on day 3 of therapy (before dosing and at 0, 0.5, 1, 2, 3, 5, 7, 9 and 12 h after dosing) to assess the pharmacokinetic profile of daptomycin. PopPK and Monte Carlo simulation were performed to define the probability of target attainment (PTA) with 6, 8, 10 and 12 mg/kg/day of the pharmacokinetic/pharmacodynamic target of AUC24/MIC >1081.
Results: Thirty patients were recruited. A two-compartment open model with first-order intravenous input and first-order elimination was developed. Estimated creatinine clearance (CLCR), serum albumin concentration (Alb) and presence of AML were covariates included in the final model. Monte Carlo simulation showed that the conventional 6 mg/kg/day dose resulted in optimal PTAs (≥80%) in the presence of pathogens with an MIC up to 0.5 mg/L only in patients with CLCR 50–100 mL/min/1.73 m2, Alb 26–45 g/L and a haematological diagnosis other than AML. Conversely, higher dosages, up to 12 mg/kg/day, were needed to achieve this goal in the presence of pathogens with an MIC of 0.25–0.5 mg/L in all of the other tested scenarios. In patients with CLCR 101–150 mL/min/1.73 m2 and Alb 15–25 g/L, suboptimal PTAs (<60%) were predicted even with 12 mg/kg/day dosing .
Conclusions: Our study provides a strong rationale for considering daptomycin dosages of ≥ 8 mg/kg/day in several clinical scenarios for oncohaematological patients. In some of these scenarios therapeutic drug monitoring could be a useful adjunct for optimized care.
Introduction
Bacterial infections are severe life-threatening complications of cytotoxic chemotherapy in neutropenic patients with haematological malignancies.1 During the last 20 years, bloodstream infections due to Gram-positive microorganisms have become increasingly common in this population,2 with mortality rates as high as 5%.3,4 The prevalence of Gram-positive isolates from blood cultures from febrile oncology and haematology patients is of the order of 18.7%,5 and increases to 40.9% when considering pathogens from all infection sites (blood, lung, skin and soft tissues).4,6 CoNS are the most frequent Gram-positive pathogens, with methicillin resistance rates of 70%–80%.4,7 The increase in VRE is particularly worrisome, with VRE being responsible for up to 41.1% of all Gram-positive bacteraemias in oncohaematological patients.8
Daptomycin is a cyclic lipopeptide antibiotic with potent bactericidal activity against most Gram-positive microorganisms, including methicillin-resistant CoNS, MRSA and VRE.9 Daptomycin is licensed at a dose of 4–6 mg/kg/day for the treatment of complicated skin and soft tissue infections, bloodstream infections and endocarditis. Daptomycin is a hydrophilic drug with high plasma protein binding (>90%), relatively small volume of distribution (V) (about 0.1 L/kg), and is primarily eliminated as an unchanged moiety by the kidneys. The elimination half-life is approximately 9 h.9,10 Daptomycin is a valuable alternative to vancomycin because of its extended spectrum of activity and reduced nephrotoxicity.11,12
Patients with haematological malignancies have a number of idiosyncrasies that may alter the pharmacokinetics (PK) of hydrophilic antimicrobials such as daptomycin.13–15 For example, hypoalbuminaemia is commonly seen in oncohaematological patients.16,17 In a logistic regression analysis carried out among 948 hospitalized patients, hypoalbuminaemia was associated with oncohaematological diseases with an OR of 2.5.18 Likewise, augmented renal clearance (ARC), a condition defined as a creatinine clearance (CLCR) ≥130 mL/min, has been increasingly described in haematological patients.19–21
The aim of this study was to estimate the population pharmacokinetics (popPK) of daptomycin in a cohort of oncohaematological patients to further establish whether or not the licensed dose of 6 mg/kg/day may result in adequate drug exposure and in achieving appropriate pharmacodynamic (PD) targets in this patient population.
Patients and methods
Ethics
The study was approved by the Regional Ethics Committee and informed written consent was obtained from each patient.
Study design
This was a prospective observational single-centre study carried out between December 2014 and February 2016 at the Santa Maria della Misericordia University Hospital of Udine, Italy. Adult oncohaematological patients who received 6 mg/kg/day daptomycin infused over 30 min for documented or suspected Gram-positive infections were eligible for the study. Exclusion criteria were CLCR <30 mL/min and/or presence of renal replacement therapy. Patients underwent serial blood sampling on day 3 of therapy (before dosing and at 0, 0.5, 1, 2, 3, 5, 7, 9 and 12 h after dosing) to assess the PK profile of daptomycin.
Daptomycin plasma concentrations were analysed using a validated HPLC method with UV detection, as previously described.22,23 Precision and accuracy were assessed by performing replicate analysis of quality control samples against calibration standards. Intra- and inter-assay coefficients of variation were always <10%. The lower limit of detection was 0.5 mg/L.
Demographic (age, weight and height) and clinical data (co-administered medications, underlying haematological disease and type of infection) were collected at patient enrolment. Serum creatinine and serum albumin were measured on the day of PK assessment. CLCR was estimated by means of the Chronic Kidney Disease Epidemiology (CKD-EPI) formula24 and of the Cockroft–Gault formula.25 CLCR estimates of 30–100 mL/min/1.73 m2 denoted normal renal function, whereas CLCR estimates >100 mL/min/1.73 m2 denoted a trend toward high renal clearance (CL). Serum albumin levels of 36–45 g/L denoted normal albuminaemia, those between 26 and 35 g/L denoted mild hypoalbuminaemia, and those ≤25 g/L denoted severe hypoalbuminaemia.
PopPK modelling
A two-compartment open model with first-order intravenous input and first-order elimination was developed with the non-parametric adaptive grid (NPAG) algorithm within the Pmetrics package for R (Los Angeles, CA, USA).26 An additive lambda model was chosen for the structure of the error model. Estimates of assay errors were included in the modelling process by using an error polynomial as a function of the measured concentration, Y (i.e. SD = C0 + C1Y + C2Y2 + C3Y3), with inputs of 0.05, 0.04, 0 and 0 to incorporate the lowest measured concentrations and a known coefficient of variation from the plasma assay.
PopPK modelling was performed in two steps. In the first step, a base model parameterized only for daptomycin V and CL was developed. This exploratory model was used to assess the level of relationship of daptomycin V and CL with the patient covariates. In the second step, the covariates were included in the structural model. A forward–backward selection process was implemented for covariate inclusion. An increase of >3.84 points in the log-likelihood across models (i.e. P < 0.05) coupled with a decrease in the Akaike information criterion (AIC) and the χ2 in the final model compared with the basic model were used as criteria for retaining a covariate in the final model. Model performance was tested by assessing the goodness-of-fit of the observed versus predicted plot and the coefficient of determination of the linear regression of the observed–predicted values of each run.
A visual predictive check (VPC) for the final model was developed to assess the fit of the model-predicted concentration–time profiles with the observed data. The model was considered reliable if at least 95% of the observed concentrations fell within the 95% CI of the model-predicted concentration–time profiles.
Monte Carlo simulations
The best-performing popPK model was used to conduct Monte Carlo simulations with Pmetrics in order to assess the probability of target attainment (PTA) of the PK/PD target of efficacy with various candidate dosages of daptomycin in oncohaematological patients with various underlying conditions. As PK/PD target of efficacy we defined an AUC24/MIC ratio >1081, in agreement with the findings of Bhavnani et al.13 in 2015 based on data from patients with Staphylococcusaureus bacteraemia/endocarditis who received daptomycin at 6 mg/kg/day. In that study, the authors showed that an AUC24/MIC ratio >1081 was associated with >80% of probability of clinical cure with daptomycin in the subsets of patients who had uncomplicated bacteraemia, normal renal function (>51.2 mL/min/1.73 m2) and normo- or hypo-albuminaemia (≥29 or <29 g/L, respectively). We adopted this PK/PD target as we felt that the type of infection and the pathophysiological conditions of these subsets of patients in the study of Bhavnani et al.13 were quite similar to those observed among our study population.
In total, 1000 subject Monte Carlo simulations were performed for each clinical scenario in order to estimate the PTA of an AUC24/MIC ratio >1081 with daptomycin dosages of 6, 8, 10 and 12 mg/kg/day. In order to define the permissible daptomycin dosages in the study population, we placed a safety threshold (ST) for trough levels (Cmin) at <24.3 mg/L, in agreement with the findings of Bhavnani et al.27 in 2010. In that study, daptomycin Cmin values ≥24.3 mg/L were associated with a 50% probability of creatine phosphokinase elevation among patients receiving daptomycin for the treatment of bacteraemia and endocarditis.27 Permissible daptomycin dosages were considered those producing <15%–20% probability of achieving Cmin above the ST. Optimal PTAs with permissible daptomycin dosages were considered those achieving values ≥80% of an AUC24/MIC ratio >1081 in each scenario.
Statistical analysis
The Kolmogorov–Smirnov test was used to assess whether data were normally or non-normally distributed. Accordingly, mean ± SD or median with IQR were used for the descriptive statistics. Categorical variables were compared by the χ2 test while continuous variables were compared using the Student’s t-test or Mann–Whitney test, as necessary. Univariate logistic regression analysis was performed to assess the association between daptomycin underexposure and patients’ clinical variables. A P value <0.05 was required to achieve statistical significance. All statistical analyses and plotting were performed using R version 3.3.1 (R Foundation for Statistical Computing, Vienna, Austria).
Results
Patient characteristics
Thirty adult oncohaematological patients were recruited in the study. Demographic and clinical characteristics are summarized in Table 1. Median age was 57 years and 53.3% were females. Median of CLCR estimate was 102.2 mL/min/1.73 m2 and 63.3% of patients (19/30) had a trend toward high renal CL. Hypoalbuminaemia occurred in 60% of patients (18/30), being mild in 53.3% of cases (16/30) and severe in 6.7% of cases (2/30). AML was the most frequent underlying haematological malignancy (18/30, 60% of patients). The main reasons for daptomycin treatment were bloodstream infections and skin and soft tissue infections, which accounted overall for 90% of cases (27/30). Microbiological isolates were obtained in 40% of patients (12/30). Additional antibiotics were administered in 53.3% of cases (16/30).
Demographic characteristics of the population
| Total number of patients | 30 |
| Age (years) | 57 (50.3–62.5) |
| Gender (male/female) | 14/16 |
| Weight (kg) | 69.0 (50.0–109.0) |
| BMI (kg/m2) | 23.9 (18.8–39.7) |
| CLCR (mL/min/1.73 m2) | 102.2 (68.2–123.2) |
| Albumin (g/L) | 33.6 (18.7–41.3) |
| Daptomycin AUC24 (mg·h/L) | 435.8 (155.6–1006.1) |
| Daptomycin Cmax (mg/L) | 55.42 (47.0–68.9) |
| Duration of therapy (days) | 7 (4–16) |
| Time post-chemotherapy (days) | 12 (9–16) |
| Type of haematological disease | |
| AML | 18 (60.0) |
| ALL | 3 (10.0) |
| multiple myeloma | 3 (10.0) |
| lymphoma | 3 (10.0) |
| CML | 1 (3.3) |
| idiopathic myelofibrosis | 1 (3.3) |
| idiopathic thrombocytopenic purpura | 1 (3.3) |
| Type of infections | |
| bloodstream infection | 15 (50.0) |
| soft and skin tissue infection | 11 (36.7) |
| fever of unknown origin | 2 (6.7) |
| soft and skin tissue infection and bloodstream infection | 1 (3.3) |
| thrombophlebitis | 1 (3.3) |
| Organisms isolated | |
| Staphylococcus spp. | 12 (40.0) |
| viridans streptococci | 2 (6.7) |
| Enterococcus faecalis | 1 (3.3) |
| Additional antibiotics | |
| piperacillin/tazobactam | 8 (26.7) |
| meropenem | 3 (10.0) |
| levofloxacin | 2 (6.7) |
| amikacin | 2 (6.7) |
| trimethoprim/sulfamethoxazole | 1 (3.3) |
Data for continuous variables are presented as median (IQR) and data for dichotomous variables are presented as number (%).
PopPK analysis
The final two-compartment model that contained patient covariates described daptomycin concentrations very well. The diagnostic plots for the final covariate model (Figure 1) showed a close relationship between the observed and the predicted concentrations in plasma, both on a population level (R2 = 0.614; bias = 0.584; imprecision = 4.71) and after the Bayesian step (R2 = 0.936; bias = –0.117; imprecision = 0.644). The distribution of the observed concentrations in plasma was consistent with that of the predicted concentrations, as suggested by the VPC plot (Figure 2).
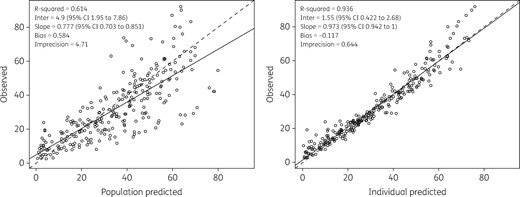
Diagnostic plot for the final covariate model. Shown are observed versus population predicted concentrations (left) and individual predicted concentrations (right) in plasma. Solid lines refer to linear regression between observed and predicted concentrations. Dashed lines are the identity lines between observed and predicted concentrations.
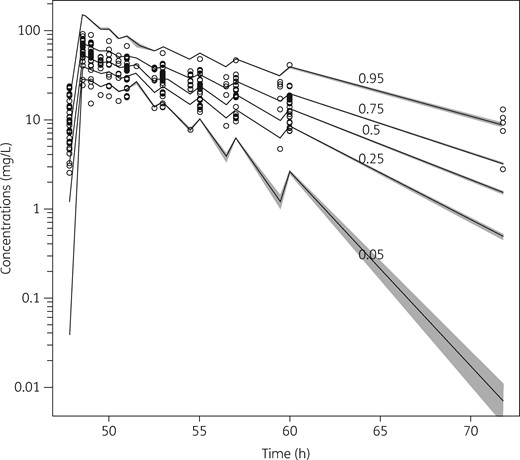
VPC plot of daptomycin plasma concentrations versus time for the final covariate model. Grey shading indicates the predicted intervals of simulated data. Only plasma concentrations above the lower limit of detection are shown.
The performance of the different models built to assess the influence of covariates on daptomycin CL and V is reported in Table 2. Estimated CLCR, serum albumin concentration and AML were significantly correlated with daptomycin CL, whereas body weight was significantly associated with daptomycin V. CLCR estimates based on the CKD-EPI formula showed a better correlation with daptomycin CL compared with those based on the Cockcroft–Gault formula, and were therefore included in the model. The full multivariable model was as follows:

Run record of the most significant models evaluated in this study with their relative performance indicators
| Model type | Parameter | Covariate | Functional form | Log likelihood | AIC | χ2 compared with base model | Statistics for observed versus individual predictive analysis | ||
|---|---|---|---|---|---|---|---|---|---|
| R2 | bias | imprecision | |||||||
| Base model | — | — | — | –1869 | 1880 | NA | 0.902 | –0.143 | 0.652 |
| Covariate models | CL | Alb | power | –1777 | 1789 | 3.07 × 10⁻⁹ | 0.929 | –0.175 | 0.651 |
| CL | AML | additive shift | –1743 | 1755 | 1.83 × 10⁻¹⁰ | 0.937 | –0.120 | 0.643 | |
| CL | CLCR | power | –1734 | 1746 | 5.12 × 10⁻¹⁰ | 0.937 | –0.148 | 0.674 | |
| V | Wt | power | –1743 | 1755 | 3.07 × 10⁻⁹ | 0.936 | –0.114 | 0.644 | |
| Full multivariable model | CL, V | Alb, AML, CLCR, Wt | power and additive shift | –1727 | 1743 | 3.07 × 10⁻⁹ | 0.937 | –0.117 | 0.644 |
NA, not applicable.
Parameter estimates of daptomycin for the final covariate two-compartment popPK model
| Parameter | Mean | SD | Coefficient of variation (%) | Median (IQR) |
|---|---|---|---|---|
| CL (L/h) | 1.02 | 0.45 | 44.10 | 0.89 (0.73–1.19) |
| V (L) | 4.84 | 2.34 | 48.30 | 4.29 (3.58–4.76) |
| kcp (h−1) | 19.04 | 2.16 | 11.33 | 19.89 (18.72–19.90) |
| kpc (h−1) | 19.40 | 1.89 | 9.73 | 19.90 (19.90–19.90) |
kcp and kpc, first-order intercompartmental transfer rate constant connecting the central and peripheral compartments.
Monte Carlo simulations
The PTA of the defined PK/PD target with incremental dosages of 6, 8, 10 and 12 mg/kg/day was simulated in oncohaematological patients according to the underlying clinical conditions that were included as covariates in the final popPK model (CLCR, Alb and diagnosis of AML). Eight different clinical scenarios were simulated in relation to two different classes each for renal function (CLCR 50–100 mL/min/1.73 m2 or 101–150 mL/min/1.73 m2), albuminaemia (Alb 26–45 g/L or 15–25 g/L) and type of haematological malignancy (AML or no AML). Consistently, 32 runs of 1000 subject Monte Carlo simulations were conducted, and the distributions of the simulated PTAs achievable with the different daptomycin dosing regimens in the various clinical scenarios are depicted in Figure 3. All the candidate dosing regimens of daptomycin were found to be permissible in the tested scenarios.
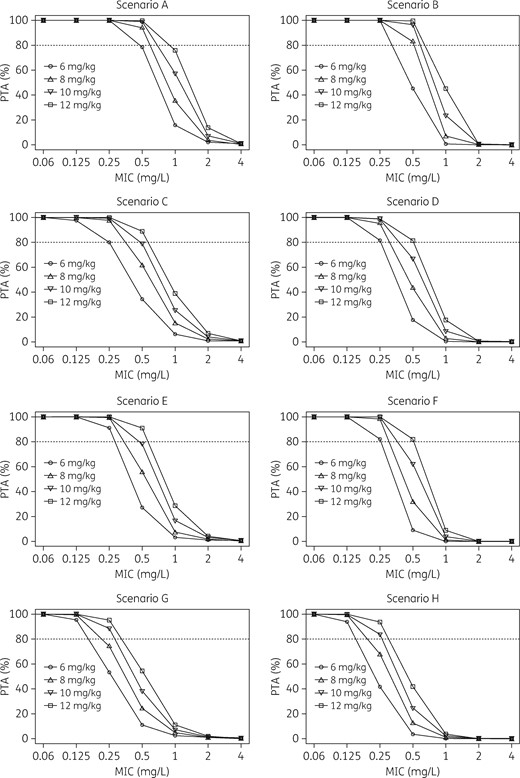
Distributions of the simulated PTA of the PK/PD target of AUC24/MIC >1081 achievable with the different daptomycin dosing regimens in various clinical scenarios. Scenario A: CLCR 50–100 mL/min/1.73 m2, albumin 26–45 g/L, no AML. Scenario B: CLCR 50–100 mL/min/1.73 m2, albumin 26–45 g/L, AML. Scenario C: CLCR 50–100 mL/min/1.73 m2, albumin 15–25 g/L, no AML. Scenario D: CLCR 50–100 mL/min/1.73 m2, albumin 15–25 g/L, AML. Scenario E: CLCR 101–150 mL/min/1.73 m2, albumin 26–45 g/L, no AML. Scenario F: CLCR 101–150 mL/min/1.73 m2, albumin 26–45 g/L, AML. Scenario G: CLCR 101–150 mL/min/1.73 m2, albumin 15–25 g/L, no AML. Scenario H: CLCR 101–150 mL/min/1.73 m2, albumin 15–25 g/L, AML. The dotted line identifies optimal PTA (≥80%).
The licensed dosage of 6 mg/kg/day predicted optimal PTAs in oncohaematological patients only for some clinical scenarios (A–F) when in the presence of pathogens with an MIC of daptomycin up to and including 0.25 mg/L. Conversely, to achieve similar PK/PD targets in the other scenarios (G and H), 10 mg/kg/day was needed. When considering an MIC of 0.5 mg/L, the 6 mg/kg/day dose predicted suboptimal PTAs in all of the scenarios, with PTAs being almost optimal (78.1%) only for scenario A. Dosages ranging from 8 to 12 mg/kg/day predicted optimal PTAs in most of the scenarios (lowest permissible dose: 8 mg/kg/day for scenarios A and B; 10 mg/kg/day for scenarios C and E; and 12 mg/kg/day for scenarios D and F), apart from scenarios G and H (54.3% and 41.8%, respectively). None of the candidate regimens predicted optimal PTAs against pathogens with an MIC ≥1 mg/L. However, this should not represent an issue given that the EUCAST WT MIC distributions showed that the MIC90 for both S. aureus and CoNS was 0.5 mg/L.28
A dosing algorithm for choosing the most advisable dosing regimen for empirical treatment of staphylococcal infections in oncohaematological patients with daptomycin in relation to different classes of underlying haematological disease, CLCR estimates and albumin levels is depicted in Figure 4.
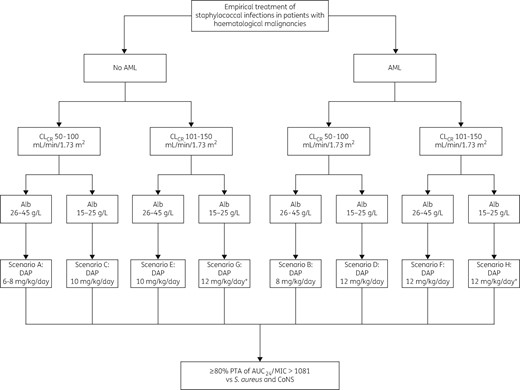
Algorithm for choosing the most advisable daptomycin (DAP) dosing regimen in oncohaematological patients with S. aureus and/or CoNS bacteraemia, in relation to different classes of underlying haematological disease, CLCR estimates and albumin levels. An asterisk indicates that TDM is suggested.
Discussion
This study developed a popPK model for daptomycin in hospitalized patients with haematological malignancies, and simulated the PTA of an AUC24/MIC >1081 with four incremental drug-dosing regimens. Our intention was to identify the best regimens for achieving appropriate PK/PD targets in oncohaematological patients with various underlying conditions.
The final model accounted for up to 94% of the variability in drug concentrations and adequately fitted daptomycin concentration–time data, providing reliable estimates of the PK parameters. Daptomycin CL and V showed wide interindividual variability across different patient populations. Daptomycin CL ranged from 0.56 to 1.81 L/h in patients with bone and joint infections29 and in those with sepsis and S. aureus bacteraemia,30 respectively. Likewise, V ranged from 4.44 L31 to 12.29 L.32 Overall, our PK estimates are similar to those reported in most of the previous studies, and are consistent with those reported by the largest popPK study carried out in patients with CLCR estimates >80 mL/min (median CL of 0.86 L/h and V of 4.44 L).31
Covariate analysis found that CLCR, AML and Alb may affect the CL of daptomycin in oncohaematological patients. Several other authors found that CLCR is a major covariate affecting daptomycin CL,29,31,32 and dose adjustments have been recommended for patients with CLCR estimates <30 mL/min. However, renal insufficiency is a rather infrequent occurrence in haematological patients, among whom mean and median values of CLCR are frequently higher than 100 mL/min/1.73 m2,20,33 especially among AML patients.19
Augmentation of renal CL has been documented for several hydrophilic antibiotics among AML patients. A 20% increase in amikacin CL was documented among 207 AML patients,34 and similar findings for the aminoglycosides were also reported by other authors.35–37 We and other authors additionally showed that ceftazidime CL may be increased in AML patients with febrile neutropenia.15,38 Consistently, conventional doses of hydrophilic antimicrobials were shown to be inadequate in AML patients. A prospective randomized controlled study was focused on describing piperacillin exposure in febrile neutropenic patients (38% of whom had AML) with a median CLCR of 84 mL/min/1.73 m2. It was shown that the conventional dose of piperacillin/tazobactam (4.5 g every 8 h or every 6 h) did not offer adequate exposure especially among patients with ARC (31% of the study population).21 Likewise, Lamoth et al.20 demonstrated that the recommended 2 g daily dose of imipenem was inadequate in ensuring appropriate exposure in febrile neutropenic oncohaematological patients (64.9% of whom had AML) with a median CLCR of 105 mL/min.
The finding that the diagnosis of AML may by itself be an independent covariate in increasing daptomycin CL is in agreement with the findings of other authors, who showed that AML was an independent predictor of CL increase for both amikacin34 and vancomycin.39 It has been hypothesized that in the early time post-chemotherapy the influence of AML on drug CL might be due to glomerular hyperfiltration in response to the huge renal load of proteinaceous cellular catabolites deriving from massive cellular lysis of circulating cells.40 Other authors suggested that glomerular hyperfiltration might be due to increased cardiac output and systemic inflammatory response promoted by febrile neutropenia.41
Albuminaemia was the third covariate that improved the predictive performance of our popPK model in estimating daptomycin CL. For antibiotics highly bound to plasma protein, such as daptomycin and teicoplanin, severe hypoalbuminaemia, by increasing the amount of the free moiety, may promote significant increases in drug CL.42,43 Severe hypoalbuminaemia is a frequent occurrence among oncohaematological patients,18 and our group showed that conventional doses of teicoplanin are often inadequate among AML patients with severe hypoalbuminaemia.14
Monte Carlo simulations showed that the licensed 6 mg/kg/day dose of daptomycin may be inadequate in several clinical scenarios of oncohaematological patients. Simulation predicted attainment of optimal PTAs with the licensed dosage against pathogens with an MIC up to 0.5 mg/L only in patients with normal renal function, normal albuminaemia or mild hypoalbuminaemia, and a diagnosis of haematological disease other than AML. Conversely, in all of the other tested scenarios, higher dosages of up to 12 mg/kg/day were needed to achieve this goal. The most challenging situation was that of AML patients with a trend toward high renal CL and severe hypoalbuminaemia. Our analysis suggests that when these conditions coexist, even the 12 mg/kg/day dose may not be enough in oncohaematological patients. Considering the high probability of suboptimal PTA predicted by our model in these clinical scenarios, we believe that therapeutic drug monitoring (TDM) should be at least considered in this setting. Some limited experience has shown the potential usefulness of this approach in routine clinical practice.22,30
It is worth mentioning that the proposed regimens should provide adequate treatment of staphylococcal infections in oncohaematological patients, given that the EUCAST MIC90 for both S. aureus and CoNS is 0.5 mg/L.28
The need for high daptomycin dosages ≥8 mg/kg/day has been advocated by several authors, mainly in other patient populations.30,44–48 However, the majority of these claims were empirical, and were not supported by robust popPK/PD analysis, as we have done for oncohaematological patients in this study.
We are aware of some potential weaknesses of our study. We recognize that the small sample size coupled with the heterogeneity of the patient case-mix might limit the generalizability of the findings. Additionally, some of the interindividual PK variability of daptomycin might not be predicted accurately by our model, as non-renal CL may account for up to 40% of daptomycin CL.10 However, the robust popPK/PD analysis is a strength of our work. Finally, we recognize that the proposed PK/PD approach is probably not feasible for infections due to enterococci, considering the lower susceptibility of these pathogens to daptomycin (MIC50 and MIC90 of 2 and 4 mg/L, respectively).28
In conclusion, our study provides a strong rationale for considering the need for high daptomycin dosages ≥8 mg/kg/day in several clinical scenarios of oncohaematological patients. Additionally, it provides a user-friendly algorithm that may help clinicians in choosing the most advisable dosing regimen for the empirical treatment of staphylococcal infections in relation to certain clinical conditions that occur frequently among these patients. We are currently planning a prospective study based on real-time TDM of daptomycin to assess the reliability of this algorithm in clinical practice.
Funding
This study was conducted as part of our routine work.
Transparency declarations
None to declare.
