


Background: Increasing concerns about antibiotic resistance and microbiome disruption have stimulated interest in describing antibiotic consumption in young children. Young children are an age group for whom antibiotics are frequently prescribed.
Objectives: To describe community antibiotic dispensing during the first 5 years of life in a large, socioeconomically and ethnically diverse cohort of children, and to determine how antibiotic dispensing varied between population subgroups.
Methods: This study was performed within the Growing Up in New Zealand longitudinal cohort study (www.growingup.co.nz) with linkage to national administrative antibiotic dispensing data. Descriptive statistics and univariate and multivariable associations were determined.
Results: The 5581 cohort children received 53 052 antibiotic courses, of which 54% were amoxicillin. By age 5 years, 97% of children had received one or more antibiotic courses, and each child had received a median of eight antibiotic courses (IQR 4–13). The mean incidence of antibiotic dispensing was 1.9 courses/child/year. Multivariable negative binomial regression showed that Māori and Pacific children received more antibiotic courses than European children, as did children in the most-deprived compared with the least-deprived areas. A distinct seasonal pattern was noted.
Conclusions: This study provided a detailed description of antibiotic dispensing within a large and diverse child cohort. Antibiotic exposure was near universal by age 5 years. The predominance of amoxicillin use and the seasonal pattern suggest much antibiotic use may have been for self-limiting respiratory infections. There is a need for safe and effective interventions to improve antibiotic prescribing practices for New Zealand children.
Introduction
Alongside improvements in public health and hygiene, antibiotics have played a major role in reducing infectious disease morbidity and mortality during the past 65 years. As a consequence, antibiotics are the medications most commonly prescribed for young children.1–3
However, the relatively unrestrained use of antibiotics has resulted in increases in antibiotic resistance that threaten our ability to effectively treat infections.4,5 As a result, many countries have introduced antimicrobial stewardship programmes, which encourage appropriate antibiotic prescribing. High priorities for antimicrobial stewardship programmes include reducing the use of antibiotics for illnesses for which the probability of a bacterial aetiology is low, and reducing the inappropriate use of broad-spectrum antibiotics for bacterial infections.6,7 The need for antimicrobial stewardship is highlighted by the substantial variability in antibiotic use between countries, between regions within countries, and between individual prescribers.8,9 There is also a growing understanding that antibiotics, particularly if given very early in life, may have a range of undesirable effects, including increased weight gain,10,11 or the development of immunologically mediated disease,12,13 thought to be related to disruption of the child’s developing microbiome.
Previous research has shown that the overall level of antibiotic dispensing in the New Zealand (NZ) community is higher than in most European countries, with the highest levels of dispensing in young children and the elderly.14 A study conducted in a largely rural region of New Zealand showed that the level of antibiotic dispensing for rural Māori (the indigenous people of NZ) children, was lower than the level for rural European children, raising concern that Māori children may have had restricted access to medical care.15
In order to inform a national strategy to address the rising rate of antibiotic resistance in NZ, we aimed to describe community antibiotic dispensing in the first 5 years of life in a diverse cohort of NZ children, and to determine how antibiotic dispensing varied between population subgroups.
Materials and methods
Study design
This study was conducted within the Growing Up in New Zealand (GUINZ; www.growingup.co.nz) longitudinal birth cohort study, using data obtained from parental interviews and from linkage to the Pharmaceutical Collection, a national administrative dataset comprising records of subsidized prescription medications dispensed from community pharmacies.16 GUINZ enrolled 6822 pregnant women with an estimated delivery date between 25 April 2009 and 25 March 2010. The 6853 cohort children were born to 6760 of these mothers. The ethnic and socioeconomic characteristics of the cohort were very similar to those of the total NZ birth cohort.17,18
In NZ, antibiotics for systemic use are only available with a prescription, and, at the time of the study, were dispensed free of charge for children under the age of 6 years.19 Each of these fully subsidized dispensings from a community pharmacy is recorded in the Pharmaceutical Collection, which is stored by the Ministry of Health.20
Ethics
Ethics approval for the cohort study was obtained from the Ministry of Health Northern Y Regional Ethics Committee. Data from interviews, and from administrative health datasets, for each participating child, from birth to age 5 years, were obtained only for those children whose primary caregiver provided written informed consent.
Measures and definitions
Explanatory variables were obtained from parental interviews and linked census-derived data. Variables of interest included child ethnicity, gender, household socioeconomic deprivation and residence in an urban or rural area. Ethnicity was defined as the principal ethnic group nominated by the parent(s) at the interview completed when the cohort children were 4.5 years old. For the purposes of analysis, ethnicity was grouped into the Statistics NZ level 1 ethnic categorization: Māori, Pacific, European, Asian and ‘other’.21 As numbers in the ‘other’ category were low (n = 63), these children were combined with the European group for analysis. Household socioeconomic deprivation was measured using the NZDep2013 index, a measure of deprivation derived from nine variables from the 2013 national census, which is provided for each ‘meshblock’ (a small geographical unit containing a median of 81 individuals) in NZ, as assigned according to the address at which the child lived at the time of the 4.5 year interview.22 The NZDep2013 index is reported in deciles, with decile 1 being the least deprived and decile 10 the most deprived 10% of NZ households. From the NZDep2013 index, three groups representing low (deciles 1–3), intermediate (deciles 4–7) and high (deciles 8–10) levels of socioeconomic deprivation were created. Rural residence was defined as residence in a rural area according to the Statistics New Zealand Classification of Urban Areas.23
The Pharmaceutical Collection includes a record of all prescription medicines dispensed for which a community pharmacist has sought government subsidization.20 The Pharmaceutical Collection does not include information on hospital inpatient dispensing, or medications dispensed directly by a medical practitioner in an emergency situation.20 Data were obtained for antibiotics that were coded under the Anatomical Therapeutic Chemical (ATC) system as J01: antibacterials for systemic use.24 Antibiotics were further identified by class (e.g. macrolides, cephalosporins) and, in the case of penicillin antibiotics, by individual medication (e.g. amoxicillin, flucloxacillin). Topical antibacterial preparations and topical or systemic antifungal, antiviral or antiparasitic medications were excluded.
The primary outcome variable was the number of antibiotic courses dispensed per child before the age of 5 years. This measure was used in preference to the DDD as DDDs are based on typical adult doses and are not appropriate for young children.25,26 Where multiple antibiotic agents were dispensed on the same day, this was regarded as a single course. Antibiotic courses dispensed on separate days were regarded as separate courses, regardless of the degree of separation in time. Secondary outcomes included the proportion of children dispensed an antibiotic course by year of age, and the number of days of antibiotic dispensed per course. Days dispensed could only be calculated where adequate information to do so was provided (i.e. either if the number of days was recorded, or if a combination of the total amount dispensed, the amount per dose and the dose frequency was recorded). Hospital discharge diagnostic coding records were reviewed to identify potential indications for antibiotic prophylaxis use for children dispensed >40 antibiotic courses before the age of 5 years, or one or more courses of ≥28 days.
Statistical analysis
Data were analysed using descriptive statistics, the Mann–Whitney–Wilcoxon test and multivariable negative binomial regression for numerical outcomes, and the χ2 test for categorical outcomes. The Kolmogorov–Smirnov test was used to derive P values for comparisons between cumulative distribution functions. Associations identified from regression analysis were reported as incidence rate ratios (IRRs) and 95% CIs, and were corrected for birth month. Graphs were used to show the frequency distribution of the number of antibiotic courses dispensed by the age of 5 years, the cumulative distribution function of first antibiotic dispensing, and the relationships between 1 month prevalence of antibiotic dispensing, child age and calendar month. P values of <0.05 were considered statistically significant. SAS version 9.4 (SAS Institute, Cary, NC, USA) was used for statistical analysis.
Results
The 4.5 year interview was completed for 90% of the cohort (6156/6853). Consent to access administrative health data was provided by the primary caregiver for 5670/6156 (92%). Of these 5670 children, 89 were excluded from further analysis due to non-residence in NZ during one or more of the face-to-face interviews completed when the cohort children were 9 months, 2 years or 4.5 years old (83 children); evidence of a linkage mismatch (4 children); missing household and social data (1 child); and possible indication for long-term antibiotic prophylaxis (1 child).
Community pharmaceutical dispensing data from birth to age 5 years was available for 5581 (100%) children. The 5581 children were dispensed a total of 215 847 prescriptions of all medication types, of which 53 052/215 847 (25%) were for an antibiotic. The most frequently dispensed antibiotic class was the penicillins [38 724/53 052 (73%)], with 28 813/38 724 (74%) of penicillin dispensings being for amoxicillin. Trimethoprim/sulfamethoxazole [5587/53 052 (11%)], cephalosporins [5002/53 052 (9%)] and macrolides [3722/53 052 (7%)] were the next most frequently dispensed antibiotics, with other classes accounting for only 15/53 052 (0.03%) (Table S1, available as Supplementary data at JAC Online). The number of days of antibiotics dispensed per course was able to be determined for 42 752/53 052 (81%) of the antibiotic courses. For these courses, the median number of days per antibiotic course was 7 (IQR 7–8).
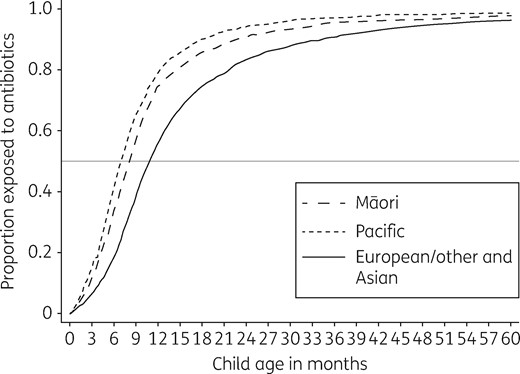
Cumulative distribution function of children dispensed an antibiotic course by child age in months and ethnicity.
Percentage cohort children who were dispensed one or more antibiotic courses in each year of life from birth to age 5 years, by ethnic group
| Child age (years) | All children (n = 5581) | Ethnic group | P valuea | |||
|---|---|---|---|---|---|---|
| European/other (n = 3254) | Māori (n = 855) | Pacific (n = 773) | Asian (n = 700) | |||
| <1 | 62 | 56 | 75 | 79 | 53 | <0.001 |
| 1 | 77 | 74 | 82 | 88 | 73 | <0.001 |
| 2 | 73 | 70 | 76 | 82 | 76 | <0.001 |
| 3 | 70 | 66 | 74 | 77 | 77 | <0.001 |
| 4 | 66 | 61 | 70 | 76 | 71 | <0.001 |
χ2 test for difference in proportion between ethnic groups.
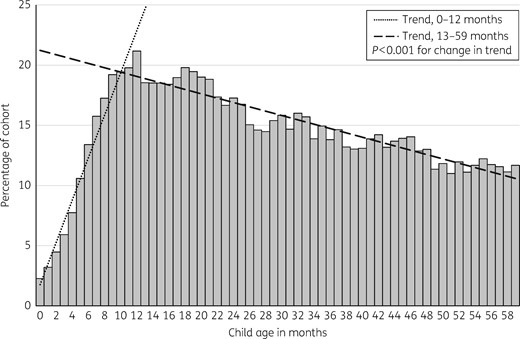
Percentage of 5581 cohort children who were dispensed a course of antibiotic by month of age, from birth to 5 years.
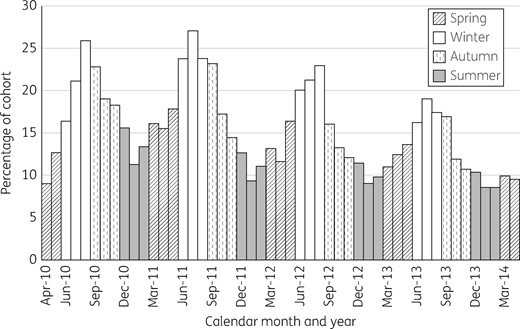
Percentage of 5581 cohort children who were dispensed a course of antibiotic by calendar month and year, restricted to months in which data from the whole cohort were available.
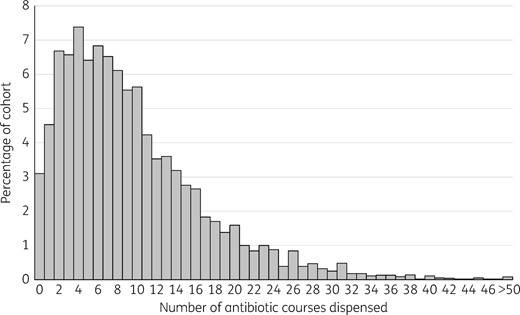
Distribution of the number of antibiotic courses dispensed per child during the first 5 years of life.
Median number of courses of antibiotic dispensed to the 5581 cohort children from birth to age 5 years and unadjusted associations with explanatory variables
| Explanatory variable | n (%) | Median (IQR) | P valuea |
|---|---|---|---|
| All children | 5581 | 8 (4–13) | |
| Gender | |||
| female | 2701 (48) | 7 (4–12) | reference |
| male | 2880 (52) | 8 (4–14) | <0.001 |
| Rurality | |||
| urban | 5047 (90) | 8 (4–13) | reference |
| rural | 533 (10) | 6 (3–11) | <0.001 |
| Ethnicity | |||
| European/other | 3253 (58) | 7 (3–11) | reference |
| Māori | 855 (15) | 9 (5–15) | <0.001 |
| Pacific | 773 (14) | 11 (7–16) | <0.001 |
| Asian | 700 (13) | 8 (4–13) | <0.001 |
| Deprivation (NZDep2013) | |||
| low (deciles 1–3) | 1718 (31) | 7 (4–12) | reference |
| intermediate (deciles 4–7) | 2019 (36) | 7 (4–12) | 0.25 |
| high (deciles 8–10) | 1844 (33) | 9 (5–15) | <0.001 |
Mann–Whitney–Wilcoxon test for pairwise comparison with reference group.
The incidence of antibiotic dispensing was 1.9 antibiotic courses dispensed per child per year (SD 1.5) over the first 5 years of life. Multivariable negative binomial regression was used to estimate IRRs, controlling for gender, ethnicity, socioeconomic deprivation, rurality and birth month. The incidence rate of antibiotic dispensing was higher in Māori, Pacific and Asian children compared with European children, and was higher for children living in households of high compared with low socioeconomic deprivation (Table 3). The incidence rate was lower in children living in rural compared with urban areas.
Multivariable negative binomial regression of total number of antibiotic courses dispensed to the 5581 cohort children from birth to age 5 years by gender, rural residence, ethnicity and deprivation group, corrected for birth month
| Explanatory variable | IRR (95% CI) | P value |
|---|---|---|
| Mean at intercept | 8.07 (7.72–8.43) | |
| Male gender | 1.10 (1.05–1.14) | <0.001 |
| Rural residence | 0.88 (0.82–0.94) | <0.001 |
| Ethnicity | ||
| European/other | reference | reference |
| Māori | 1.29 (1.21–1.37) | <0.001 |
| Pacific | 1.35 (1.27–1.44) | <0.001 |
| Asian | 1.07 (1.01–1.15) | 0.03 |
| Deprivation (NZDep2013) | ||
| low (deciles 1–3) | reference | reference |
| intermediate (deciles 4–7) | 0.99 (0.94–1.04) | 0.69 |
| high (deciles 8–10) | 1.08 (1.02–1.14) | 0.009 |
When the multivariable analysis was stratified by ethnicity (Table S2), rural residence was associated with a reduced incidence of antibiotic dispensing for European children (IRR 0.87, 95% CI 0.80–0.95, P = 0.001), but this trend was not significant for Māori children (IRR 0.88, 95% CI 0.74–1.04, P = 0.13). A high level of socioeconomic deprivation was associated with an increased incidence of antibiotic dispensing for Māori (IRR 1.29, 95% CI 1.08–1.53, P = 0.004) and Pacific (IRR 1.26, 95% CI 1.03–1.53, P = 0.02) children, but socioeconomic deprivation was not associated with the incidence of antibiotic dispensing for European/other or Asian children. For the analyses within the Pacific, Asian and other ethnic groups, the association between rural residence and antibiotic dispensing rates could not be assessed because of the small numbers of these children residing in rural regions. The multivariable analysis stratified by socioeconomic deprivation is presented in Table S3.
Discussion
In this study of antibiotic dispensing in a large, representative cohort of NZ children, exposure to antibiotics was almost universal; only 3% of children had not been dispensed an antibiotic course by the age of 5 years. On average, each child received eight antibiotic courses in the first 5 years of life, with the rate of antibiotic dispensing peaking at the end of the first year. Rates of antibiotic dispensing were higher for boys compared with girls, were lower for children living in rural compared with urban regions, and were higher for children of Māori, Pacific or Asian compared with European ethnicity, and for children living in households of high compared with low socioeconomic deprivation. While direct comparison is difficult due to variations in study methodology, the proportion of children dispensed an antibiotic by year of life and the dispensing incidence rate of 1.9 courses per child per year identified in the current study were high relative to rates reported in recent studies from Europe and the USA (Table 4).2,11,27–31
Recent literature reporting paediatric antibiotic prescribing rates, restricted to age stratum most closely matching current study where possible
| Author | Year | Country | Data source | Period | Age (years) | Incidence (prescriptions/child/year) | Prevalence, % (period) |
|---|---|---|---|---|---|---|---|
| Current study | 2016 | New Zealand | national registry | 2009–15 | 0–4 | 1.9 | 70 |
| Saari et al.11 | 2015 | Finland | national registry | 2003–07 | 0–2 | NR | 76.6 (2 years) |
| Ternhag et al.27 | 2014 | Sweden | national registry | 2010 | 0–5 | NR | 30.2 (1 year) |
| Holstiege et al.28 | 2014 | Denmark | claims DB | 2005–08a | 0–4 | 1.0 | NR |
| Holstiege et al.28 | 2014 | Italy | claims DB | 2007–08a | 0–4 | 1.4 | NR |
| Holstiege et al.28 | 2014 | Germany | claims DB | 2005–08a | 0–4 | 0.9 | NR |
| Holstiege et al.28 | 2014 | Netherlands | pharmacy DB | 2005–08a | 0–4 | 0.5 | NR |
| Holstiege et al.28 | 2014 | UK | primary care DB | 2005–08a | 0–4 | 0.8 | NR |
| Bailey et al.29 | 2014 | USA | primary care DB | 2001–13 | 0–2 | NR | 69 (2 years) |
| Clavenna et al.30 | 2009 | Italy | prescription DB | 2006 | 0–14 | NR | 52.4 (1 year) |
| de Jong et al.31 | 2008 | Netherlands | pharmacy DB | 1999–2005 | 0–4 | 0.3 | 29 (1 year) |
| Hall et al.2 | 2002 | New Zealand | primary care DB | 1998–99 | 0–6 | 1.6 | NR |
DB, database; NR, not reported.
Only 2008 results presented from Holstiege et al.28 Results for Italian region only available from 2007–08.
While the range of antibiotic classes dispensed was similar to that reported in Europe and North America, some differences were evident. Narrow-spectrum penicillins contributed a larger proportion of courses dispensed in NZ and the range of individual medicines dispensed within classes was more limited than that described in the USA,32 Italy30 and the Netherlands.31 One potential reason for this is that NZ has a central medication purchasing agency, PHARMAC (www.pharmac.govt.nz), which ensures access to key classes of medications but restricts access to multiple closely related agents. For children, antibiotic choices are also likely to reflect the availability of palatable oral liquid formulations. This explains the low frequency of trimethoprim use compared with trimethoprim/sulfamethoxazole, as no liquid formulation of the former is available in NZ.
Rates of dispensing were low in the first few months of life before increasing relatively rapidly to a peak at 1 year of age. This finding probably reflects a genuinely lower rate of infection but may in part relate to the data source used. It is likely that general practitioners, faced with an unwell infant at this young age, will be more likely to refer these children to hospital,33 where, for a proportion, antibiotics either are not prescribed or are completed prior to discharge and hence are not included in the dispensing dataset used for this study. Rates of infection could be lower in the youngest infants for several reasons.34 While they are being cared for at home, young infants may have less exposure to the pathogens which cause the respiratory infections that drive much of the antibiotic prescribing in early childhood.32,35 They may also have residual passive immunity provided by transplacental transfer of maternal antibody, thus reducing the frequency and severity of illnesses following pathogen exposure during the first few months of life.36
The finding that antibiotic dispensing peaked at a young age and that 92% of the children were exposed to antibiotics by 3 years of age is of concern given current knowledge about the importance of this period of infancy for the establishment of a healthy microbiome. Antibiotic consumption during this critical period may lead to persistent metabolic or immunological changes.11–13,37,38 For example, Bailey et al.29 found that there was an average 11% [relative risk (RR) 1.11, 95% CI 1.015–1.213, P = 0.02] increase in the risk of obesity for children who had received four or more courses of an antibiotic between ages 0 and 23 months. Saari et al.11 also identified significant increases in age-adjusted BMI z-score at 24 months in children who had received antibiotics between ages 0 and 23 months. Given these findings, antibiotic exposure could potentially be contributing to childhood overweight and obesity in NZ, and this possibility will be investigated in future research within the GUINZ cohort.
The predominance of amoxicillin use and the pattern of higher dispensing rates in winter are consistent with prior observations of antibiotic prescribing for seasonal respiratory tract infections, the majority of which are caused by viruses.32,39 Current NZ general practice guidelines recommend expectant management, not antibiotic treatment, for most upper and lower respiratory infections in children.40 However, a previous NZ study found that ∼75% of children with a self-limited upper respiratory tract infection were prescribed an antibiotic.41 Further research within the GUINZ cohort, including review of general practice electronic records, is being planned to more accurately quantify the reasons for antibiotic prescribing.
Antibiotic prescription rates in general practice also reflect parental healthcare seeking behaviour and beliefs about antibiotics.42–44 A recent multi-country survey conducted by the WHO showed that public knowledge about appropriate antibiotic use is poor.45 While the prescriber is ultimately responsible for the decision to prescribe an antibiotic, prescribers are influenced by their perceptions of patient expectations for antibiotics.46 Therefore it is important that sufficient educational resources are available to inform parents about when antibiotics are likely to be of use and when they are not, and for general practitioners to address expectations for antibiotics where they perceive them. In NZ, PHARMAC seeks to address this educational need by running an annual campaign during the winter cold and influenza season, aiming to reduce demand for antibiotics for these conditions. Our findings emphasize that, although acceptable prescribing guidelines and educational resources have been developed,40 further work is required to reduce unnecessary antibiotic prescribing.
Our study showed that Māori and Pacific children were dispensed a greater number of antibiotic courses. This finding stands in contrast with previous research by Norris et al.,15 which showed that Māori, and particularly rural Māori children, were less likely to be prescribed antibiotics in the community, but is consistent with the higher rates of infectious disease morbidity that occur in these population groups,47 and may in part reflect clinicians’ awareness of this disparity. The major reasons for the difference between our findings and those of Norris et al.15 are likely to be geographical, as the number of Māori children in GUINZ who lived in rural areas was comparatively small, and the rural areas from which the GUINZ families were recruited were not as remote as the rural areas in the study by Norris et al.15 This likely correlates with lower financial and transportation-related barriers to seeking primary medical care. While we did not identify a statistically significant reduction in access to antibiotics for rural compared with urban Māori children, a trend in this direction was observed. Within the Māori and Pacific ethnic groups, rates of antibiotic dispensing were greatest in children living in the most deprived areas. This suggests that interventions to address high rates of prescribing to Māori and Pacific children could be targeted to those experiencing the most socioeconomic deprivation rather than being applied broadly.
When all ethnicities were considered, children living in rural areas were shown to receive fewer antibiotic courses than children living in urban areas. A number of reasons for this can be hypothesized. Firstly, children in rural communities may lack access to local primary care facilities, particularly outside normal working hours. The need to travel to seek primary care may make rural parents less inclined to seek medical advice for minor ailments.48 Secondly, rural children may have a lower rate of infectious disease due to reduced exposure to infectious contacts or to immunological differences related to growing up in a rural environment.49 Thirdly, rural children in the cohort were more likely to be of European ethnicity and less likely to be in the most socioeconomically deprived deciles, so some degree of unresolved confounding may be occurring.
Key strengths of our study include the large size of the cohort studied, its diverse composition with regard to ethnicity and socioeconomic deprivation, and the high rates of cohort retention and of consent to data linkage. Another major strength is the use of the Pharmaceutical Collection database, which allowed us to accurately quantify antibiotic use without relying on parental recall or individual pharmacy records. Our study also has several important limitations. The number of days of antibiotic dispensed could not be calculated for 19% of antibiotic courses. However, the distribution was tightly clustered around the median of 7 days (IQR 7–8 days), so this is likely to be a reliable estimate of central tendency. As antibiotic courses dispensed on separate days were regarded as separate courses, it is possible that a small number of courses dispensed were in fact an extension of the preceding course. However, the higher course count would still reflect a greater degree of antibiotic exposure in this situation. The Pharmaceutical Collection comprises records of dispensing, not consumption, and some courses of antibiotic dispensed will not have been completed. The Pharmaceutical Collection does not include hospital inpatient dispensing or direct supply by a doctor. Some of the cohort children would have received additional antibiotics through these means, although the amounts are likely to be small in comparison with community antibiotic use. In addition, the NZ Ministry of Health does not have a current estimate of the completeness of the Pharmaceutical Collection with regard to community dispensing, although there is a financial incentive for pharmacists to claim every prescription dispensed, so the level of completeness is likely to be high. One potential contributor to the high prevalence and incidence figures we have obtained relative to comparable international studies may be that the Pharmaceutical Collection offers a more complete record than other data sources. Despite the high rates described, the limitations of the dataset mean that our results are likely to be an underestimate of total antibiotic exposure.
In conclusion, this study of a large cohort of NZ children has shown high levels of antibiotic dispensing during early childhood. The seasonal pattern of antibiotic dispensing suggests that a large proportion of antibiotic prescribing is for self-limiting respiratory illness. Non-European children were dispensed more antibiotic courses than European children. This disparity may be due in part to higher rates of infectious disease morbidity in Māori and Pacific children, but the proportion of antibiotic prescribing that is unnecessary is likely to be similar to that in children of other ethnicities, and this unnecessary prescribing may have long-term consequences for these children, including higher rates of antibiotic-resistant bacterial infection.50 Interventional studies are required to address the challenges of antimicrobial stewardship in primary care, including addressing parental beliefs and expectations regarding antibiotic use, and doctors’ perceptions of the balance of the benefits versus the harms of antibiotic prescribing.
Acknowledgements
The study has been designed and conducted by the Growing Up in New Zealand study team, led by the University of Auckland. The authors thank the families who have participated in the study and acknowledge the contributions of the original study investigators: Susan M. B. Morton, Polly E. Atatoa Carr, Cameron C. Grant, Arier C. Lee, Dinusha K. Bandara, Jatender Mohal, Jennifer M. Kinloch, Johanna M. Schmidt, Mary R. Hedges, Vivienne C. Ivory, Te Kani R. Kingi, Renee Liang, Lana M. Perese, Elizabeth Peterson, Jan E. Pryor, Elaine Reese, Elizabeth M. Robinson, Karen E. Waldie and Clare R. Wall.
Funding
Growing Up in New Zealand has been funded by the New Zealand Ministries of Social Development, Health, Education, Justice, and Pacific Island Affairs; the former Ministry of Science and Innovation, and the former Department of Labour (now both part of the Ministry of Business, Innovation and Employment); the former Ministry of Women’s Affairs (now the Ministry for Women); the Department of Corrections; the Families Commission (now known as the Social Policy Evaluation and Research Unit); Te Puni Kokiri; New Zealand Police; Sport New Zealand; the Housing New Zealand Corporation; and the former Mental Health Commission, The University of Auckland and Auckland UniServices Limited. Other support for the study has been provided by the Health Research Council of New Zealand, Statistics New Zealand, the Office of the Children’s Commissioner and the Office of Ethnic Affairs. M. R. H. is supported by the Auckland Medical Research Foundation Douglas Goodfellow Medical Research Fellowship.
Transparency declarations
None to declare.
Disclaimer
The views reported in this paper are those of the authors and do not necessarily represent the views of the Growing Up in New Zealand investigators.
Supplementary data
Tables S1–S3 are available as Supplementary data at JAC Online.
