


To identify the factors associated with the interindividual pharmacokinetic (PK) variability of micafungin and to evaluate the probability of reaching the previously determined PK/pharmacodynamic efficacy thresholds (AUC/MIC >5000 for non-parapsilosis Candida sp. and ≥285 for Candida parapsilosis) with the recommended 100 mg daily dose in ICU patients with sepsis and mechanical ventilation.
One hundred patients were included and 436 concentrations were available for PK analysis performed with NONMEM software. PTA was determined by Monte Carlo simulations.
Micafungin obeyed a two-compartment model with first-order elimination from the central compartment. Mean parameter estimates (percentage interindividual variability) were 1.34 L/h (34%) for clearance (CL), 11.80 L (38%) and 7.68 L (39%) for central (Vc) and peripheral (Vp) distribution volumes, respectively, and 4.67 L/h (37%) for distribution clearance. CL, Vc and Vp increased by 14% when the albumin level was ≤25 g/L and CL decreased by 25% when SOFA score was ≥10. Body weight was related to CL, Vc and Vp by allometric models. PTA was ≥90% in Candida albicans and Candidaglabrata infections, except when the MIC was ≥0.015 mg/L, and ranged between 0% and 40% for C. parapsilosis infections with MIC ≥0.5 mg/L.
A possible increase in the dose should be evaluated for infections due to C. parapsilosis and for infections due to C. albicans and C. glabrata with MICs ≥0.015 mg/L.
Introduction
Micafungin is an antifungal agent belonging to the echinocandin class. It inhibits the synthesis of β-d-glucan, a major compound of the fungal cell wall, and is primarily used at the recommended 100 mg daily dose for the treatment of candidaemia or invasive candidiasis.1 The pharmacokinetics (PK) of micafungin in non-critically ill patients has been characterized in many studies. Micafungin is known to display linear PK and to have a distribution volume of 0.2 L/kg, which corresponds to the extracellular water, and an elimination half-life of 11–15 h.1–6 The PK of micafungin in ICU patients is less well characterized. A recent study found that micafungin exposure was significantly reduced in ICU compared with non-critically ill subjects.7 Several hypotheses were raised to explain this modified PK [decrease in albumin level, change in metabolic status, impact of disease severity and higher body weight (BW)], but could not be investigated because of the insufficient number of patients. A population PK study conducted on a high number of patients could therefore be interesting in order to identify the determinants of micafungin PK in ICU patients. Such elements could be useful in order to evaluate the possible interest of an adaptation of the dose in this population. Indeed, the efficacy of micafungin is related to its AUC/MIC ratio and efficacy thresholds of 285 for Candida parapsilosis and 5000 for non-parapsilosis Candida sp. were identified in patients with invasive candidiasis.8,9
We therefore conducted a prospective population PK analysis within a large population of ICU patients in order to identify the factors associated with the interindividual variability of PK parameters and to determine the probability of reaching those AUC/MIC efficacy thresholds with the recommended 100 mg daily dose.
Patients and methods
Patients and treatment
The PK study was part of a clinical trial (EMPIRICUS), the main objective of which was to evaluate the benefit of micafungin in patients with suspected but not proven candidiasis. Main inclusion criteria were age >18 years, ICU stay >5 days and mechanical ventilation >4 days before randomization, presence of a systemic inflammatory response syndrome, at least one extradigestive site of Candida sp. colonization and use of broad-spectrum antibacterial agents >4 days during the last 7 days. Patients with evidence of bacterial infections explaining the symptoms, with proven invasive fungal infection, with neutrophil count <500/mm3, who received an antifungal treatment in the week preceding inclusion were excluded.
Patients were randomized in a 1 : 1 scheme to receive either micafungin (100 mg daily dose administered as a 1 h infusion for 14 days) or placebo. More details on the trial design, objectives, inclusion and exclusion criteria can be found elsewhere.10
Ethics
Patients included in the EMPIRICUS clinical trial (registration number NCT01773876) were also included in the ancillary PK study. The study involved 19 ICUs in France and was approved by an authorized ethics committee (Comité de Protection des Personnes CPP Sud Est V) on 7 December 2011 and the French Health Authorities (AFSSAPS) on 2 December 2011. Written informed consent was obtained from all participants or their proxies in case of impaired decision-making capacity at the time of enrolment.
PK sampling and micafungin assay
Five blood samples (5 mL per sample) were drawn per patient in heparinized tubes. The samples were all drawn after the first administration of micafungin: at the end of the infusion; between 30 min and 1 h after the infusion; between 2 and 4 h after the infusion; between 8 and 16 h after the infusion; and just before the second infusion. Based on our stability study, blood samples had to be centrifuged within 1 h at +4°C and the plasma had to be immediately put at +4°C or −20°C, but for no longer than overnight, before being stored at −80°C. Samples were then sent in dry ice to the laboratory every 3 months to be analysed. Micafungin plasma concentration was measured by an HPLC method with fluorometric detection. Briefly, 50 μL of the internal standard working solution (i.e. 20 mg/L buprenorphine in ethanol : water, 50 : 50) was added to 100 μL of plasma samples. Protein precipitation was performed by adding 400 μL of acetonitrile. After 30 s of mixing, the tubes were centrifuged for 5 min at 20 000 g. Fifty microlitres of water was added to 150 μL of the supernatant and the resulting mixture was transferred to autosampler vials and 20 μL was injected into the chromatographic system. The chromatographic column was a Cluzeau Satisfaction C8 Plus (100 × 3 mm, 3 μm; Sainte-Foy-la-Grande, France). The mobile phase consisted of a mixture of two solvents, A and B. Solvent A was water containing trifluoroacetic and formic acid (1 : 0.001 : 0.0001 v : v : v) and triethylamine to adjust the pH value to 3 whereas solvent B was acetonitrile containing 5% (v : v) of water. Initially, the column was equilibrated at 0.80 mL/min with a mobile phase consisting of 65% A and 35% B. One minute after injection, the proportion of B was linearly increased to 80% within 7 min and remained at that proportion for an additional 2 min. After this step, the composition of the mobile phase was set to initial conditions (65% A and 35% B) and the column was equilibrated for 5 min prior to the next injection. Excitation and emission wavelengths were 273 and 464 nm for micafungin and 285 and 350 nm for buprenorphine, respectively. The overall intra- and interday precision and inaccuracy were <13% over the calibration range of the method (0.2–20 mg/L), with 0.2 mg/L being the limit of quantification (LOQ) of the method.
Population PK modelling
A covariate was retained in the model if it produced a minimum decrease in the objective function of 3.84 U (P = 0.05, 1 degree of freedom) and if its effect was biologically plausible. An intermediate multivariate model that included the significant covariates was then obtained. A covariate was retained in the final multivariate model if its deletion from the intermediate model led to a 6.63 point increase in the objective function (P = 0.01, 1 degree of freedom). At each step, the goodness of fit was evaluated by use of a graph of the weighted residuals versus time after administration of the dose (time) or by use of a graph of the weighted residuals versus the predicted concentration. Hyperparameterization was investigated by inspecting the correlation matrix. Individual Bayesian estimates of clearance were used to calculate the individual AUC0-∞ after the first dose.
The accuracy and robustness of the final population model were assessed by a visual predictive check (VPC) based on 500 simulations of the original dataset using the final model and by a bootstrap based on 1000 resamplings of the original dataset.12,13 Lack of bias was also evaluated by inspection of the normalized prediction errors with respect to time after dose and population predictions.14 Goodness of fit was also visualized on the graphs displaying the population predictions or individual predictions versus observed concentrations.
Dose evaluation
The final model was used to evaluate the probability of reaching the AUC/MIC efficacy thresholds that were previously determined for Candida albicans (threshold = 5000), Candida glabrata (threshold = 5000) and C. parapsilosis (threshold = 285) according to the dose, SOFA score, BW, albumin and MIC.8 Five different doses (100, 150, 200, 250 and 300 mg), SOFA < and ≥ 10, albumin ≤ or > 25 g/L, and eight different BW (50, 60, 70, 80, 90, 100, 110 and 120 kg) were investigated. EUCAST MIC clinical breakpoints were used (valid from 16 November 2015; available at http://www.eucast.org/clinical_breakpoints/). For each Candida sp., the highest investigated MIC corresponded to either its respective susceptible/intermediate (S/I) or intermediate/resistant (I/R) micafungin breakpoint. S/I and I/R breakpoints have the same values for C. albicans (0.016 mg/L) and C. glabrata (0.03 mg/L), but are very different for C. parapsilosis (0.002 and 2 mg/L, respectively). Since all MICs of micafungin for C. parapsilosis are above the S/I breakpoint, the I/R breakpoint was used as the highest MIC. One thousand theoretical patients were simulated for each SOFA score/dose/BW/albumin/MIC combination.
Results
Patients
One hundred patients were recruited in the micafungin arm. One patient had to be excluded because the sampling times were not recorded. The demographic characteristics of the remaining 99 patients are displayed in Table 1. Nineteen patients were on intermittent haemodialysis (IHD) and 11 patients were on ECMO during the PK day.
Characteristics of the patients (66 males, 33 females)
| N | Median | Range | |
|---|---|---|---|
| Age (years) | 99 | 61.4 | 29.9–92.7 |
| Body weight (kg) | 99 | 84.5 | 48–141 |
| SOFA score | 99 | 7 | 0–19 |
| Total bilirubin (μmol/L) | 85 | 11.6 | 2.3–6.48 |
| SGOT (IU/L) | 88 | 48 | 11–3304 |
| SGPT (IU/L) | 89 | 39 | 9–758 |
| ALP (IU/L) | 85 | 136 | 54–706 |
| PT (%) | 90 | 72 | 23–100 |
| Total protein (g/L) | 89 | 57 | 32–79 |
| Albumin (g/L) | 76 | 21 | 9–66 |
N, number of available values; SGOT, serum glutamic oxaloacetic transaminase; SGPT, serum glutamic-pyruvic transaminase; ALP, alkaline phosphatase; PT, prothrombin time.
Micafungin assay
Four hundred and thirty six samples were available for analysis. The measured concentrations ranged between 0.31 and 17.8 mg/L. No concentration below the LOQ of the method was observed.
PK modelling
The final model was a two-compartment model with linear elimination from the central compartment. Interindividual variability could be estimated for all the PK parameters: clearance (CL), central distribution volume (Vc), peripheral distribution volume (Vp), distribution clearance (Q), but no covariance between Etas could be estimated. Among the investigated covariates (BW, age, sex, SGOT, SGPT, prothrombin time, ALP, total bilirubin, total protein, albumin and SOFA score), BW, albumin and SOFA score were found to significantly influence the interindividual variability of CL, Vc and Vp.
A proportional residual variability was found to best describe the data. All parameter values of the final model and bootstrap results are given Table 2. Eta shrinkage was equal to 4.0%, 6.5%, 30.0% and 58.4% for CL, Vc, Vp and Q, respectively. Epsilon shrinkage was equal to 28.9%. The highest correlation observed between two different parameters was 0.79.
Mean parameter estimates and relative standard deviations for the final model
| Original dataset | Bootstrap | |||
|---|---|---|---|---|
| Parameter | mean estimate | RSD % | mean | RSD % |
| CL (L/h) | 1.34 | 7.5 | 1.34 | 7.9 |
| Vc (L) | 11.8 | 8.8 | 11.6 | 9.5 |
| Vp (L) | 7.68 | 8.9 | 7.75 | 9.2 |
| Q (L/h) | 4.67 | 11.8 | 4.82 | 13.3 |
| θBW,CL | 0.59 | 22.0 | 0.58 | 30.6 |
| θBW,Vc | 0.61 | 29.5 | 0.59 | 37.8 |
| θBW,Vp | 0.67 | 37.3 | 0.69 | 40.4 |
| θALB,CL,Vc,Vp | 1.14 | 7.0 | 1.14 | 7.7 |
| θSOFA,CL | 0.75 | 8.0 | 0.75 | 7.89 |
| ωCL | 0.114 | 22.8 | 0.109 | 11.9 |
| ωVc | 0.143 | 25.9 | 0.149 | 15.9 |
| ωVp | 0.150 | 32.0 | 0.134 | 23.6 |
| ωQ | 0.139 | 84.1 | 0.093 | 66.6 |
| σ | 0.0144 | 43.7 | 0.0133 | 22.8 |
CL, clearance; Vc, central distribution volume; Vp, peripheral distribution volume; Q, distribution clearance; θBW,CL, influential factor of BW on CL; θBW,Vc, influential factor of BW on Vc; θBW,Vp, influential factor of BW on Vp; θALB,CL,Vc,Vp, influential factor of albumin on CL, Vc and Vp when albumin ≤25 g/L; θSOFA,CL, influential factor of SOFA on CL when SOFA score ≥10; ωCL, interindividual variability of CL; ωVc, interindividual variability of Vc; ωVp, interindividual variability of Vp; ωQ, interindividual variability of Q; σ, proportional residual variability; RSD, relative standard deviation.
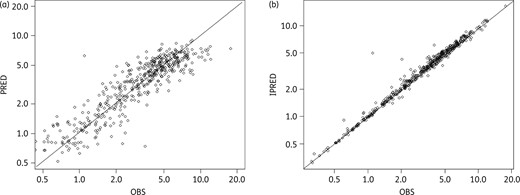
Goodness-of-fit curves representing (a) the population predictions (PRED) versus observed concentrations (OBS) and (b) the individual predictions (IPRED) versus OBS. Solid diagonal line shows x = y.
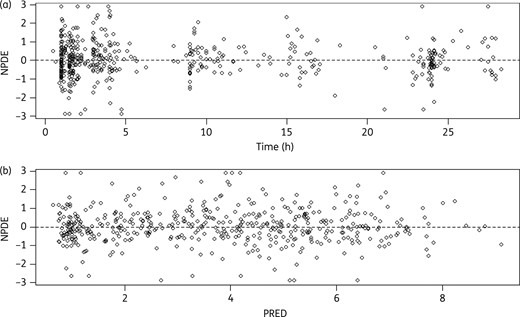
Lack of bias in the final model evidenced by the normalized prediction errors (NPDE) with respect to (a) time after dose (Time) and (b) population predictions (PRED).
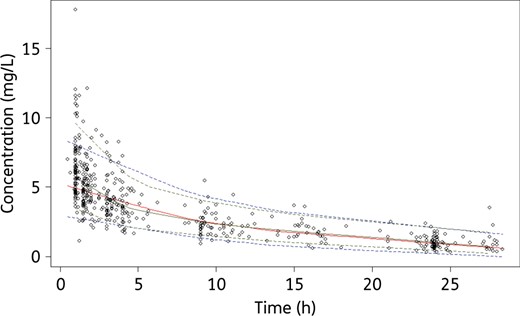
Visual predictive checks with the final model. Circles are the observed concentrations. The upper dotted blue, solid red and lower dotted blue lines represent the 97.5th, 50th and 2.5th percentiles obtained from the simulated concentrations. The upper dotted green line, solid green line and lower dotted green line represent the 97.5th, 50th and 2.5th percentiles obtained from the observed concentrations. This figure appears in colour in the online version of JAC and in black and white in the print version of JAC.
Dose evaluation
PTAs were first calculated in case of albumin >25 g/L.
C. albicans and C. glabrata
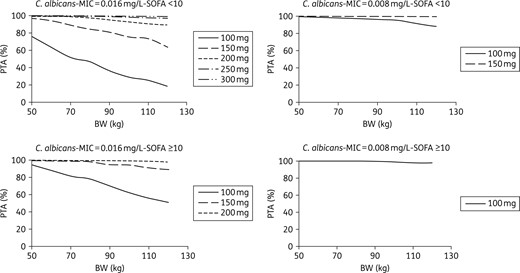
PTA for C. albicans with an MIC equal to 0.016 mg/L (the EUCAST clinical breakpoint) or 0.008 mg/L, according to dose, body weight and SOFA score in ICU patients with albumin >25 g/L.
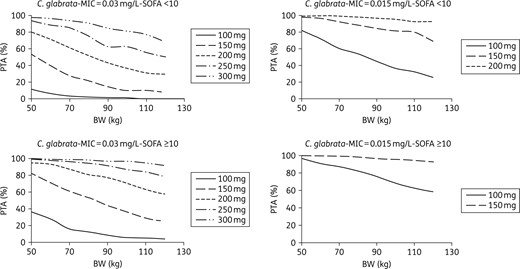
PTA for C. glabrata with an MIC equal to 0.03 mg/L (the EUCAST clinical breakpoint) or 0.015 mg/L, according to dose, body weight and SOFA score in ICU patients with albumin >25 g/L.
C. parapsilosis
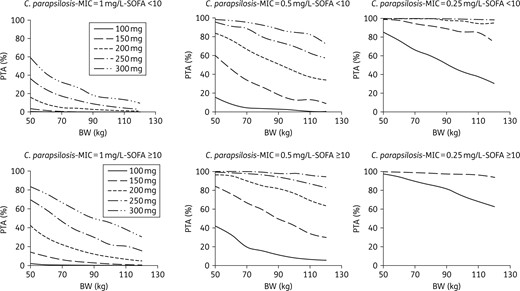
PTA for C. parapsilosis with an MIC equal to 1 mg/L (half the EUCAST clinical breakpoint), 0.5 mg/L or 0.25 mg/L, according to dose, body weight and SOFA score in ICU patients with albumin >25 g/L.
Lower PTAs were obtained in case of albumin ≤25 g/L. These results are available in Figures S1 to S3 (available as Supplementary data at JAC Online).
Discussion
This is the first population PK model for micafungin in ventilated ICU patients with sepsis. The model accurately described the data and the results are very consistent with the PK parameters that were recently reported in 20 ICU patients.7 Indeed, the mean of the individual values for CL and total distribution volume (Vc + Vp) in the present study are similar to the values described in the paper by Lempers et al.7 (1.47 versus 1.5 L/h for CL and 22.4 versus 25.6 L for total distribution volume). Because our parameters were calculated after the first dose, this similarity with the steady-state parameters obtained in the Lempers et al. study supports the linear PK profile of micafungin, which allows the prediction of steady-state exposures using the PK parameters obtained after the first dose. Our results confirm that ICU patients have lower exposure compared with healthy subjects or even non-ICU patients (Table 3). Since ICU patients are often characterized by hypoalbuminaemia and micafungin is very highly bound (99.85%) to albumin,1 a possible explanation for this lower exposure was a decrease in protein binding, as such a decrease should be associated with an increase in total clearance.15 Such a phenomenon was first observed for micafungin in patients with severe hepatic dysfunction.6 Our results support this hypothesis as an albumin level ≤25 g/L was associated with an increase in micafungin clearance. Interestingly, this 25 g/L value is roughly the same cut-off (i.e. 23.6 g/L) as was found to be associated with a change in the concentration of caspofungin, another echinocandin highly bound to albumin.16 Theoretically, an increase in total clearance secondary to a decrease in protein binding has no impact on free clearance, so the free concentration remains constant and no consequence on efficacy is expected.15 Since free micafungin concentration was not measured in the present study, the lack of relationship between the albumin level and free clearance of micafungin could not be investigated and should be further confirmed. However, because the influence of protein binding on efficacy is not fully understood, albumin levels ≤25 and >25 g/L were considered for the simulations. Two other factors were found to explain the interindividual variability of micafungin PK parameters: BW and SOFA score. Although the influence of BW has already been shown in several studies,17–19 this is to our knowledge the first time the influence of SOFA score is reported. SOFA is a hybrid score, ranging between 0 and 24, that takes into account renal, hepatic, cardiac, respiratory, CNS and coagulating functions, which consequently reflects the general status of the organs and is predictive of outcome in critically ill patients. Indeed, a SOFA score ≥11 was found to be associated with an increase in the mortality rate.20 Interestingly, this cut-off value of 11 is similar to the value of 10 that we found to be associated with a mean 25% decrease in micafungin clearance. Micafungin is partially metabolized at the hepatic level by several enzymatic pathways (arylsulfatase, catechol-O-methyl-transferase and cytochromes P450) and is also eliminated unchanged via biliary excretion.1,2 It is therefore possible that a given degree of organ failure, reflected by the SOFA score, is responsible for an alteration of micafungin metabolism or biliary excretion. Of note, bilirubin, which is integrated into the SOFA score, was individually not found to influence micafungin clearance, as was also the case for the other covariates supposed to reflect hepatic status (SGOT, SGPT, ALP and prothrombin time). The likely reason is that these covariates do not precisely reflect the elimination pathways of micafungin, so their clearance rates may not parallel micafungin clearance. Other covariates that were found not to influence micafungin PK were IHD and ECMO. The lack of influence of IHD can be explained by the high protein binding of the drug and was already evidenced in patients under haemodialysis filtration.21,22 To our knowledge, this is the first report on micafungin PK during ECMO. However, lack of influence of ECMO on caspofungin was previously reported.23 The octanol/water (logP) partition coefficient is thought to be related to the ability of a drug to be sequestered or not by the ECMO circuit.23 Like caspofungin, micafungin displays a low logP (−1.5), evidencing that micafungin is freely soluble in water and is consequently not expected to interact with the organic material of the ECMO circuit.
Mean micafungin AUC (mg · h/L) with respect to albumin and SOFA score for a typical patient of 84 kg and comparison with literature data (either AUC0–∞ after the first dose or AUC0–24 at steady-state)
| Present study | |||||
|---|---|---|---|---|---|
| SOFA score | albumin ≤25 g/L | albumin >25 g/L | ICU patients | Non-ICU patients | Healthy subjects |
| ≥10 | 87.3 | 99.5 | 78a | 100b | 134.5c |
| <10 | 65.5 | 74.6 | |||
| Present study | |||||
|---|---|---|---|---|---|
| SOFA score | albumin ≤25 g/L | albumin >25 g/L | ICU patients | Non-ICU patients | Healthy subjects |
| ≥10 | 87.3 | 99.5 | 78a | 100b | 134.5c |
| <10 | 65.5 | 74.6 | |||
Monte Carlo simulations showed that the current 100 mg dose would provide a high probability of reaching the target AUC/MIC in patients with infections due to Candida albicans or C. glabrata, provided the MIC is <0.016 mg/L for C. albicans and <0.015 mg/L for C. glabrata (Figures 4 and 5). However, not attaining the target AUC/MIC does not mean the treatment will be inefficient. Indeed, in the study that evidenced these AUC/MIC thresholds, the success rate was 86.7% in patients with AUC/MIC ≤5000. Besides, the same study also found that reaching too high AUC/MIC ratios (i.e. >12 000) was associated with a decrease in the success rate that reached approximately the same value as the one observed for AUC/MIC ≤5000.8 Because of this, a systematic increase in the dose cannot be proposed without a prospective evaluation of its effect in terms of efficacy/safety. Such studies could nevertheless be interesting in patients for whom the 100 mg dose is associated with a very low PTA: patients with infection due to C. glabrata with MIC ≥0.015 mg/L and patients with infection due to C. albicans with MIC = 0.016 mg/L. Such cases could be quite frequent since, according to the MIC distributions displayed by EUCAST: (i) 27% of the C. albicans strains that are considered susceptible to micafungin have an MIC of 0.016 mg/L; and (ii) 33% of the C. glabrata strains susceptible to micafungin have an MIC ≥0.015 mg/L. The situation is clearer for C. parapsilosis as <1% of its strains have an MIC ≤0.125 mg/L. Consequently, the current 100 mg dose provides a very low PTA in the great majority of the patients, a result that was also found in a recent study.24 This strongly supports the use of higher doses, despite an efficacy rate of 86% was nevertheless observed in patients not attaining the AUC/MIC efficacy threshold for C. parapsilosis (versus 100% for the patients attaining this threshold).8
In conclusion, the present study reported the first population PK model for micafungin in ICU patients with sepsis and mechanical ventilation. Micafungin PK was found to be related to BW, to an albumin level greater or inferior to 25 g/L and to a SOFA score greater or inferior to 10. The recommended 100 mg dose is associated with a very low probability of attaining the target AUC/MIC value in the case of infection due to C. albicans or C. glabrata with MIC ≥0.015 mg/L as well as in almost all cases of infection due to C. parapsilosis. The possibility of higher micafungin doses in these patients should be evaluated.
Funding
The study was sponsored by the University of Grenoble 1/Albert Michallon university hospital. A research grant was obtained from Astellas company.
Transparency declarations
J.-F. T. received lecture fees from Gilead, Pfizer, Merck, Astellas. His university and research organization received research grants from Astellas, Gilead, Merck and Pfizer companies. He participated in the scientific committee of epidemiological studies organized by Astellas and Merck. M. Cornet has received research grants from Pfizer. J. P. G. received lecture fees from Astellas, Gilead, Merck and Pfizer, and participated in the scientific committee of epidemiological studies organized by Astellas and Merck. V. J. is a member of Astellas and Basilea scientific committees, received lecture fees from Tibotec, Basilea and BMS and received research grants from Biocodex and Sanofi. M. W. received lectures fees from Astellas, Gilead, Merck, Pfizer, Aventis, Cubist and Astra-Zeneca. All other authors: none to declare
Supplementary data
Figures S1 to S3 are available as Supplementary data at JAC Online (http://jac.oxfordjournals.org/).
Acknowledgements
We thank Mireille Cammas for her technical assistance in the realization of the micafungin assay.
Members of the EMPIRICUS Study Group
Investigators (in alphabetical order)
CHU A Michallon, Grenoble: Jean François Timsit, Rebecca Hamidfar-Roy. CHI Andre Gregoire, Montreuil: Magalie Ciroldi. CHU Beaujon, Clichy: Catherine Paugam-Burtz, Arnaud Foucrier. CHU J Minjoz, Besancon: Jean Christophe Navellou. CHU Bichat, Paris: Michel Wolff, Jean-Francois Timsit, Lila Bouadma, Bruno Mourvillier, Romain Sonneville, Sarah Chemam. CHU Bordeaux: Didier Gruson. CHU G Montpied, Clermont-Ferrand: Bertrand Souweine, Alexandre Lautrette. CHU Dijon: Pierre Emmanuel Charles, Rémi Bruyere, Maël Hamet. CHU Lyon, Hôpital Edouard Herriot 1: Bernard Allaouchiche, Guillaume Christian, Charles-Eric Ber, Johanne Prothet, Thomas Rimmele. CHU Lyon, Hopital Edouard Herriot 2: Laurent Argaud, Marie Simon, Martin Cour, Romain Hernu. CHU Montpellier 1: Samir Jaber, Boris Jung, Mathieu Conseil, Yannael Coisel, Fouad Belafia. CHU Montpellier 2: Kada Klouche, Laurent Amigues, Sonia Machado, Marianne Serveaux. CHU Pitie-Salpetriere, Paris: Jean Chastre, Jean-Louis Trouillet. CHU Reims: Joël Cousson, Pascal Raclot, Thierry Floch. CHU St Etienne: Fabrice Zeni, Michael Darmon, Matthias Pichon, Maud Coudrot, Sebastien Ninet, Eric Diconne. CHU St Louis, Paris: Benoit Schlemmer, Elie Azoulay, Virginie Lemiale, Nicolas Maziers. CHU Strasbourg: Ferhat Meziani, David Schnell, Julie Boisrame-Helms, Raluca Neagu-Anca, Xavier Delabranche, Olivier Martinet. Fondation Hopital St Joseph, Paris: Maité Garrouste-orgeas, Benoit Misset. CH André Mignot, Versailles: Fabrice Bruneel, Virginie Laurent, Guillaume Lacave, Jean-Pierre Bedos.
Study monitors, research nurses and biohygiene technicians
Khadija Hammi, Lenka Styfalova, Joelle Fritzsch , Sophie Letrou, Lucie Estevez, Mireille Adda, Therese Devaux, Celine Dubien, Soumia Bayarassou, Catherine Jouvene Faure, Sylvie de La Salle, Albert Prades, Annie Rodriguez, Pierre Meur, Magda Warchol, Hanane El Haouari, Igor Theodose, Julien Fournier and Sebastien Cavelot.
Pharmacists
Lilia Bakir Kodja, Marie Joyeux Faure, Sophie Maurisot, Carole Labat, Frédéric Tacco, Sonia Roos, Karima Dupre, Malek Abazid, Michele Essert, Philippe Arnaud, Emmanuelle Papy, Bellabes Ghezzoul, Olivier Gerbouin, Sandrine Corny Peccoux, Philippe Fagnoni, Anne Millaret, Christine Pivot, Cecile Gerard, Cyril Breuker, Audrey Castet, Fanny Charbonnier, Maryline Legrand, Julia Mordini, Isabelle Madelaine Chambrin, Anne Hutt Clauss, Mohamed Cherifi, Anne Pattyn and Camille Pichard.
Mycology
Murielle Cornet, Christian Zumbo, Aurélie Smets, Eliane Benveniste, Fréderic Grenouillet, Christian Chochillon, Isabelle Accoberry, Denis Pons, Natacha Mrozek, Frédéric Dalle, Anne-lise Bienvenu, Stephane Picot, Francoise Beyerle, Nathalie Bourgeois, Arnaud Fekkar, Dominique Toubas, Hélène Raberin, Ermanno Candolfi, Valérie Bru, Marie Dominique Kitzis, Yaye Senghor, Catherine Palette and Odile Eloy.
Statistics
Stéphane Ruckly and Aurélien Vesin.
Safety Monitoring Board
Jean-Paul Mira, Jean-Ralph Zahar, Edith Shir, Dominique Larrey and Jean-Pierre Zarskii.
References
Author notes
Members are listed in the Acknowledgements.
