


Abstract
Pathophysiological changes in critically ill patients can cause severely altered pharmacokinetics and widely varying antibiotic exposures. The impact of altered pharmacokinetics on bacterial killing and resistance has not been characterized in the dynamic hollow-fibre in vitro infection model (HFIM).
A clinical Pseudomonas aeruginosa isolate (piperacillin MIC 4 mg/L) was studied in the HFIM (inoculum ∼107 cfu/mL). Pharmacokinetic profiles of three piperacillin dosing regimens (4 g 8-, 6- and 4-hourly, 30 min intravenous infusion) as observed in critically ill patients with augmented renal clearance (ARC), normal renal function or impaired renal function (creatinine clearances of 250, 110 or 30 mL/min, respectively) were simulated over 7 days. The time courses of total and less-susceptible populations and MICs were determined. Mechanism-based modelling was performed in S-ADAPT.
For all regimens with ARC and regimens with 8- or 6-hourly dosing with normal renal function, initial killing of ≤∼2 log10 was followed by regrowth to 108–109 cfu/mL at 48 h. For 8- and 6-hourly dosing at normal renal function, the proportion of less-susceptible colonies increased ∼10–100-fold above those in ARC and control arms. Regimens achieving an fCmin of ≥5× MIC resulted in bacterial killing of 3–4 log10 without regrowth and suppressed less-susceptible populations to ≤∼2 log10. The mechanism-based model successfully quantified the time course of bacterial growth, killing and regrowth.
Only high piperacillin concentrations prevented regrowth of P. aeruginosa. Individualized dosing regimens that account for altered pharmacokinetics and aim for higher-than-standard antibiotic exposures to achieve an fCmin of ≥5× MIC were required to maximize bacterial killing and suppress emergence of resistance.
Introduction
Effective treatment of infections in critically ill patients is a persisting and major challenge for clinicians in ICUs. The morbidity and mortality associated with conditions such as severe sepsis and septic shock remains high1 and optimized antibiotic therapy is considered a key intervention that can reduce this healthcare burden.2 To date, robust data defining how to optimize dosing regimens in the ICU are lacking. A large pharmacokinetic point-prevalence study3 and a recent survey4 have demonstrated that clinicians predominantly rely on the product information for the majority of antibiotic dosing regimens used in critically ill patients. The problem with this approach is 2-fold. Firstly, less-susceptible pathogens are more common in ICUs than in other ward settings.5,6 Secondly, pathophysiological changes in critically ill patients, including changes in renal function, can lead to severely altered antibiotic pharmacokinetics and thus result in considerably different antibiotic exposures compared with antibiotic exposures observed in non-critically ill patients, including for piperacillin (see below).2,3,7,8 Additionally, clinicians should be adapting dosing regimens to ensure clinical cure as well as minimizing the emergence of antibiotic resistance, given this is thought to occur in ∼10% of antibiotic treatment courses in patients.9
The Gram-negative pathogen Pseudomonas aeruginosa is a common cause of serious infections such as bacteraemia, lung infections and intra-abdominal infections in critically ill patients.6,10 Infections caused by this organism are commonly treated with the β-lactam antibiotic piperacillin, often when coformulated with tazobactam and sometimes as part of combination therapy.3 To optimize therapy with β-lactams, traditional pharmacokinetic/pharmacodynamic approaches seek to maximize the fT>MIC (fraction of dosing interval where the free, i.e. unbound, concentration remains above 1× the MIC for the infecting pathogen). However, as piperacillin is eliminated primarily via the kidneys, its clearance is substantially changed in the presence of altered renal function, including augmented renal clearance (ARC).11 Where substantially enhanced antibiotic elimination occurs, as is the case in ARC, the fT>MIC is considerably reduced. Given P. aeruginosa can rapidly develop resistance to piperacillin following suboptimal antibiotic exposures, this increases the risk of therapeutic failure and/or the emergence of resistance.12,13 The dynamic hollow-fibre in vitro infection model (HFIM) can mimic clinical drug exposures over typical durations of therapy (days to weeks).14,15 Therefore, it is able to describe bacterial killing and the emergence of resistant bacteria during different antibiotic dosing regimens to mimic patients with different clinical characteristics. This includes patients with very high (as seen in ARC)16,17 or impaired (as seen in acute kidney injury)18 drug clearances. The aim of this study was to use the HFIM to characterize the effect of different exposures of piperacillin that occur in critically ill patients on bacterial killing and the emergence of resistance in P. aeruginosa. That is, specifically exposure in patients with ARC, normal renal function and impaired renal function following intravenous administration of three clinically utilized dosing regimens of piperacillin. An additional objective was to develop a mechanism-based mathematical model that can quantitatively describe the time course of these effects.
Materials and methods
Antibiotic, media, bacterial isolate and susceptibility testing
For all drug-containing experiments, piperacillin/tazobactam (4 g of piperacillin/0.5 g of tazobactam per vial, lot number 7103856; Aspen, New South Wales, Australia) was used. Throughout this study, the stated dose refers to that of piperacillin. Antibiotic stock solutions were prepared in Milli-Q water, sterilized by passage through a 0.22 μm polyvinylidene fluoride (PVDF) syringe filter and stored at −80°C. Stocks were thawed immediately prior to each experiment. Viable counting was performed on cation-adjusted Mueller–Hinton agar (CAMHA; containing 25 mg/L Ca2+ and 12.5 mg/L Mg2+). Drug-containing agar plates were prepared by adding appropriate volumes of antibiotic stock solution to CAMHA (lot number 5030699; BD, Sparks, MD, USA). HFIM studies were performed using CAMHB (lot number 3322206; BD, Sparks, MD, USA) containing 25 mg/L Ca2+ and 12.5 mg/L Mg2+.
Clinical isolate P. aeruginosa 1280 (taken from a critically ill patient with a soft tissue infection, Royal Brisbane and Women's Hospital, Brisbane, Queensland, Australia) was used in this study. The MIC of piperacillin/tazobactam prior to, and following (see below), drug exposure was determined in duplicate on separate days using agar dilution as per CLSI guidelines.19 Susceptibility and resistance were defined as an MIC ≤16 mg/L and an MIC >16 mg/L, respectively.20 The isolate was stored in CAMHB with 20% glycerol at −80°C.
HFIM
The set-up of an HFIM has been described previously.21,22 Cellulosic cartridges (C3008-1; FiberCell Systems, Frederick, MD, USA) were utilized for all experiments. The HFIM was maintained at 36°C in a humidified incubator. An initial inoculum of ∼107 cfu/mL was prepared by growing one colony overnight in CAMHB at 36°C (stock solution). The OD of the bacterial stock solution was measured spectrophotometrically, a bacterial suspension of ∼107 cfu/mL prepared and 17 mL injected into each HFIM cartridge. Experiments were conducted over 7 days (167 h). Samples (1.0 to 1.5 mL) were collected aseptically from the cartridge at 0, 2, 5, 7, 13, 23, 29, 31, 47, 53, 71, 95, 119, 143 and 167 h for viable counting. To reduce antibiotic carryover, samples were twice centrifuged at 4000 g for 5 min with the supernatant decanted and the pellet resuspended in pre-warmed sterile saline. The overall drug dilution factor was ≥250-fold for the two sequential centrifugation and resuspension processes, assuring that the piperacillin concentrations were negligible after washing. Preliminary studies indicated that virtually no loss of bacteria occurred during this process. Samples of bacterial cell suspension were then manually plated onto CAMHA containing no drug (100 μL plated) and piperacillin at 3× and 5× MIC (12 and 20 mg/L; 200 μL plated, see emergence of resistance below). This plating method yielded a limit of counting of 1.0 log10 cfu/mL for drug-free plates (equivalent to one colony per plate) and 0.7 log10 cfu/mL for drug-containing plates. Agar plates were incubated at 36°C for 48 h and colonies counted manually.
Experimental design and simulated piperacillin regimens
Utilizing a previously published clinical study that measured unbound piperacillin and developed a population pharmacokinetic model,11 the free (non-protein-bound) serum concentration–time profiles as observed in critically ill patients with different drug clearances (driven by renal function) were simulated. Three different clinically utilized dosing regimens of piperacillin in critically ill patients were simulated. Specifically, 4 g of piperacillin administered via a 30 min intravenous infusion given 8-, 6- or 4-hourly.23 Berkeley Madonna (version 8.3.18) was used for simulations. These in silico simulations were utilized to understand the likely impact of renal function on pharmacokinetics and to optimize the HFIM designs.
Based on the in silico simulations, the piperacillin concentration–time profiles were then executed in the HFIM by adjusting flow rates to replicate the targeted renal function (drug clearance) and half-lives. The concentration–time profiles in the HFIM represented patients with ARC (CLCR 250 mL/min, piperacillin clearance 43 L/h, t1/2 0.8 h), patients with normal renal clearance (CLCR 110 mL/min, piperacillin clearance 19 L/h, t1/2 1.4 h) and patients with renal impairment (CLCR 30 mL/min, piperacillin clearance 5.2 L/h, t1/2 5.3 h) (Table 1). No loading dose was administered. For each CLCR, a no-treatment growth control was included giving a total of 11 experimental treatment or control arms. The 6-hourly regimen was not evaluated at CLCR = 30 mL/min as we considered the highest and lowest doses at this CLCR to provide sufficient data.
Piperacillin/tazobactam dosing regimens and pharmacokinetic parameters for three different simulated levels of renal function used in the HFIM against P. aeruginosa 1280 (MIC 4 mg/L); all values presented refer to simulations at steady-state
| Piperacillin regimena | CLCRb (mL/min) | CLpiperacillin (L/h) | t1/2c (h) | fCmax (mg/L) | fCmin (mg/L) | fCmin/MIC | fCss,avg (mg/L) | % fT>MIC | fAUC24 (mg · h/L) | Outcome |
|---|---|---|---|---|---|---|---|---|---|---|
| 4 g 8-hourly | 250 | 43 | 0.8 | 74 | 0.02 | <0.01 | 12 | 42 | 279 | regrowth, no resistance |
| 4 g 6-hourly | 250 | 43 | 0.8 | 74 | 0.29 | 0.07 | 16 | 56 | 373 | regrowth, no resistance |
| 4 g 4-hourly | 250 | 43 | 0.8 | 75 | 2.2 | 0.55 | 23 | 85 | 559 | regrowth, no resistance |
| 4 g 8-hourly | 110 | 19 | 1.4 | 94 | 2.4 | 0.60 | 26 | 86 | 633 | regrowth, with resistance |
| 4 g 6-hourly | 110 | 19 | 1.4 | 97 | 6.5 | 1.6 | 35 | 100 | 845 | regrowth, with resistance |
| 4 g 4-hourly | 110 | 19 | 1.4 | 107 | 19 | 4.8 | 53 | 100 | 1266 | suppression of any regrowth |
| 4 g 8-hourly | 30 | 5.2 | 5.3 | 153 | 57 | 14.3 | 97 | 100 | 2340 | suppression of any regrowth |
| 4 g 4-hourly | 30 | 5.2 | 5.3 | 244 | 154 | 38.5 | 195 | 100 | 4680 | suppression of any regrowth |
t1/2, elimination half-life; fCmax, unbound maximal concentration; fCmin, unbound minimal concentration; fCss,avg, unbound average concentration at steady-state; %fT>MIC, the percentage of time that unbound concentrations exceeded the MIC; fAUC24, the area under the unbound piperacillin concentration–time curves over 24 h.
aInfusion time for all regimens was 0.5 h.
bA CLCR of 250 mL/min represents patients with ARC, a CLCR of 110 mL/min represents patients with normal renal clearance and a CLCR of 30 mL/min represents patients with renal impairment.
cSamples for pharmacokinetic determinations were collected at 0.66, 1, 2, 3.5, 5, 7, 8.66, 13, 23, 24.66, 47, 48.66, 49, 50, 51.5, 53, 55, 71, 72.66, 95, 119, 143 and 167 h for the CLCR of 250 mL/min. For the CLCR of 110 and 30 mL/min, samples were collected as per the 250 mL/min CLCR plus at 29 and 31 h. For growth controls, flow rates for the respective renal functions were maintained.
Mutant frequency and emergence of resistance studies
In order to determine the abundance of bacteria in the population that are less susceptible or resistant to piperacillin before and following the commencement of treatment, mutant frequencies were determined at baseline (i.e. 0 h) and at 23, 47, 71, 119 and 167 h. Mutant frequencies were determined by plating 200 μL of appropriately diluted log-phase growth suspension onto CAMHA containing no antibiotic and piperacillin at 3× and 5× MIC (i.e. 12 and 20 mg/L, representing one multiple of the MIC either side of the EUCAST MIC breakpoint). Agar plates were incubated for 2 days and mutant frequencies calculated as the difference between the log10 cfu/mL on antibiotic-containing agar plates and the log10 cfu/mL on drug-free plates at the same observation time. To confirm a change in the MIC from baseline, MICs were also determined at 47 and 167 h as described above by taking a subset of at least three colonies from antibiotic-free and antibiotic-containing plates.
Piperacillin drug assay for pharmacokinetics
Samples (1.0 mL) were collected in duplicate from the outflow of the central reservoir of the HFIM at various times throughout the experiment (Table 1) and placed into cryovials. All samples were immediately stored at −80°C until assayed. Concentrations of piperacillin were measured in CAMHB at ambient temperature using a validated HPLC-ultraviolet (HPLC-UV) method. The HPLC-UV system consisted of a Shimadzu Prominence LC-20AD liquid chromatograph, SIL-20ACHT autosampler and SPD-20A UV detector (Shimadzu, Tokyo, Japan). To a 100 μL sample, 10 μL of 1 mg/mL benzylpenicillin (internal standard) and 500 μL of acetonitrile were added and the tube was vortex mixed for 3 s before centrifuging for 5 min at 13 000 g. Then, 600 μL of supernatant was removed and 500 μL of dichloromethane added to partition lipid soluble components. The aqueous layer was isolated by centrifugation (5 min at 13 000 g) and an aliquot (5 μL) injected onto a Waters XBridge 2.5 μm reverse-phase C18 column (2.1 × 30 mm; Waters, New South Wales, Australia) heated to 50°C. The mobile phase consisted of 15% acetonitrile and 85% 100 mM phosphate buffered to pH 3.0; the flow rate was 0.4 mL/min, with detection of both piperacillin and benzylpenicillin at 210 nm. The run time was 15 min. The assay range for piperacillin was 0.5–500 mg/L; samples were diluted when the expected piperacillin concentrations were higher than the upper limit of quantification. Unknown samples were assayed in batches alongside calibration and quality control samples and results subjected to batch acceptance criteria. The assay method was validated for linearity, lower limit of quantification and precision and accuracy using both the US FDA and EMA criteria for bioanalysis.24,25 The precision was within 12.9% and accuracy was within 5.1% at 2, 20 and 200 mg/L.
Pharmacodynamic modelling
A mechanism-based mathematical model was developed to quantitatively characterize the time course of bacterial killing and regrowth of P. aeruginosa 1280 for the tested piperacillin dosing regimens and resultant pharmacokinetic profiles. All pharmacokinetic and pharmacodynamic observations were fitted simultaneously utilizing S-ADAPT software (version 1.57) with the Monte Carlo parametric expectation maximization algorithm (importance sampling, pmethod = 4).26,27 SADAPT-TRAN was utilized for pre- and post-processing.28 Models were evaluated based on the S-ADAPT objective function value (−1 × log-likelihood), standard diagnostic plots, the coefficient of correlation and visual predictive checks.29
Models with one, two or three bacterial subpopulations with different susceptibilities to piperacillin were evaluated. Given the mechanism of action of penicillins, models including inhibition of growth, inhibition of the probability of successful replication, or both, were tested as described previously.30,31
At low cfuALL, REP approaches 2, which represents 100% probability of successful replication. As cfuALL approaches cfumax, REP approaches 1. This represents 50% probability of successful replication where bacteria continue to transition between states 1 and 2, but the total viable count remains constant.
The bacterial concentrations of the intermediate and the resistant subpopulations were described accordingly. Different Imaxk12, IC50k12 and IC50Rep parameters described the lower susceptibilities of the intermediate and resistant subpopulations compared with the susceptible subpopulation, as described above.
The total inoculum and the mutation frequencies of the intermediate and the resistant subpopulations were estimated.30 Each of the processes included in the model were necessary to describe the data and this was confirmed by leaving out one process at a time. The biological variability between the viable count profiles (between-curve variability) was assumed to be log-normally distributed for all parameters except for those that were constrained between 0 and 1 and therefore logistically transformed. The between-curve variability expressed as a coefficient of variation was ≤15% for all parameters estimated on normal scale and had a variance of ≤0.25 for all parameters that were estimated on log10 scale or logistically transformed. This was in agreement with previously published work.30 All log10 viable counts were simultaneously fitted using an additive residual error model on log10 scale.
Results
Pharmacokinetic profiles
The observed pharmacokinetic profiles in the HFIM samples adequately matched the target profiles for each dosing regimen at the three different drug clearances (r = 0.97). Typical profiles showing the relationship between targeted and observed concentrations are shown in Figure 1. While the observed concentrations were slightly lower than targeted for the first 8 h with the renal impairment simulations (CLCR of 30 mL/min), the model fitted concentration–time profiles (Figure 1) were used in the pharmacodynamic model (see below). The coefficient of correlation for the observed versus individual fitted concentrations was 0.988 (Figure 2). Thus, the small deviations from the targeted concentrations were accounted for by the quantitative modelling of the pharmacokinetic/pharmacodynamic relationship and antibacterial effects of piperacillin.
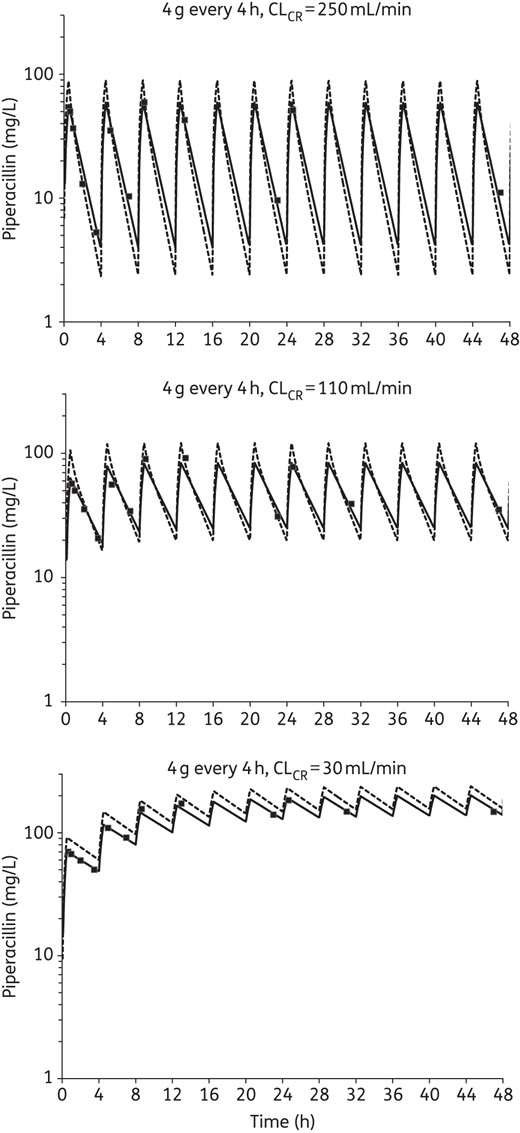
Typical simulated pharmacokinetic profiles showing the relationship between targeted (broken lines), measured (filled squares) and model fitted (continuous lines) concentrations of piperacillin in the HFIM at each CLCR. Each profile shown is for the most intensive dosing regimen (4-hourly administration). Note that the last pharmacokinetic sample taken within a dosing interval occurred ≥30 min prior to the next dose and the first sample taken within a dosing interval occurred ≥10 min after the end of the infusion.
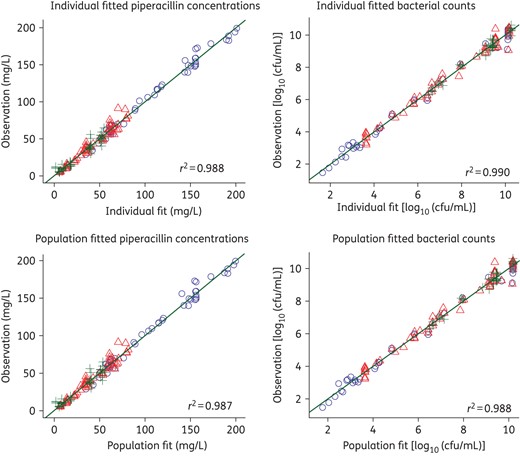
Observed versus individual fitted (top) and population fitted (bottom) viable counts for three different piperacillin dosing regimens and three different renal functions (circles, CLCR 30 mL/min; triangles, CLCR 110 mL/min; plus signs, CLCR 250 mL/min). This figure appears in colour in the online version of JAC and in black and white in the print version of JAC.
Microbiological response and emergence of resistance
Changes in viable cell counts with each degree of renal function (CLCR of 250, 110 or 30 mL/min) are shown in Figure 3. Changes in the total and less-susceptible populations, mutant frequencies and MICs are shown in Figure 4 and Tables 2 and 3. The log10 mutant frequency before treatment (0 h) was <−6.20 to <−6.70 on agar containing 3× and 5× the piperacillin MIC (Table 2). At baseline, no more than one colony was found growing on these antibiotic-containing agar plates for any regimen and CLCR, with no colonies detected in most cases (Figure 4).
Log10 mutant frequencies at 12 and 20 mg/L (3× and 5× the baseline MIC) at various timepoints for each dosing regimen and CLCR simulated in the HFIMa
| Time (h) | CLCR 250 mL/min | CLCR 110 mL/min | CLCR 30 mL/min | |||||||||
|---|---|---|---|---|---|---|---|---|---|---|---|---|
| control | 8-hourly | 6-hourly | 4-hourly | control | 8-hourly | 6-hourly | 4-hourly | control | 8-hourly | 4-hourly | ||
| 12 mg/L (3× MIC) | 0 | <−6.20b | <−6.70b | <−6.43b | ||||||||
| 23 | <−9.26 | −5.75 | −5.47 | −3.70 | <−7.56 | −3.02 | <−4.17 | <−4.35 | <−7.39 | <−4.41 | <−4.28 | |
| 47 | <−9.68 | −5.62 | −3.64 | −3.23 | −6.13 | −3.67 | −2.99 | <−3.12 | <−7.57 | <−2.51 | <−2.39 | |
| 71 | <−9.73 | −5.03 | −4.30 | −5.08 | −5.39 | −2.94 | −2.75 | −1.14 | −6.28 | −1.00 | <−2.48 | |
| 119 | <−4.66 | −4.01 | −3.17 | −2.95 | −6.20 | −2.37 | −2.53 | <−3.25 | <−7.65 | <−2.44 | <−1.45 | |
| 167 | −7.43 | −4.46 | −3.28 | −2.95 | −6.47 | −1.62 | −1.73 | <−2.99 | <−7.62 | <−2.25 | <−0.78 | |
| 20 mg/L (5× MIC) | 0 | <−6.20b | <−6.70b | <−6.43b | ||||||||
| 23 | <−9.26 | −6.43 | −5.83 | −4.00 | <−7.56 | −3.11 | <−4.17 | <−4.35 | −8.39 | <−4.41 | <−4.28 | |
| 47 | <−9.68 | −6.06 | −4.11 | −4.00 | <−7.58 | −4.26 | −4.43 | <−3.12 | <−7.57 | <−2.51 | <−2.39 | |
| 71 | <−9.73 | −5.36 | <−5.62 | −5.08 | −5.66 | −3.49 | −3.27 | <−2.51 | −6.50 | <−2.47 | <−2.48 | |
| 119 | <−9.66 | −4.29 | <−5.62 | −3.79 | −6.38 | −3.97 | −2.79 | <−3.25 | <−7.65 | <−2.44 | <−1.45 | |
| 167 | <−9.9 | −5.22 | −3.45 | −3.85 | −5.77 | −2.90 | −2.04 | <−2.99 | <−7.62 | <−2.25 | <−0.78 | |
aWhen no colonies were present on antibiotic-containing plates, mutant frequencies reported represent an upper limit based on the total viable count.
bThe log10 baseline mutation frequency determined at a higher bacterial density in a separate experiment was −8.69 at 3× and −8.99 at 5× MIC.
MIC values for colonies obtained from drug-free and drug-containing (piperacillin at 12 and 20 mg/L, equivalent to 3× and 5× the baseline MIC) agar plates at various timepoints for each dosing regimen and CLCR simulated in the HFIM
| Time (h) | Antibiotic regimen | MICa | ||||||||
|---|---|---|---|---|---|---|---|---|---|---|
| CLCR 250 mL/min | CLCR 110 mL/min | CLCR 30 mL/min | ||||||||
| drug-free | 3× MIC plates | 5× MIC plates | drug-free | 3× MIC plates | 5× MIC plates | drug-free | 3× MIC plates | 5× MIC plates | ||
| 0 | control | 4 | — | — | 4 | — | — | 4 | — | — |
| 47 | 4 | 8 | 4 | 4 | 32 | 32 | 8 | 8 | 8 | |
| 167 | 4 | 8 | NC | 8 | 32 | 32 | 8 | 16 | 16 | |
| 0 | 4 g 8-hourly | 4 | — | — | 4 | 4 | — | — | ||
| 47 | 8 | 32 | 32 | 16 | 32 | 64 | 8 | NC | NC | |
| 167 | 8 | 64 | 64 | 32 | 64 | 64 | 8 | NC | NC | |
| 0 | 4 g 6-hourlyb | 4 | — | — | 4 | — | — | — | — | — |
| 47 | 8 | 32 | 32 | 32 | 32 | 64 | — | — | — | |
| 167 | 16 | 64 | 64 | 32 | 64 | 128 | — | — | — | |
| 0 | 4 g 4-hourly | 4 | — | — | 4 | — | — | 4 | — | — |
| 47 | 16 | 32 | 32 | 16 | NC | NC | 8 | NC | NC | |
| 167 | 16 | 64 | 128 | 8 | NC | NC | 8 | NC | NC | |
NC, no colonies detected.
aSusceptibility and resistance to piperacillin were defined as an MIC ≤16 mg/L and an MIC >16 mg/L, respectively.20
bNo 4 g 6-hourly regimen was performed with a CLCR of 30 mL/min.
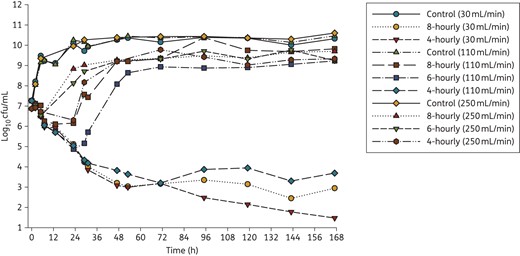
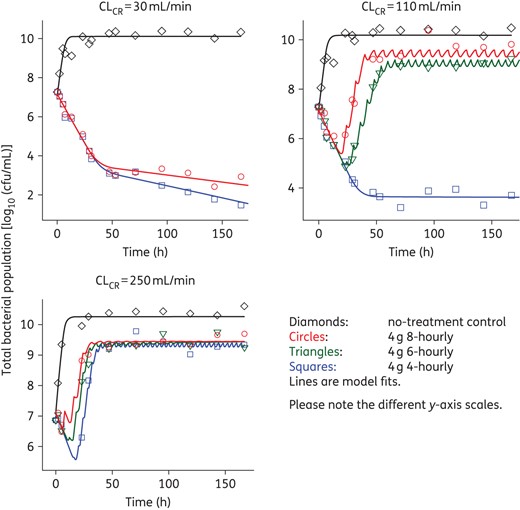
Time–kill curves for three clinically relevant dosing regimens of piperacillin/tazobactam (4 g intravenously given 8-, 6-, or 4-hourly; administered as a 0.5 h infusion) with three different levels of renal function (CLCR of 250, 110 and 30 mL/min) corresponding to piperacillin clearances of 43, 19 and 5.2 L/h. Only 8- and 4-hourly regimens were performed with a CLCR of 30 mL/min. For growth controls, flow rates for the respective renal functions were maintained. This figure appears in colour in the online version of JAC and in black and white in the print version of JAC.
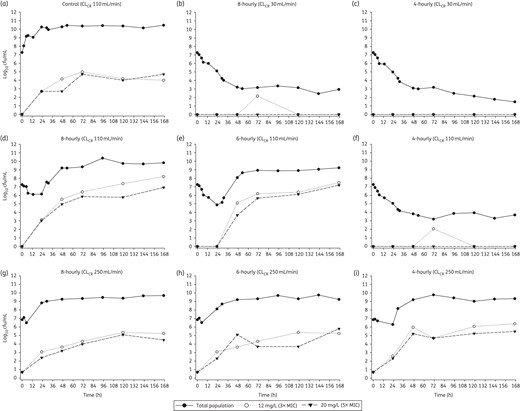
Effect of each dosing regimen at each level of renal function (CLCR of 250, 110 and 30 mL/min) on the total bacterial population and less-susceptible populations (i.e. able to grow in the presence of 3× or 5× the piperacillin MIC). For growth controls, flow rates for the respective renal functions were maintained. The increase in subpopulations at both antibiotic concentrations for each control arm was similar, with only the control simulating a CLCR of 110 mL/min shown.
Growth controls at each CLCR were virtually superimposable (Figure 3) with less-susceptible populations on agar containing 3× and 5× the MIC of piperacillin emerging by 48–72 h and plateauing at ∼4–5 log10 cfu/mL (Figure 4). MICs for the total population remained stable over time (within one 2-fold dilution) compared with the baseline value; MICs for colonies taken from antibiotic-containing agar increased for the CLCR of 110 and 30 mL/min (Table 3). For all antibiotic-containing regimens at each CLCR, bacterial killing was similar (<0.75 log10 cfu/mL) across the first 5 h of treatment (Figure 3). For the 8- and 6-hourly regimens with ARC, regrowth occurred rapidly between 5 and 23 h. Regrowth with the 4-hourly ARC regimen and the 8- and 6-hourly regimens with normal renal function was prevented up until 23 h (maximal killing of <2.5 log10), whereafter rapid regrowth occurred. Less-susceptible populations on agar containing both 3× and 5× the MIC of piperacillin also emerged quickly with these regimens and with one exception (6-hourly, CLCR of 110 mL/min) had reached ∼3 log by 24 h. At 167 h, growth on both concentrations of piperacillin-containing agar was ∼2 log greater with normal renal function than ARC, the latter being similar to controls.
Total population MICs and mutant frequencies at both concentrations generally increased earlier and achieved a higher value as the dosing frequency and CLCR increased (Table 3). MICs for the total population thus began to approach those for the less-susceptible populations, which increased more slowly, especially in the case of normal renal function. With the 4-hourly regimen with normal renal function and both regimens with impaired renal function bacterial killing continued up to ∼48 h (167 h with the 4-hourly, renal impairment regimen) whereafter growth remained suppressed (Figure 3). For those regimens and cases, few if any resistant subpopulations were detected at any time (Figure 4), preventing quantification of the mutant frequency. MICs for the total population at 167 h only increased by one dilution above the baseline value.
Pharmacodynamic modelling
The mechanism-based mathematical model well described the observed data (Figures 2 and 5). The coefficient of correlation for the observed versus individual fitted viable counts was 0.990 (Figure 2). The maximum inhibition of the probability of successful replication was 100% for all populations (Table 4; ImaxRep); however, a 55 times higher piperacillin concentration was required for half-maximal inhibition of successful replication of the resistant and intermediate populations (IC50Rep,IR = 45.8 mg/L) compared with the susceptible population (IC50Rep,S = 0.831 mg/L). The maximum extent of growth inhibition was ∼3-fold higher for the susceptible and intermediate populations than the resistant population (Table 4; Imaxk12,S and Imaxk12,I versus Imaxk12,R). The piperacillin concentration required for half-maximal inhibition of growth was estimated to span a 27-fold range between the susceptible (IC50k12,S = 0.877 mg/L) and the resistant (IC50k12,R = 23.7 mg/L) populations.
Population parameter estimates for piperacillin against P. aeruginosa 1280
| Parameter | Symbol | Unit | Estimate (SE) |
|---|---|---|---|
| Growth parameters | |||
| log10 initial inoculum | logcfu0 | log10 cfu/mL | 7.14 (0.3%) |
| mean generation time | k12−1 | min | 42.6 (0.6%) |
| replication rate constant | k21 | h−1 | 50 (fixed) |
| log10 (maximum population size) | logcfumax | log10 cfu/mL | |
| for untreated control arms | 10.2 (1.2%) | ||
| for piperacillin-treated arms | 9.48 (0.8%) | ||
| Log10 (mutant frequencies) | |||
| for intermediate population | logMFI | — | −3.53 (0.9%) |
| for resistant population | logMFR | — | −6.33 (0.7%) |
| Inhibition of growth rate by piperacillin | |||
| maximum inhibition | |||
| for susceptible population | Imaxk12,S | — | 0.760 (2.9%) |
| for intermediate population | Imaxk12,I | 0.970 (2.8%) | |
| for resistant population | Imaxk12,R | — | 0.285 (28.4%) |
| concentration causing 50% of maximum inhibition | |||
| for susceptible population | IC50k12,S | mg/L | 0.877 (20.9%) |
| for intermediate population | IC50k12,I | mg/L | 5.96 (5.6%) |
| for resistant population | IC50k12,R | mg/L | 23.7 (2.2%) |
| Hill coefficient | hillk12 | — | 4.67 (10.9%) |
| Inhibition of probability of successful replication by piperacillin | |||
| maximum inhibition | ImaxRep | — | 1.0 (fixed)a |
| concentration causing 50% of maximum inhibition | |||
| for susceptible population | IC50Rep,S | mg/L | 0.831 (21.9%) |
| for intermediate and resistant population | IC50Rep,IR | mg/L | 45.8 (0.5%) |
| Hill coefficient | hillRep | — | 2.43 (3%) |
| Standard deviation of additive residual error on log10 scale | SDcfu | log10 cfu/mL | 0.259 |
aImaxRep was estimated at 0.994 and therefore eventually was fixed to 1.0.
Fits of the developed mechanism-based model to the observed viable counts for the different renal functions and dosing regimens. This figure appears in colour in the online version of JAC and in black and white in the print version of JAC.
Discussion
In this study, we observed in our HFIM that different drug exposures simulated using different piperacillin regimens and renal functions produced markedly different bacterial killing. Piperacillin clearances of 43, 19 and 5.2 L/h were simulated to represent patients with ARC, normal renal function and renal impairment. Minimal killing occurred within the first 5 h in all cases despite an ∼16-fold range in the average steady-state concentration across the different regimens (Table 1). Significant differences in killing subsequently emerged over the next 24–48 h that were maintained across the treatment period. Bacterial killing continued only for the highest piperacillin exposures, i.e. the arms representing renal impairment and the 4-hourly normal renal function dosing regimen. However, even with these exposures, bacterial eradication was not achieved. Early regrowth towards control values occurred with all remaining regimens and CLCR. Thus, in the presence of ARC, not even the high 4 g 4-hourly dosing regimen could suppress bacterial regrowth. This is particularly significant given both the MIC of 4 mg/L is 4-fold below the susceptibility breakpoint of 16 mg/L piperacillin/tazobactam20 and the common occurrence of less-susceptible pathogens (with higher MICs) in the ICU.5,6 Therefore, treatment failure would appear likely for many patients even considering the potential added effect of the immune system in such patients.32
In addition to the differences in overall bacterial killing described above, differences in the emergence of less-susceptible populations were observed. While the increase in less-susceptible colonies in all regimens subject to ARC closely matched those of the controls, the proportion of less-susceptible colonies in the 8- and 6-hourly regimens subject to normal renal function increased ∼10–100-fold above this level. MIC values for the total population also tended to increase in these cases when compared with equivalent dosing regimens subject to ARC. The likely explanation for these differences is that reduced killing in the presence of ARC (due to increased clearance of the drug) results in decreased selection pressure. Importantly, our data indicate that the same dosing regimen (4 g 8-hourly) produces substantially less bacterial killing and increases less-susceptible populations in a patient with normal renal function compared with the one with impaired renal function, where exposure to the antibiotic is 3.7-fold as high (Table 1). This increase in less-susceptible populations can have long-term negative consequences not only for the individual patient, but also for clonal spread and infection control.
It is interesting to consider these findings in terms of currently proposed pharmacokinetic/pharmacodynamic targets. For all β-lactams, the fT>MIC has traditionally been considered the index best associated with bacterial killing.33,34 Although an fT>MIC target of 50% for penicillins has been shown from animal studies as being necessary for maximizing bacterial killing,35 retrospective clinical evaluations suggest larger drug exposures [e.g. concentrations up to 4× MIC for the entire dosing interval (100% fT>4×MIC)] may be required.36,37 We observed extensive regrowth even at 100% fT>MIC in the absence of the immune system in the HFIM. Previously published data suggest that patients with ARC are at particular risk of subtherapeutic β-lactam concentrations and thus treatment failure,38,39 as observed in this HFIM study with all regimens subject to ARC. However, it is concerning that treatment failure and amplification of less-susceptible subpopulations in the HFIM occurred even with typical pharmacokinetic profiles observed in patients with normal renal function with two of three commonly administered regimens. All regimens that suppressed regrowth and emergence of resistance achieved 100% fT>5×MIC. This supports the view that larger drug exposures are required for β-lactams and is a particularly important observation given recent data indicating only about two-thirds (67%) of piperacillin regimens administered achieve 100% fT>MIC, with less than one-third (30%) achieving 100% fT>4×MIC.3 In that study, increased exposures were also associated with an increased likelihood of clinical cure (P < 0.03), even if actual MIC data were not available for all patients. Thus, the observations from our HFIM study appear to align with results from these clinical studies in critically ill patients, based upon which the presented pharmacokinetics have been simulated.
Very few studies have previously investigated bacterial killing by and emergence of resistance to piperacillin in P. aeruginosa using an HFIM. VanScoy et al.40 included a piperacillin/tazobactam regimen of 4.5 g, i.e. 4 g of piperacillin 6-hourly (t1/2 1 h), as a positive control for a study involving ceftolozane and simulating pharmacokinetics in healthy volunteers. Against both a reference strain (MIC 2 mg/L) and clinical isolate (MIC >128 mg/L) at an inoculum of ∼108 cfu/mL, bacterial killing was minimal (<1 log10). The total bacterial population was completely replaced by a resistant subpopulation in the reference strain. Felton et al.13 examined a clinical isolate (MIC 4 mg/L) at two inocula using 8-hourly piperacillin/tazobactam (equivalent to 3, 9 or 17 g piperacillin in humans) by bolus or extended infusion over 5 days. At the high inoculum (∼8 × 10⁸ cfu/mL), only the highest-dose extended-infusion regimen produced any bacterial killing (∼2–3 log10), with the total bacterial population completely replaced by a resistant subpopulation in all cases. At a considerably higher inoculum than the one used in the present study, both 17 g regimens and the 9 g extended-infusion regimen had an fT>4×MIC of 100% yet did not result in substantial bacterial killing. We observed a similar lack of killing and increase in less-susceptible subpopulations with the two lowest dosing regimens at normal renal function, although the latter was absent in the case of ARC. However, we observed substantial bacterial killing and suppression of less-susceptible subpopulations in the presence of renal impairment and the highest-dose regimen at normal renal function.
The mechanism-based pharmacokinetic/pharmacodynamic model in this study was based on the known mechanism of action of penicillins. Bacterial killing described as inhibition of successful replication could not be more rapid than growth, which reflected the observed data (Figure 5) as we found previously for ceftazidime against P. aeruginosa.31 Low piperacillin concentrations due to ARC, submaximal doses (12 and 16 g/day), or both, were not able to adequately kill or inhibit the growth of the less-susceptible bacterial populations in the model. For example, piperacillin concentrations below or similar to the IC50k12,I (5.96 mg/L) during part of the dosing interval would occur for all regimens at ARC and the 8-hourly regimen at normal renal function. Piperacillin concentrations would remain above or around the IC50k12,R (23.7 mg/L) only for impaired renal function and the 4-hourly regimen at normal renal function. Thus, sustained inhibition of growth of the resistant population occurred mainly for the latter experimental arms, which in fact achieved a reduction of the bacterial counts to ≤4 log10 cfu/mL over 7 days (Figure 3). As our model successfully described the time course of bacterial growth, killing and regrowth over 7 days, it may be useful in simulations to predict bacterial responses to piperacillin dosing regimens for renal functions other than those studied. Mathematical modelling of bacterial in vitro data has been shown to be beneficial in the optimization of antibiotic dosing regimens.41,42 A potential limitation of the HFIM is the lack of an immune system. This could be addressed in future work by simulations from our mechanism-based model that include an effect of the immune system based on data from animal models.32 Another potential limitation is differences in bacterial growth between the HFIM and in vivo. However, for other β-lactams against P. aeruginosa, it has been shown that results from HFIM studies were comparable to those from neutropenic mouse models and predicted emergence of resistance in patients.43–46
To the best of our knowledge, this is the first HFIM study to investigate bacterial killing and emergence of resistance in the context of the altered pharmacokinetics known to occur in critically ill patients. Our results clearly show substantial differences in efficacy between clinically relevant dosing regimens of piperacillin when subjected to widely varying renal functions and thus piperacillin clearances. We found that use of a higher-than-standard dose (i.e. 4 g 4-hourly) in the case of normal renal function increased bacterial killing and minimized the emergence of resistance compared with more traditional 4 g 8- or 6-hourly dosing. However, even this regimen was inadequate in the presence of ARC. Only high doses of piperacillin prevented regrowth of a clinical P. aeruginosa isolate with a piperacillin MIC of 4 mg/L, which is four times below the susceptibility breakpoint of 16 mg/L piperacillin. These results highlight the need for individualized dosing regimens that account for altered pharmacokinetics and achieve an fCmin of 5× MIC in order to maximize bacterial killing and prevent resistance. Where this cannot be achieved with monotherapy, rationally designed and optimized combination regimens may need to be employed.
Funding
This work was predominantly supported by the Australian National Health and Medical Research Council (NHMRC) project grant APP1062040, and in part by NHMRC APP1045105. C. B. L. is the recipient of an Australian National Health and Medical Research Council Career Development Fellowship (APP1062509). J. A. R. is the recipient of an Australian National Health and Medical Research Council Career Development Fellowship (APP1048652). We wish to acknowledge the Australian National Health and Medical Research Council for Centre of Research Excellence funding (APP1099452).
Transparency declarations
None to declare.
Acknowledgements
We thank Dr Hanna Sidjabat from the University of Queensland for her assistance in acquiring the clinical isolate that was used in these studies.
References
