


Abstract
The multinational PEARLS (ACTG A5175) study, conducted mainly in resource-limited settings, identified an increased treatment failure rate among HIV-infected individuals randomized to once-daily unboosted atazanavir, didanosine-EC, and emtricitabine compared with efavirenz-based regimens. We evaluated associations between selected human genetic polymorphisms and atazanavir pharmacokinetics in PEARLS.
Polymorphisms in CYP3A5, ABCB1, SLCO1B1 and NR1I2 were genotyped in PEARLS participants randomized to atazanavir plus didanosine-EC plus emtricitabine in Peru, South Africa and the USA, who also consented to genetic analysis. Non-linear mixed-effects population pharmacokinetic modelling was used to predict atazanavir oral clearance (CL/F) and concentration at 24 h (C24). Atazanavir mono-oxidation metabolites M1 and M2 were quantified from the same single-point plasma sample used to quantify the parent drug. Data were log10 transformed for statistical analysis using unpaired t-tests and one-way ANOVA and are presented as geometric mean (95% CI).
Eighty-four HIV-infected participants were genotyped, including 44 Black Africans or African Americans and 28 women. Median age was 34 years. We identified 56 CYP3A5 expressers and 28 non-expressers. Atazanavir CL/F and C24 did not differ between CYP3A5 expressers and non-expressers: 13.2 (12.1–14.4) versus 12.7 L/h (11.7–13.9), P = 0.61, and 75.3 (46.1–123.0) versus 130.9 ng/mL (86.9–197.2), P = 0.14, respectively. M1/atazanavir and M2/atazanavir ratios were higher in expressers than in non-expressers: 0.0083 (0.0074–0.0094) versus 0.0063 (0.0053–0.0075), P = 0.008, and 0.0065 (0.0057–0.0073) versus 0.0050 (0.0042–0.0061), P = 0.02, respectively.
Expression of CYP3A5 appears to be associated with increased M1 and M2 atazanavir metabolite formation, without significantly affecting parent compound pharmacokinetics.
Introduction
Atazanavir, a PI used for the treatment of HIV-1 infection, is metabolized by cytochrome P450 (CYP) 3A4 and 3A5 subunits.1 To increase plasma exposure, atazanavir is typically prescribed with either low-dose ritonavir or cobicistat.2,3 CYP3A5 is a highly polymorphic enzyme with a bimodal pattern of hepatic expression; CYP3A5 expressers are individuals who carry at least one copy of the CYP3A5*1 allele and exhibit up to 30-fold higher levels of protein than non-expressers.4,5 The frequency of CYP3A5 expression is highest in Black Africans (50%–70%) and lowest in Caucasians (10%), and up to 25% of African Americans are homozygous for CYP3A5*1.6 The most frequent CYP3A5 loss-of-function variant, CYP3A5*3 (rs776746, 6986A → G), has been identified in all ethnic groups and is present in ∼85% of Caucasians, 85%–65% of Asians, 75% of Hispanics and 55% of African Americans.5,6 Less frequent loss-of-function variants include CYP3A5*6 (rs10264272, 14690G → A) and CYP3A5*7 (rs41303343, 27131-2ins T), both of which have been identified in Black Africans and African Americans, but not in other populations.5,7 Previous reports suggested associations between CYP3A5 non-expresser polymorphisms and metabolism of the PIs indinavir and saquinavir.8–11 Recent data in HIV-negative volunteers demonstrated faster atazanavir oral clearance (CL/F) and lower atazanavir trough concentrations (Cmin) in CYP3A5 expressers compared with non-expressers, particularly in non-African American males, which was lessened by ritonavir boosting.12 In a follow-up study, the atazanavir mono-oxidation metabolites 1 and 2 (M1 and M2) were produced faster via CYP3A5 compared with CYP3A4in vitro, and the plasma M1/atazanavir and M2/atazanavir ratio values were 2-fold higher in CYP3A5 expressers compared with non-expressers in vivo. This novel metabolite signature was highly predictive of CYP3A5 expresser status and independent of race.13
Atazanavir is also a substrate of the efflux transporter P-glycoprotein, encoded by ABCB1.14 A study in HIV-negative healthy volunteers suggested that atazanavir CL/F and atazanavir Cmin were associated with a particular ABCB1 haplotype,12 but the relationships between PI pharmacokinetics and ABCB1 polymorphisms have been inconsistent15,16 and in vivo effects have been modest.17 Organic anion transporting polypeptide 1, encoded by SLCO1B1, may also be relevant to atazanavir. The SLCO1B1 c.521T → C (rs4149056) polymorphism has been associated with reduced hepatocyte uptake of lopinavir/ritonavir and increased plasma lopinavir exposure,18,19 but recent data did not identify an association between SLCO1B1 polymorphisms and atazanavir pharmacokinetics.20 The pregnane X receptor (PXR), which is encoded by NR1I2 and can be activated by PIs, regulates CYP3A4, ABCB1 and SLCO1B1 gene expression and has also been associated with atazanavir pharmacokinetics.21 Homozygosity for NR1I2 63396C → T (rs2472677) has been associated with increased CYP3A4 activity, faster CL/F and lower atazanavir Cmin in HIV-negative and HIV-positive individuals.21,22
Unboosted atazanavir is safe and effective compared with NNRTIs and other PIs.23–25 Potential advantages of unboosted atazanavir include a low incidence of hyperbilirubinaemia, lipid abnormalities and reduced pill burden.26,27 The Prospective Evaluation of Antiretrovirals in Resource Limited Settings (PEARLS, A5175, NCT00084136) study of the AIDS Clinical Trials Group (ACTG) randomized 1571 treatment-naive HIV-1-infected participants (47% women) from nine countries and four continents to efavirenz plus lamivudine/zidovudine, atazanavir plus didanosine-EC plus emtricitabine, or efavirenz plus emtricitabine/tenofovir disoproxil fumarate.28 In this study, the Data Safety Monitoring Board recommended the early discontinuation of the atazanavir plus didanosine plus emtricitabine arm after a median follow-up of 72 weeks, as it was found to have inferior efficacy when compared with efavirenz plus lamivudine/zidovudine and efavirenz plus emtricitabine/tenofovir disoproxil fumarate. A population pharmacokinetics analysis found slower atazanavir CL/F in women compared with men, and among participants from Haiti, India and the USA compared with participants from Brazil, Malawi, Peru, South Africa, Thailand and Zimbabwe.29 These associations suggested that pharmacogenetic variants might affect atazanavir exposure. The present study evaluated associations between CYP3A5, ABCB1, SLCO1B1 and NR1I2 polymorphisms and plasma pharmacokinetics and metabolism of unboosted atazanavir in participants enrolled in PEARLS.
Methods
Study design
We retrospectively evaluated associations between atazanavir pharmacokinetics and selected polymorphisms in PEARLS participants. The primary objective was to compare atazanavir pharmacokinetics and mono-oxidation metabolite-to-parent drug ratios in CYP3A5 expressers versus non-expressers. Secondary objectives included the pharmacokinetic and metabolite associations with ABCB1, SLCO1B1 and NR1I2 polymorphisms and the probability of developing virological failure according to CYP3A5 phenotype. Institutional review board and country-specific ethics committee approvals were obtained.
Participants
HIV-infected, antiretroviral-naive participants enrolled in PEARLS who were randomized to once-daily atazanavir (400 mg by mouth once daily) plus didanosine-EC (250 or 400 mg by mouth once daily) plus emtricitabine (200 mg by mouth once daily) in Peru, South Africa and the USA and who provided informed consent for genetic testing were included. Only participants from these three countries were selected based on co-enrolment in either A5128 (US participants) or A5243 (non-US participants), two ongoing ACTG studies obtaining human biological samples for genetic analyses. Prior to study entry participants were at least 18 years of age, had CD4+ T cells <300/mm3 and <7 days of cumulative antiretroviral therapy.28 Women of reproductive potential were non-pregnant and agreed to the use of contraception if sexually active.
Quantification of atazanavir and population pharmacokinetics analysis
A single atazanavir plasma sample was collected between 4 and 8 weeks after treatment initiation and stored at −80°C until analysis. Atazanavir was quantified by a validated HPLC method [with a lower limit of quantification (LLQ) of 20.6 ng/mL and a linear range of 20.6–20 000 ng/mL]. A population pharmacokinetics model using NON-linear Mixed Effects Modeling version 7 (NONMEM) was built to obtain individual subject estimates of predicted concentrations and atazanavir pharmacokinetics parameters, which included CL/F and concentration at 24 h (C24), as previously described.29
Genotyping
Human genomic DNA was isolated from stored peripheral blood samples using a commercially available kit (QIAmp DNA Mini Kit; Qiagen, Valencia, CA, USA) and genotyped by PCR-pyrosequencing (PSQ 96MA; Qiagen). All genotyped samples were run in duplicate. Haplotypes were assigned using PHASE version 2.1.30,31 In CYP3A5, we genotyped CYP3A5*3 (rs776746) and CYP3A5*6 (rs10264272). The CYP3A5 expresser phenotype was assigned to individuals with at least one copy of the CYP3A5*1 allele based on the CYP3A5*3/*6 haplotype. For heterozygosity, CYP3A5 phenotype was assigned after computational inference, as described above. In ABCB1 we genotyped rs1128503, rs2032582 and rs1045642. ABCB1 haplotypes were analysed according to the number of C-G-C copies (0, 1 or 2). We genotyped rs2306283 and rs4149056 in SLCO1B1, and rs2472677, rs763645 and rs1523130 in NR1I2.
Metabolite analysis
Atazanavir mono-oxidation metabolites M1 and M2 were determined via a validated method using LC-MS/MS, as previously described.13 As authentic metabolite standards are not readily available, the apparent metabolite concentrations were estimates obtained from the standard curve of atazanavir. M1/atazanavir and M2/atazanavir ratios were calculated in all participants with a measurable atazanavir level from the same plasma sample as that used to perform the population pharmacokinetic analysis (single plasma sample collected between 4 and 8 weeks after treatment initiation).
Statistical analysis
Pharmacogenetic association analysis was performed using atazanavir CL/F and C24 data. Statistical analysis for CYP3A5 phenotype (expresser versus non-expresser) and other predictors with two categories was conducted using unpaired t-tests. Genotypes with more than two categories were analysed using ANOVA with pairwise comparisons using the most frequent genotype (*1 for CYP3A5) as the reference group. If a significant difference was identified in unadjusted analyses, an overall F-test adjusting for gender and race was performed. To account for missing data, we performed a sensitivity-ranked analysis, which included the participants with an undetectable atazanavir level but measurable M1 and M2 (we assumed that these participants had recent dosing of atazanavir). In these participants we assigned the highest possible rank for CL/F and the lowest possible rank for C24 in addition to an atazanavir concentration of 10.3 ng/mL (midpoint between the LLQ and 0 ng/mL). Since the individual genotype analyses were considered to be hypothesis generating only, we did not adjust for multiple comparisons.32,33
A Kaplan–Meier time-to-event analysis was performed to estimate the cumulative probability of developing virological failure in CYP3A5 expressers versus non-expressers based on the median follow-up time for the atazanavir plus didanosine-EC plus emtricitabine arm. Virological failure was defined as two successive plasma HIV-1 RNA values >1000 copies/mL at week 16 or later.28
Data were log10 transformed for analysis and presented as geometric mean (95% CI) unless otherwise specified. Statistical analyses were conducted using SAS 9.3 (Cary, NC, USA) and GraphPad Prism version 6.00 for Windows. A P value <0.05 was considered significant.
Results
Study population
From all the participants randomized to the atazanavir arm in PEARLS (n = 526), a total of 84 individuals had genotyping performed. The main reason for not having available genotypes in all PEARLS participants was that the ACTG studies where DNA was collected for genotyping (A5128 and A5243) were not available during PEARLS enrolment and/or follow-up, except in Peru, South Africa and the USA. Demographic and genotypic characteristics are presented in Tables 1 and 2, respectively. Besides differences in racial, ethnic, gender and country distribution compared with the parent study, no statistically significant differences in age, HIV stage, viral load upon randomization and/or rate of virological failure were identified among those PEARLS participants who were enrolled in this study versus those who were not (P > 0.20, Table S1, available as Supplementary data at JAC Online). Clinical and safety data of the parent trial have been presented elsewhere.28 Two of the 84 participants were excluded because they received concomitant ritonavir, leaving a total of 82 evaluable participants taking unboosted atazanavir. For pharmacokinetic analysis, 13 of 82 participants were excluded because atazanavir CL/F and C24 could not be calculated (7 with undetectable atazanavir level, 4 with atazanavir sampling ≤1 or ≥29 h post-dose and 2 with atazanavir level >6000 ng/mL). For the metabolite analysis, we excluded 7 of 82 participants with undetectable atazanavir levels since the M1/atazanavir and M2/atazanavir ratios could not be calculated. Overall, we analysed CL/F and C24 data for 69 participants and metabolite data for 75 participants.
Study population demographic characteristics (n = 84)
| Characteristic | n (%) or median (range) |
|---|---|
| Gender | |
| male | 56 (67) |
| female | 28 (33) |
| Age, years | 34 (19–59) |
| Race | |
| Black African or African American | 44 (52) |
| Non-Black African or African American | 40 (48) |
| White | 27 (32) |
| Mestizo | 6 (7) |
| >1 race/unknown | 4 (5) |
| American Indian/Hawaiian/Pacific Islander | 3 (4) |
| Country | |
| USA | 54 (64) |
| South Africa | 24 (29) |
| Peru | 6 (7) |
| Baseline HIV viral load | |
| ≥100 000 copies/mL | 44 (52) |
| <100 000 copies/mL | 40 (48) |
| Baseline CD4, cells/mm3 | 202 (6–298) |
Study population genotype characteristics (n = 84)
| Gender | Region | Race/Ethnicity | |||||||||
|---|---|---|---|---|---|---|---|---|---|---|---|
| Age, median (range) | male (n = 56) | female (n = 28) | USA (n = 54) | South Africa (n = 24) | Peru (n = 6) | Black Af/AA (n = 44) | White (n = 27) | Mestizo (n = 6) | Am Ind/Haw/PI (n = 3) | >1 race or unknown (n = 4) | |
| CYP3A5 phenotype | |||||||||||
| expresser (n = 56) | 34 (19–55) | 35 | 21 | 32 | 23 | 1 | 40 | 11 | 1 | 1 | 3 |
| non-expresser (n = 28) | 34 (22–59) | 21 | 7 | 22 | 1 | 5 | 4 | 16 | 5 | 2 | 1 |
| CYP3A5 genotype | |||||||||||
| *1/*1 (n = 17) | 36 (22–55) | 7 | 10 | 8 | 9 | 0 | 14 | 2 | 0 | 1 | 0 |
| *1/*3 (n = 25) | 31 (23–48) | 17 | 8 | 20 | 4 | 1 | 12 | 9 | 1 | 0 | 3 |
| *1/*6 (n = 15) | 39 (19–51) | 12 | 3 | 5 | 10 | 0 | 14 | 1 | 0 | 0 | 0 |
| *3/*3 (n = 24) | 33 (22–59) | 18 | 6 | 19 | 0 | 5 | 2 | 14 | 5 | 2 | 1 |
| *6/*6 (n = 1) | 36 | 0 | 1 | 0 | 1 | 0 | 1 | 0 | 0 | 0 | 0 |
| *3/*6 (n = 2) | 34 (34–35) | 2 | 0 | 2 | 0 | 0 | 1 | 1 | 0 | 0 | 0 |
| ABCB1 (C-G-C copies) | |||||||||||
| 0 (n = 17) | 33 (22–59) | 13 | 4 | 14 | 0 | 3 | 1 | 11 | 3 | 0 | 2 |
| 1 (n = 28) | 31 (19–55) | 20 | 8 | 21 | 5 | 2 | 10 | 11 | 2 | 3 | 2 |
| 2 (n = 39) | 35 (19–51) | 23 | 16 | 19 | 19 | 1 | 33 | 5 | 1 | 0 | 0 |
| SLCO1B1 c.388 | |||||||||||
| AA (n = 17) | 33 (19–59) | 13 | 4 | 14 | 0 | 3 | 2 | 10 | 3 | 0 | 2 |
| AG (n = 18) | 32 (23–55) | 14 | 4 | 13 | 3 | 2 | 6 | 8 | 2 | 1 | 1 |
| GG (n = 49) | 35 (19–51) | 29 | 20 | 27 | 21 | 1 | 36 | 9 | 1 | 2 | 1 |
| SLCO1B1 c.521 | |||||||||||
| TT (n = 70) | 34 (19–59) | 46 | 24 | 43 | 23 | 4 | 41 | 18 | 4 | 3 | 4 |
| TC (n = 14) | 36 (19–55) | 10 | 4 | 11 | 1 | 2 | 3 | 9 | 2 | 0 | 0 |
| CC (n = 0) | 0 | 0 | 0 | 0 | 0 | 0 | 0 | 0 | 0 | 0 | |
| NR1I2 g.44477 | |||||||||||
| TT (n = 37) | 34 (19–55) | 20 | 17 | 21 | 15 | 1 | 31 | 2 | 1 | 1 | 2 |
| TC (n = 34) | 34 (22–59) | 25 | 9 | 22 | 9 | 3 | 13 | 17 | 3 | 0 | 1 |
| CC (n = 13) | 39 (24–47) | 11 | 2 | 11 | 0 | 2 | 0 | 8 | 2 | 2 | 1 |
| NR1I2 g.63396 | |||||||||||
| CC (n = 33) | 34 (19–59) | 22 | 11 | 19 | 10 | 4 | 17 | 11 | 4 | 0 | 1 |
| CT (n = 34) | 37 (19–48) | 22 | 12 | 20 | 12 | 2 | 22 | 8 | 2 | 1 | 1 |
| TT (n = 17) | 32 (22–55) | 12 | 5 | 15 | 2 | 0 | 5 | 8 | 0 | 2 | 2 |
| NR1I2 g.69789 | |||||||||||
| AA (n = 54) | 34 (19–55) | 33 | 21 | 32 | 22 | 0 | 41 | 9 | 0 | 2 | 2 |
| AG (n = 14) | 34 (22–59) | 12 | 2 | 11 | 2 | 1 | 3 | 8 | 1 | 1 | 1 |
| GG (n = 16) | 32 (24–47) | 11 | 5 | 11 | 0 | 5 | 0 | 10 | 5 | 0 | 1 |
Black Af, Black African; AA, African American; Am Ind, American Indian; Haw, Native Hawaiian; PI, Pacific Islander.
Primary endpoint
Atazanavir population pharmacokinetics parameters and the metabolite-to-parent drug ratios according to CYP3A5 expresser status are shown in Table 3. In an unadjusted analysis, atazanavir CL/F (P = 0.61) and C24 (P = 0.14) were not different in CYP3A5 expressers versus non-expressers, which remained unchanged after adjusting for race and gender. In contrast, M1/atazanavir and M2/atazanavir ratios were significantly higher in CYP3A5 expressers versus non-expressers: 0.0083 (0.0074–0.0094) versus 0.0063 (0.0053–0.0075), respectively, P = 0.008, for M1/atazanavir; 0.0065 (0.0057–0.0073) versus 0.0050 (0.0042–0.0061), respectively, P = 0.02, for M2/atazanavir (Figure 1, Table 3). After adjusting for race and gender, only the M2/atazanavir ratio remained significant (P = 0.04). A sub-analysis of CYP3A5 expresser status according to race (i.e. separate analysis of Black Africans/African Americans and non-Black Africans/African Americans, Supplementary Data) demonstrated that, in non-Black Africans/African Americans, the M1/atazanavir and M2/atazanavir ratios remained significantly higher in expressers (n = 12) versus non-expressers (n = 22): 0.0089 (0.0084–0.0095) versus 0.0060 (0.0049–0.0074), respectively, P = 0.0069, for M1/atazanavir; 0.0065 (0.0056–0.0075) versus 0.0047 (0.0038–0.0058), respectively, P = 0.03 for M2/atazanavir. Given sample size limitations in the non-expresser group, we could not make a conclusive inference in Black Africans/African Americans. In the ranked analysis (n = 73), which included four participants with undetectable atazanavir levels but measurable metabolites, only M1/atazanavir differed significantly in expressers versus non-expressers: 0.0083 (0.0074–0.0094) versus 0.0065 (0.0053–0.0080), respectively, P = 0.0027.
Atazanavir (ATV) population pharmacokinetic parameters and metabolite ratios according to CYP3A5 phenotype
| n = 69 (45 expressers; 24 non-expressers) | n = 75 (49 expressers; 26 non-expressers) | |||||||
|---|---|---|---|---|---|---|---|---|
| CYP3A5 Phenotype | CL/F (L/h) | P | C24 (ng/mL) | P | M1/ATV | P | M2/ATV | P |
| Expressor | 13.2 (12.1–14.4) | 0.61 | 75.3 (46.1–123.0) | 0.14 | 0.0083 (0.0074–0.0094) | 0.008 | 0.0065 (0.0057–0.0073) | 0.02 |
| Non-expresser | 12.7 (11.7–13.9) | 130.9 (86.9–197.2) | 0.0063 (0.0053–0.0075) | 0.0050 (0.0042–0.0061) | ||||
Data are geometric mean (95% CI).
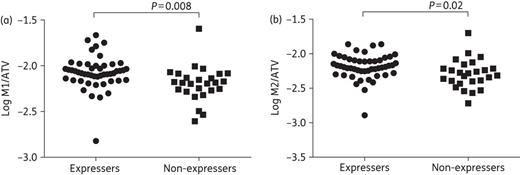
Ratios of mono-oxidation metabolites 1 and 2 (M1 and M2) to atazanavir (ATV) concentration in 75 CYP3A5 expressers (n = 49) and non-expressers (n = 26). (a) Log10 M1/atazanavir ratios in expressers versus non-expressers. (b) Log10 M2/atazanavir ratios in expressers versus non-expressers.
CYP3A5 genotype
Population pharmacokinetics parameters and M1/atazanavir and M2/atazanavir ratios were analysed according to individual CYP3A5 genotype (Table 4). In the unadjusted analysis, CL/F differed by CYP3A5*3 genotype (P = 0.001, Figure 2), with faster clearance with the CYP3A5*1/*1 genotype versus CYP3A5*1/*3 and CYP3A5*3/*3 genotypes: 14.8 (13.9–15.8) versus 11.4 L/h (9.9–13.2), P = 0.0006, and 12.5 L/h (11.4–13.8), P = 0.02, respectively. This difference remained significant after adjusting for race and gender (P = 0.006), although only for CYP3A5*1/*1 compared with CYP3A5*1/*3 (P = 0.001). C24 also differed by CYP3A5*3 genotype (P = 0.02, Figure 2), with lower atazanavir levels with CYP3A5*1/*1 genotype versus CYP3A5*1/*3 and CYP3A5*3/*3 genotypes [49.8 (28.4–87.2) versus 134.3 ng/mL (67.2–268.3), P = 0.01, and 135.4 ng/mL (84.9–215.7), P = 0.01, respectively], although this was not significant after adjusting for race and gender (P = 0.15). In the ranked analysis, CL/F was significantly faster in the CYP3A5*1/*1 genotype versus CYP3A5*1/*3 and CYP3A5*3/*3 genotypes (P = 0.04). For the metabolite analysis, there was a significant overall difference in M1/atazanavir by CYP3A5 genotype (P = 0.02, Figure 2), with higher M1/atazanavir in CYP3A5*1/*1 versus CYP3A5*3/*3 genotype [0.0088 (0.0074–0.0105) versus 0.0063 (0.0052–0.0076), respectively, P = 0.005]. This was also the case for M2/atazanavir (P = 0.01, Figure 2), which was higher with the CYP3A5*1/*1 genotype versus CYP3A5*3/*3 [0.0070 (0.0059–0.0083) versus 0.0049 (0.0040–0.0061), respectively, P = 0.004]. None of these differences was statistically significant after adjusting for race and gender or by ranked analysis.
Atazanavir population pharmacokinetic parameters and metabolite ratios according to individual genotype
| n = 69 (45 expressers; 24 non-expressers) | n = 75 (49 expressers; 26 non-expressers) | |||||||
|---|---|---|---|---|---|---|---|---|
| CL/F (L/h) | Pa | C24 (ng/mL) | Pa | M1/ATV | Pa | M2/ATV | Pa | |
| CYP3A5*3 | 0.001 | 0.02 | 0.02 | 0.01 | ||||
| *1/*1 (reference) | 14.8 (13.9–15.8) | (reference) | 49.8 (28.4–87.2) | (reference) | 0.0088 (0.0074–0.0105) | (reference) | 0.0070 (0.0059–0.0083) | (reference) |
| *1/*3 | 11.4 (9.9–13.2) | 0.0006 | 134.3 (67.2–268.3) | 0.01 | 0.0074 (0.0066–0.0084) | 0.15 | 0.0058 (0.0051–0.0065) | 0.11 |
| *3/*3 | 12.5 (11.4–13.8) | 0.02 | 135.4 (84.9–215.7) | 0.01 | 0.0063 (0.0052–0.0076) | 0.005 | 0.0049 (0.0040–0.0061) | 0.004 |
| CYP3A5*6 | 0.004 | 0.04 | 0.03 | 0.06 | ||||
| *1/*1 (reference) | 12.4 (11.6–13.4) | 109.3 (73.5–161.8) | 0.0071 (0.0063–0.0080) | 0.0056 (0.0050–0.0063) | ||||
| *1/*6 | 15.7 (14.6–16.8) | 42.9 (20.4–90.4) | 0.0093 (0.0078–0.0112) | 0.0071 (0.0060–0.0085) | ||||
| ABCB1 (C-G-C copies) | 0.19 | 0.009b | 0.15 | 0.08 | ||||
| 0 (reference) | 13.4 (11.8–15.2) | 115.8 (57.5–233.4) | (reference) | 0.0062 (0.0049–0.0078) | 0.0046 (0.0037–0.0058) | |||
| 1 | 12.1 (10.8–13.4) | 164.1 (102.3–263.1) | 0.08 | 0.0083 (0.0069–0.0099) | 0.0060 (0.0051–0.0072) | |||
| 2 | 13.7 (12.5–15.0) | 51.5 (29.4–90.1) | 0.46 | 0.0076 (0.0066–0.0088) | 0.0064 (0.0055–0.0074) | |||
| SLCO1B1 c.388 | 0.88 | 0.42 | 0.46 | 0.38 | ||||
| AA (reference) | 12.6 (11.3–14.1) | 119.4 (80.7–176.7) | 0.0067 (0.0055–0.0081) | 0.0054 (0.0046–0.0064) | ||||
| AG | 13.1 (11.6–14.9) | 119.1 (60.7–234.0) | 0.0076 (0.0061–0.0096) | 0.0055 (0.0044–0.0068) | ||||
| GG | 13.1 (12.0–14.4) | 74.3 (43.1–128.0) | 0.0079 (0.0069–0.0090) | 0.0063 (0.0055–0.0073) | ||||
| SLCO1B1 c.521 | 0.57 | 0.12 | 0.10 | 0.26 | ||||
| TT (reference) | 13.2 (12.2–14.1) | 81.7 (54.7–121.8) | 0.0073 (0.0066–0.0081) | 0.0058 (0.0052–0.0065) | ||||
| TC | 12.5 (10.8–14.4) | 176.2 (107.2–289.5) | 0.0092 (0.0069–0.0122) | 0.0068 (0.0053–0.0087) | ||||
| NR1I2 g.44477 | 0.72 | 0.31 | 0.74 | 0.65 | ||||
| TT (reference) | 13.4 (12.3–14.5) | 69.0 (37.1–128.2) | 0.0077 (0.0064–0.0091) | 0.0061 (0.0052–0.0071) | ||||
| TC | 12.9 (11.7–14.2) | 100.6 (65.7–154.1) | 0.0077 (0.0067–0.0089) | 0.0060 (0.0051–0.0071) | ||||
| CC | 12.5 (10.0–15.6) | 147.8 (58.2–375.7) | 0.0069 (0.0052–0.0091) | 0.0053 (0.0038–0.0074) | ||||
| NR1I2 g.63396 | 0.17 | 0.008c | 0.96 | 0.89 | ||||
| CC (reference) | 12.3 (10.9–13.9) | 126.8 (81.1–198.2) | (reference) | 0.0071 (0.0060–0.0085) | 0.0058 (0.0049–0.0070) | |||
| CT | 14.0 (13.0–15.1) | 48.4 (25.3–92.6) | 0.01 | 0.0081 (0.0067–0.0097) | 0.0064 (0.0053–0.0077) | |||
| TT | 12.5 (11.0–14.4) | 172.6 (106.2–280.3) | 0.50 | 0.0077 (0.0066–0.0090) | 0.0057 (0.0048–0.0068) | |||
| NR1I2 g.69789 | 0.82 | 0.73 | 0.48 | 0.67 | ||||
| AA (reference) | 13.1 (12.1–14.0) | 81.7 (49.4–135.1) | 0.0082 (0.0081–0.0082) | 0.0063 (0.0047–0.0084) | ||||
| AG | 13.4 (11.6–15.5) | 106.5 (64.9–175.0) | 0.0070 (0.0051–0.0096) | 0.0053 (0.0040–0.0069) | ||||
| GG | 12.6 (10.0–15.8) | 112.8 (45.2–281.0) | 0.0077 (0.0070–0.0085) | 0.0061 (0.0055–0.0069) | ||||
Data are geometric mean (95% CI).
aOverall ANOVA P value. Pairwise comparisons (compared with reference group) included if overall ANOVA was significant. CYP3A5*6 and SLCO1B1 c.521 genotypes were analysed using the unpaired t-test.
bABCB1 (C-G-C copies): 1 versus 2, P = 0.003.
cNR1I2 g.63396: CT versus TT, P = 0.007.
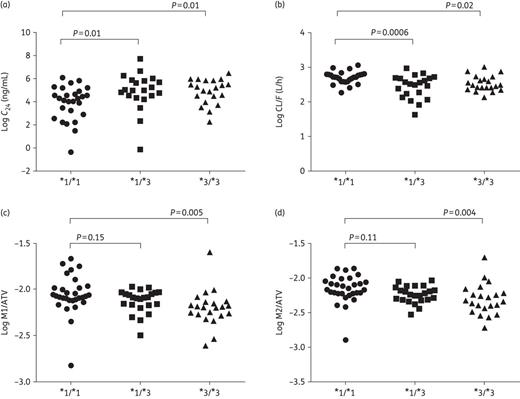
Pharmacokinetic parameters and ratios of mono-oxidation metabolites 1 and 2 (M1 and M2) to atazanavir (ATV) concentration according to individual CYP3A5*3 genotype. (a and b) Log10C24 and log10 CL/F with CYP3A5*1/*1 (n = 27) versus CYP3A5*1/*3 (n = 21) versus CYPA3A5*3/*3 (n = 21), respectively. (c and d) Log10 M1/atazanavir and log10 M2/atazanavir with CYP3A5*1/*1 (n = 30) versus CYP3A5*1/*3 (n = 23) versus CYPA3A5*3/*3 (n = 22), respectively. Overall ANOVA: log10C24P = 0.02, log10 CL/FP = 0.001, log10 M1/atazanavir P = 0.01 and log10 M2/atazanavir P = 0.01.
Only one participant (a Black individual from South Africa) was homozygous for the CYP3A5*6/*6 genotype. Thus, this participant was excluded from any further analyses and the genotypes compared were CYP3A5*1/*1 versus CYP3A5*1/*6. In the unadjusted analysis, CL/F was slower with the CYP3A5*1/*1 genotype versus the CYP3A5*1/*6 genotype [12.4 (11.6–13.4) versus 15.7 L/h (14.6–16.8), respectively, P = 0.004], which remained significant after adjusting for race and gender (P = 0.01) and by ranked analysis (P = 0.009). Participants with the CYP3A5*1/*1 genotype had higher C24 levels versus the CYP3A5*1/*6 genotype [109.3 (73.5–161.8) versus 42.9 ng/mL (20.4–90.4), respectively, P = 0.04], although this lost significance by ranked analysis and after adjusting for race and gender. M1/atazanavir was lower in the CYP3A5*1/*1 genotype versus the CYP3A5*1/*6 genotype [0.0071 (0.0063–0.0080) versus 0.0093 (0.0078–0.0112), respectively, P = 0.03], but this was not significant in the adjusted or ranked analyses. There were no differences in M2/atazanavir according to CYP3A5*6 genotype.
ABCB1, SLCO1B1 and NR1I2
For ABCB1, C24 differed by number of C-G-C haplotype copies (P = 0.009, Table 4), with lower atazanavir C24 with 2 versus 1 copies [51.5 (29.4–90.1) versus 164.1 ng/mL (102.3–263.1), respectively, P = 0.003], but this difference was not significant after adjusting for race and gender (P = 0.06) or by ranked analysis (P = 0.22). No other differences in pharmacokinetic parameters of metabolite ratios were observed for ABCB1. For SLCO1B1, CL/F, C24 and M1/atazanavir and M2/atazanavir ratios did not differ by SLCO1B1 c.388 or SLCO1B1 c.521 genotypes (Table 4). In an unadjusted analysis, C24 was lower in participants heterozygous for NR1I2 g.63396C → T (P = 0.008) versus those who were homozygous for the major or minor allele [48.4 (25.3–92.6) versus 126.8 ng/mL (81.1–198.2), P = 0.01, and 172.6 ng/mL (106.2–280.3), P = 0.007 (Table 4), respectively], which remained significant after adjusting for race and gender (P = 0.03) and by ranked analysis (P = 0.003). We found no difference in CL/F, C24, M1/atazanavir or M2/atazanavir by NR1I2 g.44477T → C or NR1I2 g.69789A → G genotypes (Table 4).
Virological failure according to CYP3A5 phenotype
Among the 69 participants included in the pharmacokinetic analysis, 11 developed virological failure after randomization, including 7 out of 24 CYP3A5 non-expressers and 4 out of 45 CYP3A5 expressers. After 72 weeks (median study follow-up), the proportion of participants without virological failure was significantly higher in CYP3A5 expressers versus non-expressers [0.95 (95% CI 0.89–1) versus 0.73 (95% CI 0.57–0.94), P = 0.026] (Figure 3).
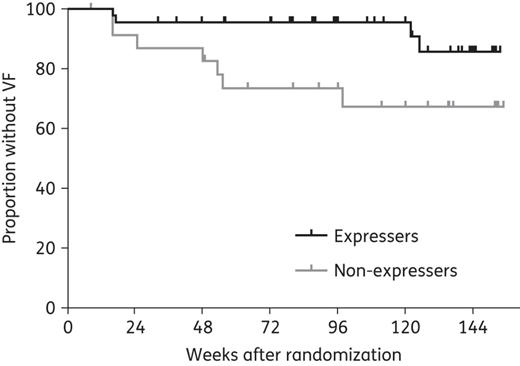
Kaplan–Meier estimates of time to development of virological failure (VF) in CYP3A5 expressers (n = 45) versus non-expressers (n = 24). The cumulative probability of virological failure is shown on the vertical axis for the two study groups. At week 72 (median study follow-up), the proportion of CYP3A5 expressers without VF was 0.95 (95% CI 0.89–1) versus 0.73 (95% CI 0.57–0.94) in non-expressers (P = 0.026). Racial distribution in expressers with VF (n = 4) included three Black African/African American participants (two from USA and one from South Africa) and one White participant. Racial distribution in non-expressers with VF (n = 7) included five White, one Peruvian and one African American participant from the USA.
Discussion
This study identified a distinctive metabolic profile for unboosted atazanavir in a racially diverse cohort of HIV-infected CYP3A5 expressers versus non-expressers, which is consistent with previous findings in healthy volunteers and human liver microsomes.13,34 However, in contrast to previous observations,12,20,35 we found no association between CYP3A5 expresser status and pharmacokinetic parameters in the parent drug. This finding is unexpected since the increased metabolite ratios in CYP3A5 expressers suggest faster atazanavir metabolism. Despite this, individual genotype analysis for CYP3A5*3 and CYP3A5*6 identified significant pharmacokinetic differences in unboosted atazanavir. For example, when CYP3A5*1/*3 was individually evaluated, CL/F and C24 revealed decreased atazanavir exposure compared with the CYP3A5*1/*1 genotype. This suggests that, at least in this study cohort, the CYP3A5*1/*3 genotype may more appropriately fit within the CYP3A5*3/*3 category and the non-expresser phenotype. Although this discordance is opposite to what has been previously reported for atazanavir and other medications, including other PIs,4,8,10,12,36 an individual CYP3A5 genotype effect has been previously observed with other drugs.37–39
Among the potential reasons for the CYP3A5 pharmacokinetic differences between our study and previous reports could be that we derived pharmacokinetic data from a non-linear mixed effects model based on a single atazanavir measurement,29 in addition to the small sample size in our cohort. Similarly, there could be variability in drug adherence in this HIV-infected population, which is suggested by seven individuals with undetectable atazanavir levels. Although the adherence analysis in the parent study recently demonstrated low rates of non-adherence in participants randomized to a once daily compared with a twice daily regimen,40 adherence was assessed through a standardized interviewer-administered questionnaire and pill counts, both of which overestimate adherence.41,42 Concomitantly, the diverse ethnic distribution of the parent study from which this cohort is derived (i.e. a randomized clinical trial in resource-limited settings) resulted in a variable distribution of the CYP3A5 phenotype and other genotypes analysed, which could have limited our ability to identify genetic associations. Regardless of these limitations, our study adds novel and unique knowledge to the pharmacogenetics and metabolism of unboosted atazanavir in racially diverse HIV-infected individuals.
Two previously unreported findings in our study are worthy of individual discussion. First, participants with two copies of the ABCB1 C-G-C haplotype had lower atazanavir C24 than individuals with one copy. Although this disagrees with previous reports in which atazanavir exposure was lower with 0 versus 1 and 2 C-G-C copies (even after controlling for CYP3A5 phenotype)12 and in individuals with the ABCB1 2677G → T/A genotype,43 it is not unexpected given the conflicting results involving the ABCB1 pharmacogenetics of PIs.11,15,16 Second, NR1I2 63396 C/T heterozygosity was associated with lower atazanavir C24 than either homozygous genotype. This is inconsistent with previous observations for unboosted atazanavir, in which 63396 T/T homozygosity was associated with low drug exposure.21,22 To evaluate this further, we analysed the effect of the NR1I2 63396C → T genotype according to CYP3A5 phenotype and found that atazanavir C24 remained low in the CYP3A5 expressers (P = 0.02), but not in non-expressers (P = 0.11). The predominance of CYP3A5 expressers in our cohort may explain this finding, as previous observations of an association with NR1I2 63396C → T have mainly involved Caucasians, where 50–90% are CYP3A5 non-expressers.21,22 The discrepancies observed in our cohort on the pharmacogenetics of unboosted atazanavir in ABCB1 and NR1I2 merit additional study.
Although various studies have evaluated the relationship of antiretroviral pharmacogenetics with HIV outcomes, none has focused on unboosted atazanavir.44–48 In this study, virological failure was more frequent in phenotypic CYP3A5 non-expressers versus expressers. This contrasts with a recent report in which CYP3A5*3 was not associated with lopinavir/ritonavir monotherapy failure,49 and is counterintuitive, since our M1 and M2 metabolite results suggest increased atazanavir metabolism in CYP3A5 expressers, which should lead to lower atazanavir exposure. A potential explanation for this finding is that reduced atazanavir metabolism in non-expressers could have led to higher drug exposure and side effects, resulting in sub-optimal adherence and treatment failure. On the other hand, this is unlikely to be due to an additional antiviral effect provided by the M1 and M2 metabolites in CYP3A5 expressers, as none of these atazanavir metabolites has demonstrated any in vitro antiviral activity.1
Among the main strengths of our study are the diversity of the studied population, the ability to study the pharmacokinetic and pharmacogenetic associations of atazanavir without the potential confounding effects of ritonavir and the multiple SNPs that were analysed. In addition, this study also demonstrates the feasibility of pharmacogenetic research in diverse settings. Our limitations include the small sample size, the sparse pharmacokinetic sampling and the restrictions inherent in subjective adherence monitoring. However, the evaluation of unboosted atazanavir pharmacogenetics in the context of a large randomized, multinational clinical trial in resource-limited settings makes this study unique in the field, as future studies of atazanavir as a single PI are unlikely to be repeated.
Funding
This work was supported by Award Number U01AI068636 from the National Institute of Allergy and Infectious Diseases and supported by National Institute of Mental Health (NIMH), National Institute of Dental and Craniofacial Research (NIDCR). This work was also supported by NIH/NCRR Colorado CTSI (CCTSI) Grant Numbers UL1 RR025780 and UL1 TR001082; NIH/NIAID ACTG Minority Investigator Award AI0 68636; and NIH/NIAID K23 AI104315. The research utilized services of the Medicinal Chemistry Core Facility (MCCF) housed within the Department of Pharmaceutical Sciences (DOPS). The MCCF receives funding via CCTSI. Colorado Multiple Institutional Review Board COMIRB# 11-0106.
Transparency declarations
All authors have none to declare.
Disclaimer
The content is solely the responsibility of the authors and does not necessarily represent the official views of the National Institute of Allergy and Infectious Diseases or the National Institutes of Health.
Acknowledgements
We thank the AIDS CLINICAL TRIALS GROUP and the PEARLS (A5175) study team for their assistance with this manuscript. Study drugs were donated by Gilead Sciences, Bristol Myers Squibb, GlaxoSmithKline, ViiV Healthcare and Boehringer Ingelheim.
References
