


Abstract
The aim of this study was to evaluate pristinamycin in the treatment of MSSA bone and joint infection (BJI).
A retrospective, single-centre cohort study (2001–11) investigated outcome in adults receiving pristinamycin for MSSA BJI and pristinamycin-related adverse events (AEs).
One hundred and two MSSA BJIs were assessed in 98 patients [chronic infection, 33.3%; and orthopaedic device-related infection (ODI), 67.6%]. Surgery was performed in 77.5% of total cases, and in all but three ODIs, associated with antibiotic therapy of a median total duration of 29.2 weeks. Pristinamycin was prescribed as a part of the initial intensive treatment phase (29.4%) and/or included in final maintenance therapy (83.3%) at a dose of 47.6 (45.5–52.6) mg/kg/day for 9.3 (1.4–20.4) weeks. AEs occurred in 13.3% of patients, consisting of gastrointestinal disorder (76.9%) or allergic reaction (23.1%), leading to treatment interruption in 11 cases. AEs were related to daily dose (OR, 2.733 for each 10 additional mg/kg/day; P = 0.049). After a follow-up of 76.4 (29.6–146.9) weeks, the failure rate was 34.3%, associated with ODI (OR, 4.421; P = 0.006), particularly when the implant was retained (OR, 4.217; P = 0.007). In most patients, the pristinamycin companion drug was a fluoroquinolone (68.7%) or rifampicin (21.7%), without difference regarding outcome.
Pristinamycin is an effective, well-tolerated alternative therapeutic option in MSSA BJI, on condition that a daily dosage of 50 mg/kg is respected.
Introduction
Staphylococcus aureus represents the leading pathogen implicated in bone and joint infection (BJI), usually requiring prolonged combination antimicrobial therapy, which may be particularly challenging in the case of MDR bacteria and/or for patients with multiple drug intolerance.1 In the absence of new well-tolerated oral antistaphylococcal drugs, older antibiotics must be considered. Pristinamycin, an oral streptogramin antibiotic comprising two structurally unrelated bacteriostatic components (pristinamycin IA and IIB), appears to be a particularly attractive option in this setting, considering: (i) the synergic bactericidal activity of its two components against staphylococci; and (ii) its lower risk of resistance compared with macrolides and lincosamides.2,3 However, pristinamycin is not currently licensed for treatment of staphylococcal BJI and lack of clinical data prevents it from being considered as a reliable alternative therapeutic option in current guidelines.4–8 The present study reports the experience of our regional reference centre with pristinamycin-based therapy in MSSA BJI, focusing on patient outcome and pristinamycin tolerance.
Patients and methods
Ethics statements
The study received the approval of the French South-East Ethics Committee (reference number CAL2011-021). In accordance with French legislation, written informed consent was not required for any part of the study.
Inclusion criteria and data collection
All patients receiving pristinamycin as a part of treatment for an MSSA BJI and followed up between 2001 and 2011 in the infectious diseases department of our institution, a tertiary care centre hosting one of the nine French regional reference centres for BJI, were enrolled in a retrospective cohort study. Patient identification was based on the databases of the institution's infectious diseases department and bacteriology laboratory. Patients with BJI related to diabetic foot or decubitus ulcer were excluded as they required specific management.5 For each patient, data were extracted from medical records, nursing charts and biological software and recorded in a standardized anonymous case report form by two of the study authors (infectious diseases specialists). If patients presented more than one osteoarticular infection site, these were considered independent events for cohort description and outcome analysis, but pooled for tolerance evaluation.
Definitions
BJI diagnosis was based on clinical and biological evidence of infection and at least one reliable bacteriological sample positive for MSSA (i.e. percutaneous joint fluid aspiration, surgical sample and/or blood culture). BJI was classified according to: (i) existence of an orthopaedic implant (i.e. joint prosthesis or peripheral or vertebral osteosynthesis); and (ii) duration of progression, differentiating acute (≤4 weeks) versus chronic infection, calculated from the presumed date of inoculation [i.e. date of device implantation for post-operative orthopaedic device-related infection (ODI) or date of symptom onset for native BJI] up to diagnosis.
The modified Charlson comorbidity index was calculated as previously described.9 Immunosuppression was defined as: (i) steroid therapy comprising >10 mg of prednisone per day or equivalent for ≥3 months; (ii) immunosuppressive therapy during the 2 months before BJI onset; or (iii) chemotherapy for haematological malignancy or solid tumour.
Pristinamycin-related adverse events (AEs) occurring during follow-up were noted and classified according to the Common Terminology Criteria for Adverse Events (CTCAE; National Cancer Institute, 2003). The accountability of pristinamycin in AE onset was left to the clinician's judgement, with the help of a pharmacovigilance specialist in doubtful cases.
Treatment failure included: (i) persisting infection under appropriate antimicrobial therapy; (ii) relapse after interruption of antimicrobial therapy; (iii) septic indication for surgical revision >5 days after primary surgery; (iv) superinfection; and/or (v) death, if related to the BJI or to complication of its management.
Statistical analysis
Descriptive statistics were used to estimate the frequencies of the study variables, described as percentages for dichotomous variables and as medians (IQR) for continuous values. In percentage calculation for each variable, the number of missing values was excluded from the denominator. Non-parametric statistical methods were used to compare groups (Fisher's exact test and the Mann–Whitney U-test), as appropriate. Kaplan–Meier curves were compared between groups using the log-rank test. Determinants of pristinamycin-related AEs and treatment failure were assessed using binary logistic regression, including the clinically relevant variables in each model, and expressed as ORs with 95% CI. To avoid overfitting, multivariate analysis was not performed because of the low number of events. A value of P < 0.05 was considered significant. All analyses were performed using SPSS software version 19.0 (SPSS, Chicago, IL, USA).
Results
Characteristics of the included population
The total cohort included 102 MSSA BJIs in 98 patients, as two patients presented two concomitant infection sites and one had three. The most common presentations were acute BJI (66.7%) and ODIs (67.6%). Eighteen of the implicated isolates were resistant to macrolides (17.6%) and three of these were also resistant to clindamycin (2.9%). Nineteen infections were multimicrobial, including CoNS (n = 6), Enterobacteriaceae (n = 5), various streptococci (n = 5) and enterococci (n = 3), Propionibacterium acnes (n = 3) and Pseudomonas aeruginosa (n = 1). Surgical management was performed in 79 patients (77.5%), including all but three of the patients with ODI (95.7%). All patients received a combination antimicrobial therapy, with a total treatment duration of 29.2 (IQR, 19.2–46.1) weeks, including 7.4 (IQR, 5.0–14.6) weeks' initial intravenous treatment in 91 patients (89.2%). Patient characteristics are detailed in Table 1.
Baseline characteristics of the included patients and comparison regarding the occurrence of pristinamycin-induced AEs or unfavourable outcome
| Total population | Pristinamycin-related severe AEs | Treatment failure | |||||||
|---|---|---|---|---|---|---|---|---|---|
| descriptive data | risk factors (univariate analysis) | descriptive data | risk factors (univariate analysis) | ||||||
| P | OR (95% CI) | P | P | OR (95% CI) | P | ||||
| Number | 102 | 13 | 35 | ||||||
| Demographics | |||||||||
| sex (male) | 62 (60.8%) | 4 (30.8%) | 0.014 | 0.210 (0.059–0.746) | 0.016 | 21 (60.0%) | 0.834 | 0.915 (0.395–2.117) | 0.835 |
| age (years) | 61.2 (45.1–74.7) | 72.5 (55.4–81.8) | 0.068 | 1.027 (0.991–1.063) | 0.140 | 61.4 (48.9–74.1) | 0.817 | 1.002 (0.980–1.024) | 0.893 |
| Comorbidities | |||||||||
| modified CCI | 2.5 (1.0–5.0) | 4 (2–5) | 0.098 | 1.152 (0.958–1.385) | 0.133 | 3 (2–5) | 0.127 | 1.110 (0.965–1.277) | 0.145 |
| BMI (kg/m²) | 25.7 (22.1–28.5) | 22.9 (20.1–25.7) | 0.117 | 0.913 (0.795–1.049) | 0.199 | 24.9 (22.1–28.0) | 0.333 | 0.938 (0.862–1.020) | 0.135 |
| obesity (BMI >30 kg/m²) | 18 (18.6%) | 1 (8.3%) | 0.682 | 0.448 (0.053–3.774) | 0.460 | 6 (18.2%) | 1.000 | 0.944 (0.319–2.796) | 0.918 |
| diabetes | 10 (9.8%) | 1 (7.7%) | 1.000 | 0.760 (0.087–6.638) | 0.804 | 5 (14.3%) | 0.309 | 2.033 (0.546–7.569) | 0.290 |
| immunosuppression | 11 (10.8%) | 2 (15.4%) | 0.607 | 1.922 (0.353–10.462) | 0.450 | 5 (14.3%) | 0.507 | 1.667 (0.470–5.906) | 0.429 |
| chronic renal failure | 14 (13.7%) | 4 (30.8%) | 0.078 | 3.556 (0.907–13.944) | 0.069 | 7 (20.0%) | 0.232 | 2.107 (0.674–6.589) | 0.200 |
| chronic hepatic disease | 2 (2.0%) | 0 (0%) | 1.000 | NC | NC | 2 (5.7%) | 0.118 | NC | NC |
| chronic pulmonary disease | 15 (14.7%) | 0 (0%) | 0.352 | NC | NC | 7 (20.0%) | 0.379 | 1.812 (0.597–5.500) | 0.294 |
| chronic heart failure | 10 (9.8%) | 3 (23.1%) | 0.107 | 3.750 (0.808–17.404) | 0.091 | 3 (8.6%) | 1.000 | 0.790 (0.191–3.267) | 0.745 |
| coronary artery disease | 9 (8.8%) | 3 (23.1%) | 0.078 | 4.560 (0.943–22.048) | 0.059 | 4 (11.4%) | 0.715 | 1.574 (0.394–6.283) | 0.521 |
| cerebrovascular disease | 4 (3.9%) | 1 (7.7%) | 0.454 | 2.167 (0.208–22.568) | 0.518 | 1 (2.9%) | 1.000 | 0.618 (0.062–6.168) | 0.682 |
| peripheral artery disease | 12 (11.8%) | 1 (7.7%) | 1.000 | 0.592 (0.069–5.053) | 0.632 | 6 (14.3%) | 0.748 | 1.405 (0.411–4.801) | 0.588 |
| solid tumour | 14 (13.7%) | 3 (23.1%) | 0.363 | 2.400 (0.555–10.381) | 0.241 | 6 (17.1%) | 0.550 | 1.500 (0.476–4.730) | 0.489 |
| haematological malignancy | 2 (2.0%) | 0 (0%) | 1.000 | NC | NC | 0 (0%) | 0.543 | NC | NC |
| dementia | 5 (4.9%) | 2 (15.4%) | 0.139 | 4.727 (0.709–31.520) | 0.109 | 3 (8.6%) | 0.338 | 3.000 (0.477–18.867) | 0.242 |
| systemic inflammatory disease | 13 (12.7%) | 3 (23.1%) | 0.176 | 2.737 (0.622–12.054) | 0.183 | 7 (20.0%) | 0.132 | 2.500 (0.769–8.128) | 0.128 |
| peptic ulcer | 7 (6.9%) | 2 (15.4%) | 0.248 | 2.764 (0.477–16.023) | 0.257 | 3 (8.6%) | 0.691 | 1.453 (0.306–6.891) | 0.638) |
| tobacco consumption | 31 (30.4%) | 1 (7.7%) | 0.344 | 1.920 (0.585–6.298) | 0.282 | 10 (28.6%) | 0.823 | 0.857 (0.349–2.104) | 0.736 |
| alcohol abuse | 17 (16.7%) | 1 (7.7%) | 0.456 | 0.367 (0.044–3.041) | 0.353 | 7 (20.0%) | 0.582 | 1.400 (0.482–4.070) | 0.537 |
| BJI types | |||||||||
| arthritis | 7 (6.9%) | 1 (7.7%) | 1.000 | 0 (0%) | 0.092 | NC | NC | ||
| osteomyelitis | 8 (7.8%) | 1 (7.7%) | 1.000 | 4 (11.4%) | 0.443 | 2.000 (0.468–8.538) | 0.349 | ||
| vertebral osteomyelitis | 18 (17.6%) | 2 (15.4%) | 1.000 | 1 (2.9%) | 0.005 | 0.085 (0.011–0.668) | 0.019 | ||
| orthopaedic device infection | 69 (67.6%) | 9 (69.2%) | 1.000 | 30 (85.7%) | 0.004 | 4.421 (1.524–12.827) | 0.006 | ||
| including PJI | 38 (55.1%) | 3 (33.3%) | 0.296 | 21 (70.0%) | 0.050 | 2.882 (1.051–7.908) | 0.040 | ||
| including osteosynthesis infection | 27 (39.1%) | 4 (44.4%) | 1.000 | 7 (23.3%) | 0.043 | 0.304 (0.106–0.877) | 0.028 | ||
| including vertebral ODI | 4 (5.8%) | 2 (22.2%) | 0.092 | 2 (6.7%) | 1.000 | 1.286 (0.170–9.704) | 0.807 | ||
| BJI characteristics | |||||||||
| evolution delay (weeks) | 1.8 (0.6–10.5) | 1.6 (0.9–5.9) | 0.528 | 0.9 (0.1–7.9) | 0.137 | 1.003 (0.998–1.009) | 0.233 | ||
| chronic BJI (i.e. evolution delay >4 weeks) | 34 (33.3%) | 4 (30.8%) | 1.000 | 11 (31.4%) | 0.826 | 0.857 (0.357–2.056) | 0.729 | ||
| BJI mechanisms | |||||||||
| haematogenous | 34 (33.3%) | 6 (46.2%) | 0.197 | 12 (34.3%) | 1.000 | 1.043 (0.439–2.479) | 0.923 | ||
| inoculation | 66 (64.7%) | 7 (53.8%) | 0.336 | 22 (62.9%) | 0.830 | 0.905 (0.386–2.123) | 0.819 | ||
| contiguity | 2 (2.0%) | 0 (0%) | 1.000 | 1 (2.9%) | 1.000 | 1.912 (0.116–31.523) | 0.650 | ||
| clinical features | |||||||||
| fever | 56 (54.9%) | 8 (61.5%) | 0.553 | 22 (62.9%) | 0.294 | 1.692 (0.732–3.914) | 0.219 | ||
| sinus tract | 45 (44.1%) | 7 (53.8%) | 0.768 | 17 (48.6%) | 0.529 | 1.364 (0.598–3.112) | 0.460 | ||
| abscess | 40 (39.2%) | 6 (46.2%) | 0.767 | 14 (40.0%) | 1.000 | 1.026 (0.444–2.369) | 0.953 | ||
| biological features | |||||||||
| biological inflammatory syndrome | 95 (93.1%) | 12 (92.3%) | 1.000 | 35 (100%) | 0.092 | NC | NC | ||
| maximum CRP value (mg/L) | 155 (78–258) | 159 (143–217) | 0.543 | 178.3 (88.5–325.0) | 0.080 | 1.002 (0.999–1.006) | 0.143 | ||
| maximum WBC count value (/mm3) | 11 000 (8000–13 700) | 12 000 (9100–15 000) | 0.278 | 11 000 (8700–14 000) | 0.466 | 1.057 (0.964–1.159) | 0.240 | ||
| maximum neutrophil value (/mm3) | 7800 (5600–10 700) | 8700 (6300–11 400) | 0.281 | 7800 (6100–11 100) | 0.425 | 1.058 (0.964–1.160) | 0.238 | ||
| microbiology | |||||||||
| polymicrobial infection | 19 (18.6%) | 1 (7.7%) | 0.451 | 8 (22.9%) | 0.593 | 1.481 (0.534–4.111) | 0.450 | ||
| erythromycin resistance | 18 (17.6%) | 3 (23.1%) | NA | 7 (20.0%) | 0.786 | 1.250 (0.437–3.576) | 0.677 | ||
| clindamycin resistance | 3 (2.9%) | 0 (0%) | NA | 3 (8.6%) | 0.039 | NC | NC | ||
| erythromycin and clindamycin resistance | 3 (2.9%) | 0 (0%) | NA | 3 (8.6%) | 0.039 | NC | NC | ||
| Initial hospitalization | 88 (93.6%) | ||||||||
| initial hospital stay duration (days) | 25 (11–56) | 26 (12–54) | 0.762 | 23.0 (10.8–48.0) | 1.000 | ||||
| Surgical management | 79 (77.5%) | 9 (69.2%) | 0.464 | 31 (88.6%) | 0.079 | 3.133 (0.973–10.091) | 0.056 | ||
| delay from symptoms to surgery | 0.0 (0.0–6.0) | 0.0 (0.0–2.0) | 0.845 | 1.0 (0.0–7.0) | 0.092 | 1.003 (0.997–1.010) | 0.333 | ||
| in the case of ODI | |||||||||
| complete removal of orthopaedic device | 31 (44.9%) | 4 (44.4%) | 1.000 | 8 (26.7%) | 0.007 | 0.237 (0.084–0.670) | 0.007 | ||
| compliance to surgical guidelines | 46 (66.7%) | 7 (77.8%) | 0.707 | 19 (63.3%) | 0.604 | 0.704 (0.253–1.954) | 0.500 | ||
| Medical management | |||||||||
| delay from symptoms to treatment (days) | 15 (5–79) | 14 (10–75) | 0.983 | 12 (3–151.5) | 0.486 | 1.000 (1.000–1.001) | 0.240 | ||
| total treatment duration (weeks) | 29.2 (19.2–46.1) | 34.6 (23.0–69.0) | 0.705 | 42.0 (28.3–66.7) | 0.001 | ||||
| intravenous treatment | 91 (89.2%) | 12 (92.3%) | 1.000 | 31 (88.6%) | 1.000 | 0.919 (0.250–3.384) | 0.900 | ||
| pristinamycin use | |||||||||
| daily dose (mg/kg/day) | 45.8 (40.5–49.3) | 47.6 (45.5–52.6) | 0.072 | 2.733 (1.006–7.424)a | 0.049 | 46.9 (41.7–50.0) | 0.339 | 1.314 (0.680–2.537)a | 0.417 |
| duration (weeks) | 17.3 (9.0–27.7) | 9.3 (1.4–20.4) | 0.071 | 0.998 (0.993–1.003) | 0.494 | 20.4 (10.9–52.3) | 0.191 | 1.003 (1.000–1.007) | 0.042 |
| initial intensive therapy | 30 (29.4%) | 6 (46.2%) | 0.195 | 2.036 (0.619–6.693) | 0.242 | 11 (31.4%) | 0.653 | 1.222 (0.499–2.994) | 0.661 |
| including antistaphylococcal penicillin | 15 (50.0%) | 3 (50.0%) | 0.401 | 1.000 (0.167–5.985) | 1.000 | 8 (72.7%) | 0.134 | 4.190 (0.821–21.399) | 0.085 |
| including glycopeptide | 15 (50.0%) | 3 (50.0%) | 0.401 | 1.000 (1.67–5.985) | 1.000 | 3 (27.3%) | 0.134 | 0.239 (0.047–1.219) | 0.085 |
| maintenance oral therapy | 85 (83.3%) | 8 (61.5%) | 0.050 | 0.637 (0.188–2.143) | 0.464 | 27 (77.1%) | 0.242 | 0.564 (0.228–1.393) | 0.214 |
| including a fluoroquinolone | 57 (67.1%) | 6 (75.0%) | 0.554 | 0.620 (0.191–2.011) | 0.426 | 19 (70.4%) | 0.348 | 1.667 (0.574–4.838) | 0.347 |
| including rifampicin | 18 (21.2%) | 2 (25.0%) | 1.000 | 0.870 (0.173–4.366) | 0.866 | 5 (18.5%) | 0.808 | 0.865 (0.272–2.755) | 0.807 |
| Follow-up and outcome | |||||||||
| follow-up duration (weeks) | 76.4 (29.6–146.9) | 84.7 (28.0–206.1) | 0.812 | 110.1 (54.2–158.3) | 0.059 | ||||
| 1 month CRP level | 9.9 (3.0–32.6) | 9.4 (3.5–41.3) | 0.658 | 1.070 (0.299–3.835) | 0.917 | 16.8 (6.7–47.0) | 0.072 | 1.006 (0.993–1.019) | 0.342 |
| treatment failure | 35 (34.3%) | 5 (38.5%) | 0.758 | 1.250 (0.373–4.188) | 0.718 | NA | NA | NA | |
| persistent infection | 23 (23.0%) | 4 (33.3%) | 0.064 | 1.853 (0.498–6.897) | 0.358 | 23 (65.7%) | NA | NA | NA |
| relapse | 7 (7.0%) | 0 (0%) | 0.588 | NC | NC | 7 (20.6%) | NA | NA | NA |
| need for revision surgery | 31 (30.7%) | 4 (30.8%) | 1.000 | 0.978 (0.275–3.479) | 0.972 | 28 (80.0%) | NA | NA | NA |
| amputation | 5 (5.0%) | 0 (0%) | 1.000 | NC | NC | 4 (11.4%) | NA | NA | NA |
| death | 9 (8.9%) | 1 (7.7%) | 1.000 | 0.869 (0.900–7.707) | 0.900 | 4 (11.4%) | NA | NA | NA |
| superinfection | 12 (11.8%) | 2 (15.4%) | 0.670 | 1.291 (0.249–6.693) | 0.761 | 12 (34.3%) | NA | NA | NA |
CCI, Charlson's comorbidity index; CRP, C-reactive protein; NA, not applicable; NC, not calculable; WBC, white blood cell.
For the percentage calculation of each variable, the number of missing values was excluded from the denominator.
aCalculated for 10 additional mg/kg/day.
Pristinamycin indications and prescription modalities
Pristinamycin was chosen because of previous intolerance to other antimicrobials in 31 cases (30.4%) and instead of rifampicin due to risk of drug interaction in one patient. In all other cases, pristinamycin was the primary choice of the clinician. In four patients, pristinamycin was used as initial empirical therapy before receiving the infectious diseases specialist's advice (as monotherapy in two patients and in combination with amoxicillin/clavulanic acid or ofloxacin in the other two patients). Pristinamycin was prescribed as a part of initial intensive treatment in 30 cases (29.4%), in combination with intravenous antistaphylococcal penicillin (n = 15, 50%) or glycopeptide (n = 15, 50%). Pristinamycin was included in the final oral maintenance therapy in 85 cases, including: (i) 11 patients who received oral antimicrobial therapy from the outset of treatment, without initial intravenous therapy; (ii) 17 cases in which pristinamycin was included in the initial intensive treatment phase and then continued; and (iii) 57 cases in which it was used only in relay of the intensive phase therapy. In these 85 cases, pristinamycin was used as monotherapy in 10 patients (11.8%), including 4 with chronic prosthetic joint infection (PJI) at high risk of relapse, who received pristinamycin as long-term suppressive therapy for a median of 84.5 (IQR, 52.3–104.7) weeks at last follow-up. In other cases, it was mainly used in combination with a fluoroquinolone (n = 57, 67.1%) or rifampicin (n = 18, 21.2%).
Pristinamycin was prescribed at a median daily dose of 3 g, corresponding to 47.6 (IQR, 45.5–52.6) mg/kg, mostly divided into three equal doses (two patients received 2 g twice a day and one patient received 500 mg four times a day). Excluding the patients receiving pristinamycin as long-term suppressive therapy, median treatment duration was 9.3 (IQR, 1.4–20.4) weeks.
Pristinamycin-induced AEs
Fifteen AEs occurred in 14 patients during pristinamycin therapy. One death from acute renal failure in a multipathological 80-year-old man (modified Charlson comorbidity index, 9) was excluded from analysis, because the imputability of pristinamycin was weak. Consequently, the final rate of pristinamycin-induced AEs in the 98 included patients was 13.3%, occurring at a median delay of 21 (IQR, 7–55) days after pristinamycin initiation. The main AEs were gastrointestinal disorders (n = 10), including nausea (n = 8), vomiting (n = 1) and diarrhoea (n = 1). One patient with severe vomiting secondarily developed a duodenal ulcer. The three other AEs were allergic reactions, including one case of isolated blood eosinophil elevation, one maculopapular rash and one anaphylactic reaction, but no cases of acute generalized exanthematous pustulosis. Two AEs were considered severe (CTCAE grade 3–5): the duodenal ulcer and the anaphylactic reaction, in which pristinamycin had been used alone and in combination with ofloxacin, respectively. Eleven AEs (78.6%) led to premature termination of pristinamycin at a median of 3 (IQR, 1–5) days. Two patients had to be admitted to hospital. All had a favourable outcome after scheduled or premature termination of treatment.
As shown in Table 1, women were over-represented (69.2% versus 28.2%; P = 0.014) in the AE subgroup. On univariate analysis, only daily dose was significantly associated with pristinamycin-induced AE (OR, 2.733 for 10 additional mg/kg; 95% CI, 1.006–7.424). The occurrence of pristinamycin-related AEs had no impact on outcome.
Outcome
One patient was still under treatment at inclusion and was excluded from the analysis. At 76.4 (IQR, 29.6–146.9) weeks' follow-up after termination of antimicrobial treatment, outcome was favourable in 67 cases (65.7%). Persistent and relapsing infection was observed in 23 (22.8%) and 7 (7.0%) cases, respectively. Twelve patients (11.8%) presented superinfection, mainly due to CoNS (n = 7). Finally, 31 patients (30.7%) required at least one surgical revision procedure, leading to limb amputation in 5 cases. Nine patients (8.9%) died during follow-up, including two deaths directly related to BJI (uncontrolled sepsis) and two related to infection management (one acute renal failure and one post-surgical myocardial infarction), considered as ‘treatment failures’. The other deaths were due to severe underlying conditions. The baseline characteristics of patients with or without treatment failure were similar (Table 1). Treatment failure rate was influenced by BJI type and surgical management, ranging from 15.2% for native BJI to 59.5% for ODI with conserved implant (Table 2). ODI was a risk factor for unfavourable outcome (OR, 4.421; 95% CI, 1.524–12.827) on univariate analysis, particularly when the implant was retained (OR, 4.217; 95% CI, 1.493–11.909; P = 0.007). Pristinamycin prescription modalities and AE onset did not impact outcome. In the 75 patients receiving pristinamycin-based maintenance therapy in combination with rifampicin or a fluoroquinolone, the type of companion drug had no impact on outcome (Figure 1). Of note, outcome was not favourable in the three patients carrying erythromycin- and clindamycin-resistant isolates (P = 0.039). However, surgical management for these three patients with chronic PJI was not optimal, due to comorbidities and/or technical reasons, and consisted of debridement with implant conservation or abstention from surgery.
Comparison of patients' outcome according to BJI type and surgical management
| Native BJI (n = 33) | ODI with implant retention (n = 37) | ODI with implant removal (n = 31) | |||||||
|---|---|---|---|---|---|---|---|---|---|
| favourable outcome | treatment failure | P | favourable outcome | treatment failure | P | favourable outcome | treatment failure | P | |
| Number | 28 (84.8%) | 5 (15.2%) | 15 (39.5%) | 22 (59.5%) | 23 (74.2%) | 8 (25.8%) | |||
| Demographics | |||||||||
| sex (male) | 18 (64.3%) | 4 (80.0%) | 0.643 | 8 (53.3%) | 12 (54.5%) | 1.000 | 15 (65.2%) | 5 (62.5%) | 1.000 |
| age (years) | 62.3 (46.3–77.5) | 61.0 (61.0–64.9) | 0.860 | 70.4 (48.5–79.8) | 59.4 (47.1–75.0) | 0.412 | 56.5 (44.4–67.9) | 62.6 (54.9–66.8) | 0.391 |
| modified CCI | 2.5 (0.0–4.3) | 4.0 (3.0–5.0) | 0.508 | 3.0 (1.5–4.0) | 3.5 (2.0–5.8) | 0.472 | 2.0 (0.5–3.5) | 3.0 (1.5–4.5) | 0.410 |
| BJI characteristics | |||||||||
| arthritis | 7 (25.0%) | 0 (0%) | 0.559 | NA | NA | NA | NA | NA | NA |
| osteomyelitis | 4 (14.3%) | 4 (80.0%) | 0.008 | NA | NA | NA | NA | NA | NA |
| vertebral osteomyelitis | 17 (60.7%) | 1 (20.0%) | 0.152 | NA | NA | NA | NA | NA | NA |
| PJI | NA | NA | NA | 10 (66.7%) | 16 (72.7%) | 0.728 | 7 (30.4%) | 5 (62.5%) | 0.206 |
| osteosynthesis infection | NA | NA | NA | 3 (20.0%) | 4 (18.2%) | 1.000 | 16 (69.6%) | 3 (37.5%) | 0.206 |
| vertebral ODI | NA | NA | NA | 2 (13.3%) | 2 (9.1%) | 1.000 | 0 (0%) | 0 (0%) | NA |
| evolution delay (weeks) | 2.1 (0.5–7.2) | 0.0 (0.0–39.9) | 0.860 | 1.3 (0.6–2.8) | 0.7 (0.2–9.4) | 0.641 | 3.7 (1.5–19.4) | 1.4 (0.7–2.5) | 0.095 |
| chronic BJI | 10 (35.7%) | 2 (40.0%) | 1.000 | 2 (13.3%) | 7 (31.8%) | 0.432 | 11 (47.8%) | 2 (25.0%) | 0.412 |
| Medical management | |||||||||
| total treatment duration | 28.3 (20.7–42.4) | 21.9 (11.7–38.1) | 0.556 | 23.7 (14.6–45.4) | 45.1 (28.3–95.6) | 0.024 | 24.3 (16.9–30.2) | 42.7 (38.1–62.6) | 0.003 |
| pristinamycin use | |||||||||
| daily dose (mg/kg/day) | 46.9 (40.5–50.0) | 37.5 (35.7–54.3) | 0.379 | 43.5 (40.5–49.2) | 46.7 (42.3–49.6) | 0.505 | 42.9 (38.5–46.9) | 47.3 (43.5–50.1) | 0.119 |
| duration (weeks) | 17.3 (9.5–25.7) | 9.0 (4.0–22.4) | 0.586 | 14.7 (7.4–24.3) | 20.3 (11.9–36.6) | 0.294 | 16.3 (8.4–25.4) | 21.9 (18.3–52.3) | 0.174 |
| initial intensive therapy | 5 (17.9%) | 0 (0%) | NA | 4 (26.7%) | 7 (31.8%) | 0.061 | 9 (39.1%) | 4 (50.0%) | 0.559 |
| including antistaphylococcal penicillin | 3 (60.0%) | NA | 0 (0%) | 5 (71.4%) | 4 (44.4%) | 3 (75.0%) | |||
| including glycopeptide | 2 (40.0%) | NA | 4 (100%) | 2 (28.6%) | 5 (55.6%) | 1 (25.0%) | |||
| maintenance therapy | 24 (85.7%) | 3 (60.0%) | 0.554 | 12 (80.0%) | 17 (77.3%) | 1.000 | 21 (91.3%) | 7 (87.5%) | 0.539 |
| including a fluoroquinolone | 16 (64.0%) | 3 (100%) | 8 (66.7%) | 10 (62.5%) | 14 (66.7%) | 6 (100.0%) | |||
| including rifampicin | 6 (24.0%) | 0 (0%) | 3 (25.0%) | 5 (31.3%) | 4 (19.0%) | 0 (0%) | |||
| Follow-up (weeks) | 69.3 (45.8–95.8) | 32.6 (7.1–65.4) | 0.680 | 89.4 (62.4–141.6) | 112.4 (51.0–183.5) | 0.627 | 83.7 (32.9–196.5) | 123.0 (105.1–173.4) | 0.291 |
| 1 month CRP level (mg/L) | 9.6 (3.0–33.8) | 9.7 (5.8–36.0) | 0.589 | 5.0 (3.4–29.3) | 18.0 (8.1–46.3) | 0.402 | 4.6 (3.0–23.0) | 19.0 (11.8–40.5) | 0.242 |
CCI, Charlson's comorbidity index; NA, not applicable; CRP, C-reactive protein.
For the percentage calculation of each variable, the number of missing values was excluded from the denominator.
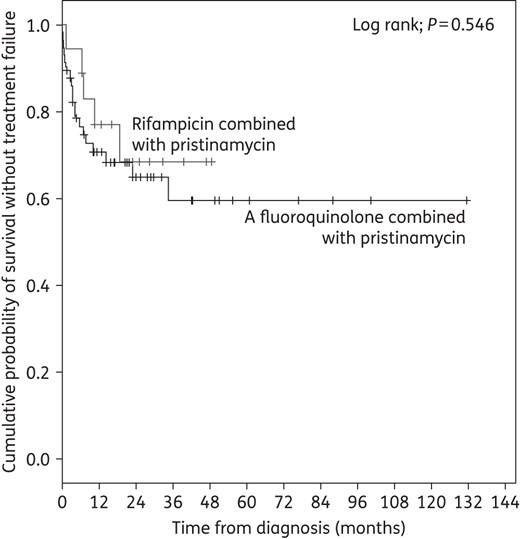
Kaplan–Meier curve for the cumulative risk of treatment failure according to pristinamycin's companion drug during oral maintenance therapy.
Discussion
This study provides the largest published series of staphylococcal BJI treated with long-course pristinamycin, highlighting good efficacy, with a global success rate of 65.7%. Only a few other case series focused on pristinamycin in BJI, with similar findings.10 In 2005, Ng and Gosbell11 described 21 adults with BJI treated with pristinamycin (1 g three times a day for a median of 6 months), including 12 ODIs, principally caused by MRSA. The cure rate was 33%, with an additional 26% of patients classified as ‘probable cure’. Furthermore, 19% received long-term antimicrobial suppressive therapy, leading to a global rate of controlled sepsis of 77.8%. In 2008, Ruparelia et al.12 reported 21 patients treated with pristinamycin (1 g twice daily for a median of 3 months) for BJI, including 16 ODIs, mainly caused by CoNS, with a cure rate of 52% and suppressive therapy in 19% of patients. In another retrospective series of 22 patients, the cure rate was estimated at 32%, with 59% of patients under long-term suppressive therapy.13 Of note, our centre previously enrolled 127 additional patients in an unpublished retrospective study in 2001, mostly receiving pristinamycin as suppressive therapy (85%).14 In paediatrics, only one study assessed pristinamycin in BJI, in 50 children, with a cure rate of 88%.15 Considering that the majority of patients included in these studies had chronic and/or complex ODI, outcome in pristinamycin-treated Gram-positive BJI was satisfactory. In this setting, ODI and absence of orthopaedic device removal appeared as predictive factors for failure in the present series. Importantly, the nature of the companion drug in pristinamycin-based maintenance therapy had no impact on outcome; notably, there was no unfavourable effect of a fluoroquinolone compared with rifampicin, suggesting that any drug–drug interaction via the P450 cytochrome is without clinical impact. All patients with erythromycin- and clindamycin-resistant isolates experienced treatment failure. These three strains harboured the erythromycin ribosome methylase (erm) gene, conferring cross-resistance to macrolides, lincosamides and streptogramin B (MLSB resistance phenotype), leaving only the bacteriostatic activity of the streptogramin A component.3 Consequently, the use of pristinamycin in erythromycin- and lincosamide-resistant isolates should probably be avoided in difficult-to-treat infections such as BJI. However, this result must be considered with caution due to the small number of cases and the non-optimal surgical management of these patients with PJI (i.e. debridement with implant conservation in patients with chronic PJI).
Tolerance of pristinamycin was acceptable, with an AE rate of 13.3% and only two severe AEs. This rate of pristinamycin intolerance was lower than the usual AE rate in long-term treatment of MSSA BJI, estimated at 45%, with 15% severe AEs.16 This finding was similar to those of other series, in which intolerance was reported in 8%–15% of patients.10,11,13,15 As expected, the most common reported side effects were gastrointestinal disorders. No severe cutaneous reaction was observed and, especially, no acute generalized exanthematous pustulosis as classically described.17 The daily dose correlated with AE occurrence, confirming the impact of dose reduction in improving digestive tolerance in >25% of published cases.11–13 However, the impact of dose reduction on infection course was not evaluated in these cohorts.
The present study is subject to limitations, including its retrospective nature and the inherent lack of controls. The wide heterogeneity of infection types (native BJI and ODI), surgical management and medical treatment (type and duration of initial intensive and maintenance phases) also constitute a limitation to generalization. The prevalence of non-severe AEs may have been underestimated due to declaration bias. As in most non-controlled studies of BJI, concomitant use of various other antibiotics calls for caution in interpreting the role of pristinamycin in both AEs and treatment success. Nevertheless, the study provides reassuring data regarding efficacy and tolerance of pristinamycin in BJI, which constitutes a first step towards wider use in this indication. However, pharmacokinetic studies evaluating pristinamycin bone diffusion and optimal dosage regimen are required,18 as well as assessment of pristinamycin's impact on the pathophysiological mechanisms of staphylococcal BJI. In particular, nothing is known about its ability: (i) to inhibit biofilm formation and/or to penetrate and be active inside staphylococcal biofilms;19 and (ii) to eradicate the intracellular bacterial reservoir that could lead to chronicity and relapse.20–22 In the absence of such data, rifampicin-based combination therapy (especially in association with fluoroquinolones) still constitutes the gold standard for staphylococcal BJI treatment; pristinamycin should not be used as first-line antimicrobial therapy in MSSA BJI, although it appeared to be an effective and well-tolerated alternative therapeutic option, which may be useful in the case of multimicrobial infection or in patients with multiple antibiotic intolerance. In this setting, it can be indicated at a daily dose of 50 mg/kg/day, without increasing posology to avoid pristinamycin-induced gastrointestinal disorders. Finally, pristinamycin should probably be used with caution against macrolide- and lincosamide-resistant isolates because of possible excess risk of treatment failure.
Funding
This study was carried out as part of our routine work.
Transparency declarations
None to declare.
Acknowledgements
Members of the Lyon Bone and Joint Infection Study Group
Physicians: Florence Ader, François Biron, André Boibieux, Evelyne Braun, Christian Chidiac, Fatiha Daoud, Tristan Ferry, Yves Gillet, Laure Hees, Johanna Lippmann, Patrick Miailhes, Thomas Perpoint, Sandrine Roux, Julien Saison, Marie-Paule Vallat and Florent Valour. Surgeons: Cédric Barrey, Jean-Baptiste Bérard, Fabien Boucher, Pierre Breton, Olivier Cantin, Frédéric Dalat, Romain Desmarchelier, Michel-Henry Fessy, Timothée Jacquesson, Emmanuel Jouanneau, Sébastien Lustig, Ali Mojallal, Philippe Neyret, Adrien Peltier, Olivier Reynaud, Hristo Shipkov, Francesco Signorelli, Thibault Vermersch and Anthony Viste. Microbiologists: Céline Dupieux, Frederic Laurent, Jean-Philippe Rasigade and François Vandenesch. Nuclear medicine: Francesco Giammarile, Marc Janier and Isabelle Morelec. Pharmacokinetics/pharmacodynamics specialists: Marie-Claude Gagnieu, Sylvain Goutelle and Michel Tod. Clinical research assistant: Eugénie Mabrut.
References
Author notes
Members are listed in the Acknowledgements section.
