


Knowledge of the patterns of antibiotic consumption within a population provides valuable information on when, where and to whom antibiotics are prescribed. Such knowledge is critical in informing possible public health interventions to reduce inappropriate antibiotic use. The aims of this study were to (i) determine national patterns of antibiotic consumption, including assessment of seasonal variation in prescribing, and (ii) explore potential associations between antibiotic consumption and patient characteristics, such as age, sex and ethnicity.
Data on all subsidized antibiotic dispensing in New Zealand between 1 January 2006 and 31 December 2014 were obtained and stratified according to age, sex and ethnicity. Antibiotic dispensing was expressed as the number of DDDs per 1000 population per day (DID).
Total antibiotic consumption in New Zealand increased by 49% from 17.3 DID in 2006 to 25.8 DID in 2014. The increase in antibiotic consumption occurred in all ages and amongst all ethnic groups. The use of extended-spectrum penicillins, which almost doubled in the study period, made a major contribution to the overall increase and was highest in young children and in Pacific peoples. Consumption of quinolones increased early in the study period and then declined from 2011 onwards.
Future work should focus on identifying the appropriateness of antibiotic prescribing, particularly for penicillin prescribing in Pacific peoples and children, and on both reducing unwarranted antibiotic use and improving antibiotic selection when therapy is indicated.
Introduction
Antimicrobial resistance is one of the most urgent threats to public health. As the prevalence of antimicrobial resistance increases, treatment of infections becomes increasingly challenging; a pressure compounded by the scarcity of new antimicrobials in the pharmaceutical pipeline.1,2 One of the key drivers of antimicrobial resistance is the use and misuse of antimicrobials and high levels of community antimicrobial consumption have been found to correlate with high frequencies of bacterial resistance in some settings.3 As such, knowledge of the patterns of antimicrobial consumption within a population provides valuable information on when, where and to whom antimicrobials are prescribed. Such knowledge is critical in targeting and prioritizing possible public health interventions to reduce inappropriate antimicrobial use.
Recent data suggest that New Zealand has high rates of antimicrobial consumption compared with other developed countries.4 However, unlike most other developed countries, New Zealand has strikingly high rates of infectious diseases, characterized by significant sociodemographic inequality.5 In particular, rates of common diseases, such as respiratory tract infections and skin infections, are markedly higher in Māori (indigenous New Zealander) and Pacific populations within New Zealand compared with other ethnic groups.6,7 Despite this disparity, there is evidence to suggest that antimicrobial use in New Zealand may also be inequitable, with one regional study demonstrating low rates of antimicrobial use in Māori compared with non-Māori populations.8 To date, however, there have been no studies systematically assessing the trends, patterns and demographics of antimicrobial use across the entire New Zealand population and relatively few studies internationally have been able to stratify population antimicrobial consumption patterns by demographic variables.
Accordingly, the aims of this study were to (i) determine national patterns of antimicrobial consumption, including assessment of seasonal variation in prescribing, and (ii) explore potential associations between antimicrobial consumption and demographic factors, such as age, sex and ethnicity.
Methods
Setting and data source
New Zealand is an island nation in the South West Pacific, with a population of approximately 4.47 million. The population is ethnically diverse, consisting of the following major ethnicities: 67% European, 15% Māori, 10% Asian, 7% Pacific peoples and 1% of other ethnicities (www.stats.govt.nz). New Zealand has a predominantly publicly funded healthcare system, although patients ≥6 years old (at the time of this study) paid a fee to access primary care and a fee for prescription medications, including antibiotics. The exact fee for prescription medication depends on whether the medication is fully or partially subsidized by the New Zealand Government.
Data on government-subsidized community medication dispensing (both fully and partially funded) are maintained in a central data warehouse, the ‘National Pharmaceutical Collection’.
Pharmaceutical claims data include the drug formulation and the number of units prescribed for each record (prescription), which allows calculation of the total amount dispensed. Data on all subsidized antimicrobial dispensing in New Zealand between 1 January 2006 and 31 December 2014 were obtained from the National Pharmaceutical Collection. Data linkage using an encrypted National Health Index number was then used to link each dispensing record to the age, sex and ethnicity of the patient.
Data analysis
In this study, information on ‘antibacterials for systemic use (ATC group J01)’ was included (subsequently referred to as ‘antibiotics’). This category excludes topical antibiotics, antimycobacterials, antifungals and antivirals. Similar to previously described methodology,9 we divided the J01 group into pharmacological subgroups: tetracyclines (J01A), penicillins (J01C), cephalosporins (J01D), sulphonamides and trimethoprim (J01E), macrolides and lincosamides (J01F), and quinolones (J01M). We also included nitrofurantoin, a commonly prescribed urinary antiseptic, in our analysis.
In keeping with the WHO Collaborating Centre for Drug Statistics Methodology (www.whocc.no/atc_ddd_index), antimicrobial dispensing was expressed as the number of DDDs per 1000 population per day (DID). DID is presented in total and disaggregated by patient characteristics. Because DDDs assume an adult weight, they are not a suitable basis for comparisons across paediatric age groups. Acknowledging this limitation, however, in this study DDD data are predominantly presented to facilitate comparison with previously published literature.
For comparison of community antimicrobial consumption in New Zealand with other countries, we searched the literature for comparable studies using similar methodology. We included national antimicrobial consumption data on ATC subgroup J01 measured in DID from countries participating in the European Surveillance of Antimicrobial Consumption (ESAC, www.ua.ac.be/ESAC) project and from data available from the Organization for Economic Co-operation and Development (OECD, www.oecd.org).
Statistical analysis
Population denominator data were obtained from Statistics New Zealand (http://www.stats.govt.nz) and rates of antibiotic consumption were stratified according to age, sex and ethnicity. For analysis, ethnicity was grouped into five major ethnic groupings: Māori, Pacific peoples, Asian, Middle Eastern/Latin American/African (MELAA) and European/other. Linear regression was performed on annual totals to assess the statistical significance of trends over time. The calculation of DID and disaggregation by year, age, sex and ethnicity was carried out using SAS Enterprise Guide 4.3. Linear regression and CI were calculated by STATA (Version 13).
Results
Total antimicrobial consumption
The dataset comprised approximately 36 million records. Of these, 1.12% (403 164) were excluded because they were unable to be linked to demographic data. Total antibiotic consumption in New Zealand increased significantly by 49% from 17.31 DID in 2006 to 25.79 DID in 2014 (Table 1). Antibiotic consumption was highest in 2013 at 25.92 DID. The average annual increase from 2006 to 2014 was 1.06 DID per year (95% CI = 0.74–1.38) (P < 0.001). Overall, penicillins (J01C) were the most heavily consumed group of antibiotics (13.06 DID in 2014), followed by tetracyclines (J01A, 6.53 DID in 2014) and then macrolides (J01F, 2.93 DID in 2014) (Table 1).
Antibiotic consumption for systemic use in primary care in New Zealand, 2006–14, expressed in DID
| Pharmacological group | 2006 | 2007 | 2008 | 2009 | 2010 | 2011 | 2012 | 2013 | 2014 | Average annual increase (95% CI) | P |
|---|---|---|---|---|---|---|---|---|---|---|---|
| Tetracyclines (J01A) | 3.97 | 4.60 | 5.13 | 5.39 | 5.59 | 5.92 | 6.37 | 6.52 | 6.53 | 0.32 (0.25–0.38) | <0.001 |
| Penicillins (J01C) | 8.86 | 9.89 | 11.08 | 11.54 | 11.90 | 12.64 | 12.85 | 13.03 | 13.06 | 0.51 (0.36–0.67) | 0.001 |
| Cephalosporins (J01D) | 0.58 | 0.63 | 0.71 | 0.74 | 0.82 | 0.86 | 0.82 | 0.93 | 0.99 | 0.05 (0.04–0.06) | <0.001 |
| Sulphonamides and trimethoprim (J01E) | 0.84 | 0.94 | 1.01 | 1.06 | 1.10 | 1.16 | 1.19 | 1.18 | 1.17 | 0.04 (0.03–0.05) | <0.001 |
| Macrolides, lincosamides and streptogramins (J01F) | 2.14 | 2.40 | 2.68 | 2.87 | 2.97 | 3.15 | 3.40 | 3.10 | 2.93 | 0.12 (0.04–0.19) | 0.007 |
| Quinolones (J01M) | 0.59 | 0.67 | 0.77 | 0.81 | 0.81 | 0.79 | 0.78 | 0.65 | 0.58 | 0.00 (−0.03–0.03) | 0.879 |
| Nitrofurantoin | 0.32 | 0.35 | 0.37 | 0.40 | 0.43 | 0.48 | 0.51 | 0.52 | 0.54 | 0.03 (0.03–0.03) | <0.001 |
| Total (J01) | 17.31 | 19.48 | 21.75 | 22.81 | 23.62 | 25.01 | 25.91 | 25.92 | 25.79 | 1.06 (0.74–1.38) | <0.001 |
Statistically significant increases in consumption were detected for all pharmaceutical groups, with the exception of quinolones (J01M) for which consumption peaked in 2009 and 2010 at 0.81 DID and then reduced significantly to 0.58 DID in 2014 (Table 1). Between 2006 and 2014, consumption of penicillins (J01C) increased by 4.20 DID, accounting for almost half the increase in total antibiotic consumption, followed by tetracycline (J01A) consumption, which increased by 2.56 DID.
Overall, the most heavily consumed individual antibiotics were doxycycline (6.36 DID in 2014) and amoxicillin (6.35 DID in 2014), which together accounted for 49.3% of all consumption in 2014. This was followed by amoxicillin/clavulanate (4.61 DID in 2014) and flucloxacillin (1.73 DID in 2014) (Table 2).
Ten most heavily consumed antibiotics in primary care in New Zealand, 2014, expressed in DID
| Antibiotic | DID | Proportion of all DID in 2014 (%) |
|---|---|---|
| Doxycycline | 6.36 | 24.7 |
| Amoxicillin | 6.35 | 24.6 |
| Amoxicillin/clavulanate | 4.61 | 17.9 |
| Flucloxacillin | 1.73 | 6.7 |
| Roxithromycin | 1.40 | 5.4 |
| Erythromycin | 1.36 | 5.3 |
| Trimethoprim | 0.65 | 2.5 |
| Trimethoprim/sulfamethoxazole | 0.52 | 2.0 |
| Nitrofurantoin | 0.52 | 2.0 |
| Ciprofloxacin | 0.46 | 1.8 |
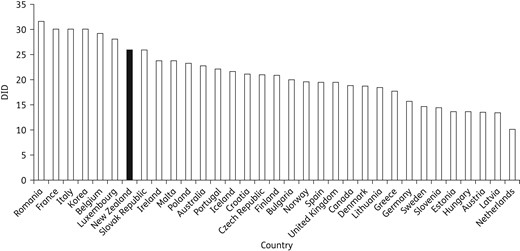
Antibiotic consumption of 34 OECD and European countries, and New Zealand, 2013, expressed as DID.
Association of antimicrobial consumption with patient characteristics
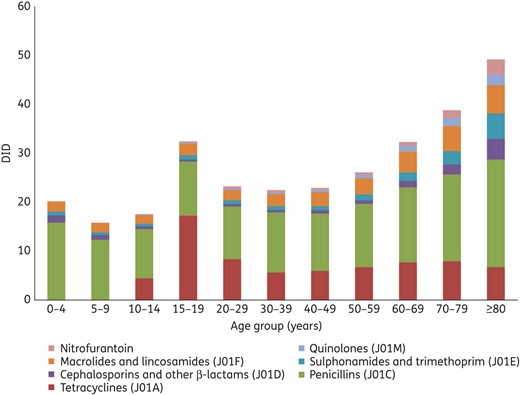
Antibiotic consumption for systemic use (ATC group J01) by age group, 2014, expressed as DID.
Consumption of all antimicrobials was consistently and significantly higher in females, although increased in both sexes over the study period. In both sexes, the highest rates of consumption were for penicillins (J01C) (Table S2, available as Supplementary data at JAC Online).
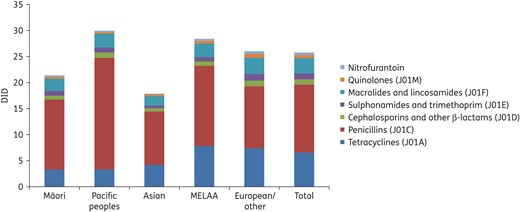
Antibiotic consumption for systemic use by ethnic group, 2014, expressed as DID.
Seasonality
There was marked seasonal variation in antimicrobial consumption, with consumption consistently higher in the Southern Hemisphere winter quarter of June to August compared with the summer quarter of December to February (Figure S1, available as Supplementary data at JAC Online). In 2014, total consumption (J01) was 40.9% greater (IQR = 34.7%–43.9%) in the winter quarter compared with the summer quarter. This seasonal variation was largely driven by variation in consumption of penicillins and, to a lesser extent, macrolides and tetracyclines (Figure S1).
Discussion
In this study, we assessed the trends and demographics of antimicrobial consumption across the entire New Zealand population. Antibiotic use increased significantly by 49% between 2006 and 2014, and this increase occurred in all ages and amongst all ethnic groups.
The increase in overall antibiotic consumption was generally driven by an increase in consumption of penicillins, particularly extended-spectrum penicillins (i.e. amoxicillin), which almost doubled in consumption between 2006 and 2014, and represented approximately one-quarter of all antibiotic use in New Zealand. Importantly, as an extended-spectrum penicillin, amoxicillin has the potential to facilitate resistance in a wide range of bacteria, including some Gram-negative Enterobacteriaceae, such as Escherichia coli.10 There is considerable potential for overuse of amoxicillin, as its indications are generally for conditions whose clinical features overlap with those of viral illness, such as respiratory tract infections, exacerbations of COPD and pharyngitis. Similarly, the high use of amoxicillin/clavulanate is also of concern, particularly given the limited ‘first-line’ clinical indications for use of this agent in New Zealand (mammalian bites, diabetic foot infections and periorbital cellulitis).11 The observation that amoxicillin/clavulanate was the third most heavily consumed antibiotic in 2014 suggests there is potentially a considerable amount of inappropriate prescribing for this agent.
Consumption of quinolones increased early in the study period and then declined from 2011 onwards. Quinolones could be considered a priority class for reducing inappropriate consumption, as quinolone resistance can severely limit treatment options for serious bacterial infections, such as complex urinary tract infections and some gastrointestinal infections. Multiple factors may have contributed to the observed decline in quinolone consumption, which began with a reduction in norfloxacin dispensing from 2010 onwards. These factors include educational campaigns around the appropriate use of quinolones (particularly the use of norfloxacin as a second-line agent in the treatment of uncomplicated community urinary tract infection) and efforts by community microbiology laboratories to release selectively the antimicrobial susceptibility data on appropriate first-line empirical antibiotic therapy.
We also observed important differences in antibiotic use according to demographic factors, such as age, sex and ethnicity. For example, overall antibiotic consumption was highest in children and the elderly, a likely reflection of the higher rates of infectious diseases in these groups. In adult patients, consumption of all antibiotic classes was highest in the elderly, with the exception of tetracyclines (specifically doxycycline), which had a notable peak in consumption in the 15–19 year age group. This may reflect the recommended usage of doxycycline in adolescents for the treatment of acne and perhaps to a lesser extent in the treatment of sexually transmitted infections.11 In general, antibiotic consumption was higher in females than males, in keeping with other studies assessing antibiotic use in the community.12,13 The reasons for this are uncertain, but may include higher rates of urinary tract infections in females or differential utilization of primary care services.
When stratified by ethnicity, antibiotic use was lowest in Asians and Māori compared with the European/other, MELAA and Pacific ethnic groups. For Māori, this is at distinct odds with their high burden of infectious diseases and warrants further exploration.5 One previous study has specifically assessed antibiotic use and ethnicity in New Zealand and, similar to our findings, observed lower rates of antibiotic consumption in Māori compared with non-Māori.8 These authors hypothesized that some of these differences in antibiotic use may be related to barriers to healthcare access, including the cost of primary care and prescriptions, and cultural differences in knowledge or understanding of infectious diseases and antibiotics.
Overall, antibiotic consumption was highest in Pacific peoples and this was most marked for penicillins, where consumption in Pacific peoples was almost twice as high as in Asian or European/other ethnic groups. Pacific peoples are have some of the highest rates of infectious diseases in New Zealand, particularly common infections, such as respiratory tract infections and skin infections,6,7 and it is possible that much of the antibiotic consumption in this group is appropriate to the high disease burden. However, given the high rates of antibiotic use in this group, future work should attempt to understand better the specific indications for antibiotic prescribing.
Compared with other European and OECD countries, including Australia, the UK and Canada, total antibiotic consumption in New Zealand was high, ranking amongst the highest 30% of these countries.9 In addition, the median seasonal variation in total antibiotic consumption in New Zealand was 41%, which, when compared with ESAC data, was second only to Hungary (47%) and Luxembourg (41%).9 Taken together, these findings suggest that antibiotic consumption in New Zealand is comparatively high by international standards and it is possible that a large proportion of antibiotics may be prescribed for seasonal conditions in which antibiotic treatment has no benefit (e.g. viral upper respiratory tract infection).13
There were a number of limitations with this study. In particular, dispensing data do not provide any information on the indications for, or appropriateness of, antimicrobial usage. Such information is important when comparing antimicrobial consumption across demographic groups that may have a differential incidence of infections (e.g. urinary tract infections in females, skin infections in children). Moreover, dispensing data are unable to account for factors such as adherence to therapy. In addition, there were several changes in the funding system for antibiotics in New Zealand over the study period that may have partly impacted on antibiotic consumption trends. From July 2004, the co-payment for patient contributions reduced from $15 NZD (adult)/$10 NZD (child) to $3 NZD. This funding change may partly explain the increase in community antibiotic consumption observed between 2006 and 2008. Co-payments have subsequently been raised to $5 from 1 January 2014, although the potential impact of this change on community antibiotic consumption in New Zealand is not yet clear. Finally, an acknowledged limitation of many antimicrobial consumption studies is the use of DDD as a proxy for assessing paediatric antimicrobial consumption. Future work in New Zealand should attempt to specifically assess the paediatric antimicrobial consumption using appropriate measures, such as packages.
There were some notable strengths to this work. In particular, our dataset provides high-level coverage of the population of interest and New Zealand's use of a universal health number across the health sector supports highly effective data linkage, including use of linked sociodemographic data. This allowed us to assess the trends and demographics of antimicrobial consumption across the entire nation.
In conclusion, this report provides valuable baseline information on patterns of outpatient antibiotic consumption across the New Zealand population and serves as an ongoing platform on which to gauge the effects of potential future community-based antimicrobial stewardship efforts. Notable findings include: (i) a marked increase in consumption over the study period; (ii) age, sex and ethnic differences in antibiotic consumption, particularly in relation to penicillins; and (iii) high rates of antibiotic consumption in New Zealand compared with similar developed countries. These priority agents and populations should now be the focus of clinical studies on the appropriateness of antimicrobial prescription to develop interventions to address antimicrobial resistance in New Zealand.
Funding
This work was supported by the New Zealand Ministry of Health.
Transparency declarations
None to declare.
References
