


Abstract
To use Monte Carlo simulation with an integrated pharmacokinetic–pharmacodynamic (PK-PD) model to evaluate guideline-recommended antimicrobial prophylaxis (AP) regimens with anaerobic coverage in abdominal surgery.
AP regimens were tested in simulated subjects undergoing elective abdominal surgery using relevant PK models and pathogen distributions in surgical site infections (SSIs). Predicted cumulative target attainment was the percentage of simulated subjects with free (unbound) antimicrobial plasma concentrations above the MICs for potential SSI pathogens.
Cefazolin plus metronidazole covered SSI aerobes in 70% and the Bacteroides fragilis group in 99% of subjects, whereas cefoxitin only covered aerobes and anaerobes in 63% and 27% of cases, respectively. The broad-spectrum ceftriaxone plus metronidazole covered aerobes in 82% and anaerobes in 99% of simulations, while ertapenem covered aerobes in 88% and anaerobes in 90% of cases. Clindamycin covered the B. fragilis group in only 11% of cases. For cefazolin, 2 g doses maintained target attainment in simulated subjects from 80 to 120 kg, whereas 1 g doses were associated with lower target attainment against potential Gram-negative pathogens even in those <80 kg. For gentamicin, 3 mg/kg doses were comparable to the suggested 5 mg/kg, but superior to the traditional 1.5 mg/kg.
This study demonstrates the use of PK-PD to inform decisions regarding AP in abdominal surgery. In this case, the findings support avoiding cefoxitin, avoiding clindamycin for anaerobic coverage, selecting 2 g doses of cefazolin even in patients <80 kg and using 3 mg/kg doses of gentamicin.
Introduction
Practice guidelines (2013) developed by the American Society of Health-System Pharmacists, IDSA, Surgical Infection Society and Society for Healthcare Epidemiology of America provide an extensive review with recommendations for the selection, timing and duration of antimicrobial prophylaxis (AP) in surgery.1 The principles of AP are founded on reducing the risk of post-operative surgical site infections (SSIs) by providing effective antimicrobial plasma and tissue concentrations during surgery from incision to closure. The significance of concentrations at incision has been shown in several studies where AP given too early or late relative to the start of surgery was associated with higher rates of SSI.2–4 As such, the guidelines recommend administering pre-operative doses within 1 h prior to incision. The importance of antimicrobial concentrations at the end of surgery has also been shown.5,6 In our previous pharmacokinetic–pharmacodynamic (PK-PD) study of AP in colorectal surgery, gentamicin closure concentration was identified as one of the strongest risk factors for SSI.6 To maintain adequate concentrations during surgery, the guidelines suggest intra-operative re-dosing based on twice the estimated half-life of the antimicrobial, including 4 h for cefazolin, 2 h for cefoxitin and 6 h for clindamycin. For other agents, re-dosing is recommended during unusually long operations.
Given the importance of intra-operative antimicrobial concentrations in providing effective AP, PK-PD studies are required to characterize and translate these principles into practice. The guidelines also acknowledge the need for research on ‘… targeted antimicrobial concentrations and intraoperative monitoring of … serum and tissue concentrations to optimize efficacy’.1 Our objective was to use Monte Carlo simulation (MCS) with an integrated PK-PD model to evaluate guideline-recommended AP regimens with anaerobic coverage in abdominal surgery.
Methods
Simulated subjects and AP
MCS methods (SYSTAT, version 12), depicted in Figure 1, were used to simulate 5000 study subjects receiving AP with anaerobic coverage in elective abdominal surgery. Patient demographics were characterized by Gaussian distributions of body weight (75.0 ± 11.3 kg) and normal renal function [creatinine clearance (CLCR) of 90.0 ± 9.0 mL/min/72 kg]. For validation, simulations were repeated using different seeds and sample sizes up to 10 000 subjects.
MCS of AP with anaerobic coverage in elective abdominal surgery. aRecommended AP in surgery (cefazolin 2 g plus metronidazole 500 mg, cefoxitin 2 g), broad-spectrum alternatives (ceftriaxone 2 g plus metronidazole 500 mg, ertapenem 1 g) and non-β-lactam alternatives (gentamicin 5 mg/kg plus metronidazole 500 mg, gentamicin 5 mg/kg plus clindamycin 900 mg, levofloxacin 500 mg plus metronidazole 500 mg, levofloxacin 500 mg plus clindamycin 900 mg) administered as single intravenous doses 1 h pre-incision.
Guideline-recommended AP regimens were studied (cefazolin 2 g plus metronidazole 500 mg, cefoxitin 2 g), as well as broad-spectrum alternatives (ceftriaxone 2 g plus metronidazole 500 mg, ertapenem 1 g) and non-β-lactam alternatives (gentamicin 5 mg/kg plus metronidazole 500 mg, gentamicin 5 mg/kg plus clindamycin 900 mg, levofloxacin 500 mg plus metronidazole 500 mg, levofloxacin 500 mg plus clindamycin 900 mg).1 Individual free (unbound) plasma concentration profiles were generated for each AP regimen in the 5000 simulated subjects. AP was delivered as single intravenous doses administered 1 h pre-incision and infused over 15 min or 60 min for levofloxacin and 30 min for clindamycin. One-compartment PK models with parameters relevant to the study population were used and, if available, studies in patients undergoing surgery with sufficient data to identify covariate relationships (e.g. body weight and volume of distribution, CLCR and drug clearance) were selected. Otherwise, Gaussian distributions of PK parameters consistent with the study population were modelled. Cefazolin PK were adapted from studies in aortic aneurysm repair7 and general surgery,8 whereas cefoxitin and ceftriaxone data were from patients undergoing colorectal9 and thoracic operations,10 respectively. Ertapenem PK were adapted from studies in healthy volunteers,11 gentamicin from our studies in colorectal surgery6,12 and levofloxacin from patients undergoing prostatectomy.13 Metronidazole PK were adapted from studies in healthy volunteers14 and colorectal surgery,15 whereas clindamycin data were from patients being treated for osteomyelitis.16
SSI pathogen and MIC distributions
Relevant pathogen and MIC distributions in SSIs were constructed using data from national surveillance studies. First, the distribution of aerobic pathogens was adapted from SSI isolates (n = 5617) associated with abdominal surgery reported to the National Healthcare Safety Network of the CDC in 2009 and 2010.17 These data were adjusted with the removal of rare (i.e. <1%), fungal and unidentified isolates along with Staphylococcus epidermidis and Enterococci spp. due to their uncertain pathogenic role in wound infections. MIC distributions were based on surgical pathogens (n = 536) collected from Canadian hospitals from 2007 to 2012, inclusive.18,19 Anaerobic pathogen and MIC distributions were based on clinical isolates of the Bacteroides fragilis group (n = 387) collected from Canadian hospitals in 2010 and 2011.20 All MICs were determined using broth microdilution methods described by the CLSI.21,22
PK-PD analysis
The predicted probability of target attainment (PTA) for each antimicrobial and MIC value was calculated as the proportion (or percentage) of 5000 simulated subjects with free plasma concentrations above that MIC at 1, 2, 3, 4, 5 and 6 h after the pre-operative dose. For comparison, PTA values at the recommended re-dosing time of 4 h for cefazolin and 2 h for cefoxitin were noted. PTA at 4 h was used as the reference for other antimicrobials where re-dosing is recommended during unusually long operations. The overall or cumulative target attainment (CTA) was determined for each antimicrobial by integrating PTA values across the potential SSI pathogen and MIC distributions. Therefore, CTA was calculated by multiplying each PTA by the fraction of isolates with that MIC, and summing the values. Separate CTA values were determined for AP regimens against potential aerobic and anaerobic SSI pathogens.
CTA analysis for potential SSI pathogens was also used to evaluate the guideline-recommended dosing for cefazolin and gentamicin prophylaxis. For cefazolin, the recommended 2 g dose in simulated subjects from 80 kg to 120 kg and 1 g or 2 g dose in those from 60 kg to 79 kg were tested. In simulated subjects above 100 kg, the PK model for volume of distribution was adjusted for obesity using a dosing weight of: ideal body weight + 0.3 × (actual body weight − ideal body weight), where ideal body weight was 70 kg. For gentamicin, the suggested 5 mg/kg dose was evaluated and compared with lower doses down to the traditional 1.5 mg/kg.
Results
Antimicrobial PK data generated by MCS are summarized in Table 1. The aerobic pathogen distribution in SSIs associated with abdominal surgery was 34.8% Escherichia coli, 21.6% Staphylococcus aureus (16.7% MSSA, 4.9% MRSA), 10.5% Pseudomonas aeruginosa, 10.1% Klebsiella spp., 10.1% Streptococcus spp., 8.4% Enterobacter spp. and 4.5% Proteus spp. The distribution of anaerobes was 59.9% B. fragilis and 40.1% other Bacteroides spp. Although full MIC distributions were used in the simulations, MIC50 and MIC90 values of each antimicrobial and SSI pathogen are provided for reference in Table 2.
Antimicrobial PK parameters in simulated subjects
| V (L) | t1/2 (h) | Free (unbound) fraction | |
|---|---|---|---|
| Cefazolin | 11.2 ± 2.3 | 2.0 ± 0.3 | 0.200 ± 0.030 |
| Cefoxitin | 13.6 ± 2.8 | 0.8 ± 0.1 | 0.300 ± 0.045 |
| Ceftriaxone | 12.8 ± 2.6 | 8.0 ± 1.1 | 0.075 ± 0.011 |
| Ertapenem | 9.0 ± 1.8 | 3.8 ± 0.5 | 0.050 ± 0.008 |
| Gentamicin | 17.3 ± 3.5 | 1.9 ± 0.3 | 0.900 ± 0.135 |
| Levofloxacin | 90.1 ± 18.2 | 7.0 ± 0.9 | 0.700 ± 0.105 |
| Metronidazole | 41.1 ± 9.0 | 8.0 ± 1.1 | 0.900 ± 0.135 |
| Clindamycin | 69.9 ± 13.9 | 3.0 ± 0.4 | 0.076 ± 0.011 |
Data are presented as mean ± SD.
Antimicrobial MIC50 (mg/L) and MIC90 (mg/L) for potential SSI pathogens
| E. coli | MSSA | MRSA | P. aeruginosa | Klebsiella spp. | Streptococcus spp. | Enterobacter spp. | Proteus spp. | B. fragilis group | |
|---|---|---|---|---|---|---|---|---|---|
| Cefazolin | 2, 8 | ≤0.5, 1 | >64, >64 | >64, >64 | 2, >64 | 0.5, 1 | >64, >64 | 4, 8 | NA |
| Cefoxitin | 4, 16 | 4, 4 | ≥32, ≥32 | ≥32, ≥32 | 4, 16 | 0.5, 1 | ≥32, ≥32 | 4, 4 | 16, 64 |
| Ceftriaxone | ≤1, ≤1 | 4, 4 | >64, >64 | 16, >64 | ≤1, 8 | ≤0.12, ≤0.12 | ≤1, 16 | ≤1, ≤1 | NA |
| Ertapenem | ≤0.06, ≤0.06 | 0.25, 0.5 | 16, ≥32 | 8, ≥32 | ≤0.06, ≤0.06 | ≤0.06, ≤0.06 | ≤0.06, 0.25 | ≤0.06, 0.12 | 0.5, 2 |
| Gentamicin | ≤0.5, 2 | ≤0.5, 1 | ≤0.5, 1 | 4, 8 | ≤0.5, ≤0.5 | ≥32, ≥32 | ≤0.5, ≤0.5 | 1, 2 | NA |
| Levofloxacin | ≤0.06, ≥32 | 0.25, 1 | 8, ≥32 | 1, ≥32 | ≤0.06, 0.5 | 0.5, 1 | 0.06, 0.25 | 0.12, 0.5 | NA |
| Metronidazole | NA | NA | NA | NA | NA | NA | NA | NA | 1, 4 |
| Clindamycin | NA | ≤0.25, ≤0.25 | 0.5, ≥8 | NA | NA | ≤0.12, ≤0.12 | NA | NA | 2, >16 |
NA, not applicable.
CTA over 6 h for the recommended AP regimens against potential SSI pathogens is depicted in Figure 2(a and b). For comparison, CTA values 4 h after the pre-operative dose (2 h for cefoxitin) are reported in Table 3. Cefazolin plus metronidazole covered SSI aerobes in 70% and the B. fragilis group in 99% of simulated subjects, whereas cefoxitin covered aerobes and anaerobes in 63% and 27% of cases, respectively. The broad-spectrum regimen of ceftriaxone plus metronidazole covered aerobes in 82% and anaerobes in 99% of simulations, while ertapenem covered aerobes in 88% and anaerobes in 90% of cases. The non-β-lactam alternatives provided variable aerobic coverage ranging from 79% with levofloxacin plus either metronidazole or clindamycin to 91% with gentamicin plus clindamycin. The B. fragilis group was covered in 99% of cases with metronidazole, but only 11% with clindamycin.
CTA or percentage of simulated subjects with free antimicrobial plasma concentrations above the MICs for potential SSI pathogens (4 h after the pre-operative dose for all antimicrobials except 2 h for cefoxitin)
| AP | Aerobic SSI pathogensa | Anaerobic SSI pathogensb |
|---|---|---|
| Recommended | ||
| cefazolin 2 g plus metronidazole 500 mg | 70% | 99% |
| cefoxitin 2 g | 63% | 27% |
| Broad-spectrum alternatives | ||
| ceftriaxone 2 g plus metronidazole 500 mg | 82% | 99% |
| ertapenem 1 g | 88% | 90% |
| Non-β-lactam alternatives | ||
| gentamicin 5 mg/kg plus metronidazole 500 mg | 82% | 99% |
| gentamicin 5 mg/kg plus clindamycin 900 mg | 91% | 11% |
| levofloxacin 500 mg plus metronidazole 500 mg | 79% | 99% |
| levofloxacin 500 mg plus clindamycin 900 mg | 79% | 11% |
a34.8% E. coli, 21.6% S. aureus, 10.5% P. aeruginosa, 10.1% Klebsiella spp., 10.1% Streptococcus spp., 8.4% Enterobacter spp. and 4.5% Proteus spp.
b59.9% B. fragilis and 40.1% other Bacteroides spp.
CTA for AP regimens against potential (a) aerobic pathogens (triangles, cefazolin 2 g; squares, cefoxitin 2 g; circles, ceftriaxone 2 g; diamonds, ertapenem 1 g; plus symbols, gentamicin 5 mg/kg; crosses, levofloxacin 500 mg) and (b) anaerobic pathogens (squares, cefoxitin 2 g; diamonds, ertapenem 1 g; plus symbols, metronidazole 500 mg; crosses, clindamycin 900 mg).
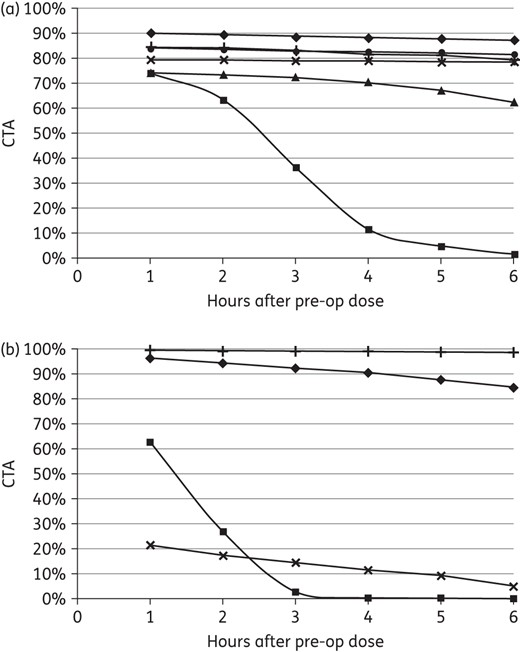
CTA profiles for cefazolin prophylaxis with the recommended 2 g in the study population are shown in Figure 3(a). AP with 2 g of cefazolin maintained target attainment in simulated subjects from 80 kg to 120 kg including those in the upper range (Figure 3b). Although 1 g doses sustained S. aureus coverage in those <80 kg, there was lower target attainment against potential Gram-negative pathogens. Compared with 2 g, the absolute CTA with 1 g doses in simulated subjects from 70 kg to 79 kg was 12% lower at 4 h with a more rapid decline thereafter against E. coli and other Enterobacteriaceae (Figure 3c). Similar results were observed in those from 60 kg to 69 kg.
CTA for cefazolin prophylaxis against potential aerobic pathogens with (a) 2 g in the study population (i.e. 75.0 ± 11.3 kg, 90.0 ± 9.0 mL/min/72 kg), (b) 2 g in simulated subjects with a uniform weight distribution from 101 kg to 120 kg and (c) 1 g in simulated subjects with a uniform weight distribution from 70 kg to 79 kg (squares, S. aureus; triangles, E. coli; circles, other Enterobacteriaceae; broken line, all aerobic pathogens).
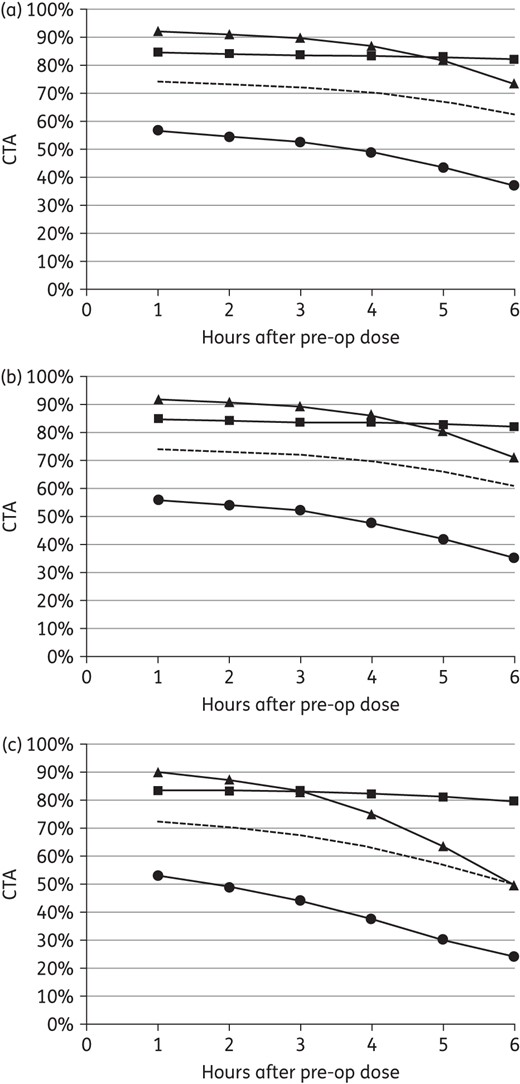
CTA results for gentamicin prophylaxis with the suggested 5 mg/kg in the study population are depicted in Figure 4(a). AP with 3 mg/kg gentamicin was comparable to 5 mg/kg over 6 h (Figure 4b), whereas the traditional 1.5 mg/kg dose was associated with lower target attainment particularly beyond 4 h (Figure 4c). Compared with 5 mg/kg, the absolute CTA with 1.5 mg/kg doses was 10% lower at 5 h and 18% lower at 6 h against all potential aerobic SSI pathogens. At 6 h, target attainment was 13% lower against S. aureus, 23% lower against E. coli and 33% lower against other Enterobacteriaceae.
CTA for gentamicin prophylaxis against potential aerobic pathogens with (a) 5 mg/kg, (b) 3 mg/kg and (c) 1.5 mg/kg in the study population (i.e. 75.0 ± 11.3 kg, 90.0 ± 9.0 mL/min/72 kg) (squares, S. aureus; triangles, E. coli; circles, other Enterobacteriaceae; broken line, all aerobic pathogens).
Discussion
While antimicrobial PK-PD principles in the treatment of infections are relatively well established,23–25 research into the prevention of infections is limited. Antimicrobial PD studies using MCS integrate multiple variables with complex relationships involving patient characteristics, antimicrobial PK and pathogen susceptibilities. In that context, ‘what-if’ scenarios with relevant probability distributions can be objectively compared based on outcomes such as the probability of achieving desired PD targets. For the treatment of infections, this can involve comparing antimicrobials, designing dosing regimens, determining susceptibility breakpoints and studying different patient populations (e.g. dialysis, critically ill). Opportunities in AP include testing different antimicrobials, dosing and timing of administration while accounting for patient (e.g. body weight, renal function), microbiological (e.g. pathogen and MIC distributions) and surgical (e.g. duration) factors. The robust and translational aspects of MCS-based research can probe important issues related to optimal antimicrobial use that otherwise would not or could not be studied.
We used a PD target of maintaining free antimicrobial plasma concentrations above the MICs for potential SSI pathogens during surgery. The target was based on PK-PD principles along with research, including our own, that supports the importance of antimicrobial closure concentration for effective AP. In a previous, randomized, controlled study of gentamicin (plus metronidazole) prophylaxis in colorectal surgery, we compared a single pre-operative dose of 4.5 mg/kg with a pre-operative dose of 1.5 mg/kg followed by two post-operative doses of 1.5 mg/kg.6 A finding of more SSIs in the multiple-dose arm, particularly when operations exceeded 3 h, led to a follow-up PK-PD study that characterized the relationship between gentamicin closure concentration and probability of infection.12 Given its concentration-dependent activity, gentamicin peak concentration or AUC relative to the MIC (i.e. peak/MIC, AUC/MIC) are associated with clinical outcome in the treatment of infection. For AP in surgery, however, our data showed that gentamicin concentration at the end of surgery (i.e. closure concentration) was most important in preventing SSIs. As such, a target of maintaining concentrations above the MICs for potential SSI pathogens was used in the current study for both time-dependent (i.e. cefazolin, cefoxitin, ceftriaxone, ertapenem, clindamycin) and concentration-dependent (i.e. gentamicin, levofloxacin, metronidazole) antimicrobials.
We simulated 5000 study subjects and constructed PK models that represented patients undergoing elective abdominal surgery. PK parameter distributions were based on data from relevant studies and adapted to our study population, which is particularly important when comparing antimicrobials. Only free plasma concentrations were considered since protein-bound antimicrobial is inactive and does not distribute into tissue (i.e. extracellular fluid). Hence, the free fraction is also most indicative of antimicrobial concentrations in tissue at the surgical site. We used robust microbiological models that characterized the entire distribution of relevant pathogens and antimicrobial susceptibilities. Hence, target attainment in the current study was an all-inclusive representation of AP regimens against potential SSI pathogens including those with innate or acquired antimicrobial resistance. As such, the maximal CTA for AP regimens without MRSA and P. aeruginosa coverage was 85%.
Cefoxitin provided relatively poor AP due to its short half-life and relatively high MICs, particularly against the B. fragilis group.20,26,27 In our MIC model, 18.9% of anaerobes were intermediate (MIC = 32 mg/L) and 15.2% were resistant (MIC ≥64 mg/L) to cefoxitin. Our findings were consistent with another PK-PD study of AP in elective colorectal surgery conducted by Moine and Fish.28 Several AP regimens were simulated using published PK data and tested against E. coli, S. aureus and B. fragilis using EUCAST MIC distributions.28 Given its very poor target attainment, the authors concluded that cefoxitin prophylaxis for colorectal surgery was debatable. Based on its poor performance despite frequent re-dosing and available alternatives, we suggest that cefoxitin prophylaxis be avoided particularly in patients with normal renal function.
Clindamycin prophylaxis even with doses of 900 mg also provided inadequate anaerobic coverage. Again this finding was consistent with significant and increasing resistance reported in Canada, Europe and the USA.20,26,27 In our MIC model, 13.7% of anaerobes were intermediate (MIC = 4 mg/L) and 34.1% were resistant (MIC ≥8 mg/L) to clindamycin. Such lapses in activity are clinically relevant given the importance of both aerobic and anaerobic AP coverage in preventing SSIs following colorectal surgery.29
Compared with cefazolin plus metronidazole, the broad-spectrum alternatives including ceftriaxone plus metronidazole and ertapenem increased CTA against potential aerobic pathogens by 12% and 18%, respectively. Most benefit was observed against E. coli where CTA increased from 87% to 97%–100% and against other Enterobacteriaceae where CTA rose from 49% to 90%–100%. An additional analysis focused on the most common pathogens with equal distributions of E. coli, S. aureus and the B. fragilis group showed that broad-spectrum AP with ceftriaxone plus metronidazole (91% CTA) or ertapenem (91% CTA) was similar to cefazolin plus metronidazole (90% CTA). Broad-spectrum AP may be considered when coverage is required for more resistant pathogens. The decision, however, should weigh the potential benefits based on local SSI pathogens versus the risks of selecting more resistant organisms, promoting collateral resistance and increasing Clostridium difficile infection. As demonstrated above, PD studies using MCS can inform such decisions by quantifying the benefits of broader spectrum AP based on probability distributions that represent the actual patient population, pathogen distributions and susceptibility profiles.
Finally, the recommended 2 g of cefazolin provided comparable coverage for simulated subjects from 60 to 120 kg (Figure 3). The lapses in cefazolin activity were not overcome with higher doses of 4 g (data not shown). In addition, cefazolin prophylaxis was not improved with earlier re-dosing at 3 h versus 4 h (Figure 2a and b). Interestingly, cefoxitin required re-dosing every hour to maintain target attainment against aerobes, but even then did not adequately cover anaerobic SSI pathogens (Figure 2b). The current study of gentamicin prophylaxis provided further evidence that the traditional 1.5 mg/kg dose may be suboptimal (Figure 4c). Without intra-operative re-dosing for gentamicin, AP coverage for 6 h (including 1 h prior to incision) may be a reasonable goal and is supported by our recent audit of colorectal operations (n = 35) that were 3.3 ± 1.6 h with 90% of cases <5.0 h. The current study predicted significant reductions in target attainment with 1.5 mg/kg in surgery exceeding 3 h, consistent with our previous clinical study.6 It also showed that 3 mg/kg was comparable over 6 h to the suggested 5 mg/kg dose (Figure 4a and b). Given these results along with concerns related to aminoglycoside-associated toxicity,30 we propose that 3 mg/kg gentamicin would achieve the PD benefits of 5 mg/kg with significantly less systemic exposure.
Limitations of the current study include those inherent in conducting and interpreting MCS-based research. Our results apply to patients consistent with the study population, in particular those with normal renal function. Hence, our predictions of target attainment are conservative and would be lower than in patients with reduced drug clearance due to renal dysfunction. Although PK models were selected to best represent the study population undergoing surgery, ertapenem data were adapted from studies in normal volunteers and clindamycin data were from patients being treated for osteomyelitis. In addition, our model for metronidazole did not account for the active hydroxyl metabolite. However, the effects of the latter would have been negligible given that metronidazole alone maintained target attainment against anaerobes over 6 h in 99% of cases. Finally, our CTA values are based on the MIC distribution for surgical pathogens in Canadian hospitals. As such, our findings should be interpreted and extrapolated with attention to different or changing susceptibility profiles.
In conclusion, this study demonstrates the use of PK-PD to inform decisions regarding AP in abdominal surgery. In this case, the findings support avoiding cefoxitin, avoiding clindamycin for anaerobic coverage, selecting 2 g instead of 1 g of cefazolin for patients between 60 and 80 kg and using 3 mg/kg instead of 5 mg/kg gentamicin.
Funding
This work was supported by the Leslie F. Buggey Professorship (S. A. Z.), non-specific research funds (S. A. Z.) and a University of Manitoba Graduate Fellowship (D. C.).
Transparency declarations
None to declare.
Acknowledgements
These data were presented, in part, at the Twenty-fifth European Congress of Clinical Microbiology and Infectious Diseases, Copenhagen, Denmark, 2015 (Poster no. 1387).
