


Abstract
Antimicrobial susceptibility testing with phenotypic methods is based on the measurement of the MIC (mg/L) and breakpoints to categorize bacteria and fungi as susceptible, intermediate or resistant. Phenotypic antimicrobial susceptibility testing requires an agreement on breakpoints and a rigorous standardization of methods and materials. Requirements for defining breakpoints include a definition of doses and dose intervals, information on MIC distributions for the target organisms, definitions of the highest MIC for organisms devoid of phenotypically expressed resistance (the epidemiological cut-off) and information on resistance mechanisms, pharmacokinetics, pharmacodynamics and clinical outcome in trials. In 2001, the breakpoint committees of France, Germany, Norway, Sweden, the Netherlands and the UK were tasked with developing European breakpoints under the umbrella of EUCAST, organized by ESCMID and later also by ECDC. Breakpoints for previously established antibacterial and antifungal agents in Europe have now been harmonized. With the EMA, EUCAST has since 2006 determined breakpoints for new agents. All breakpoints are freely available on the EUCAST web site; these are used in semi-automated antimicrobial susceptibility testing devices and have been employed since 2010 in a EUCAST disc diffusion method. They have been or are now being implemented in most countries inside Europe and many countries outside it. Everything needed to perform and interpret antimicrobial susceptibility testing is freely available from the EUCAST web site, as are aggregated MIC distributions based on more than 26 000 distributions.
Introduction
Antimicrobial susceptibility testing (AST) of bacteria and fungi is primarily performed (i) to predict the outcome of antimicrobial therapy in individual patients and (ii) to collect local data on susceptibility and resistance in order to create a basis for empirical therapy. An increasing number of organisms carry especially unwanted resistance mechanisms, and in many instances AST is primarily performed (iii) to detect these so that infection control and/or public health measures can be taken. Since it became clear that, due to the accelerating development of resistance, the world is headed toward a ‘post-antibiotic era’, the interest increased (iv) to measure the dynamics of the development of resistance and the potential effect of countermeasures to slow, stay or reverse the catastrophe.
Determining the susceptibility of microorganisms
Antimicrobial resistance in microorganisms can be detected using phenotypic and/or genotypic methods. Phenotypic methods, based on the MIC of an antimicrobial agent for the organism, will predict different degrees of susceptibility. Genotypic methods have, however, so far predicted only the presence of resistance genes, and unless the phenotypic expression of the genes can be determined, this may be of doubtful practical impact. Susceptibility can be quantified using phenotypic methods, and isolates and species can be compared with each other. This is a feature of the MIC that is becoming more important as acquired resistance becomes increasingly overwhelming. To date, it has not been possible to quantify resistance with genotypic methods or to compare the degree of susceptibility between isolates or between species.
Phenotypic susceptibility testing is based on the MIC value and on the availability of a clinical breakpoint. A clinical breakpoint is an MIC value that distinguishes between organisms where therapy is likely to succeed and fail. The determination of a clinical breakpoint needs the input of data from many sources: clinical trials data, MIC distributions for relevant organisms, knowledge about resistance mechanisms and information on pharmacokinetics and pharmacodynamics based on relevant dosing, dosing intervals and measurements performed in target populations.
When the MIC (or a surrogate test value obtained through a disc diffusion test, a gradient test or an automated device) is known, the breakpoint is defined to predict the clinical outcome of therapy for the species in question. It is often designed not to overcall susceptibility, which is why clinicians are sometimes disappointed by the fact that patients do well in spite of carrying organisms that have been reported as being resistant. Breakpoints can be a single concentration, expressed as susceptible (S) ≤X mg/L or resistant (R) >X mg/L, or two concentrations, S ≤X mg/L/R >Y mg/L, the latter leaving a concentration range between S and R for an ‘intermediate’ (I) category. The prediction can be strong, such as for high levels of ESBL and a cefotaxime MIC >8 mg/L in Enterobacteriaceae or vancomycin resistance in enterococci. Conversely, the prediction may be weak, as for penicillin non-susceptibility in Streptococcus pneumoniae, where the dosing and the clinical condition will determine the outcome. Medicines agencies such as the EMA (London, UK) and the FDA (USA) determine breakpoints as part of the registration process for new antimicrobial agents. In several countries, a need for technical AST support led to the creation of national committees. The competence gathered by the profession in these committees was such that the committees began to have opinions on breakpoints, and before too long the national breakpoint committees took over the role of setting breakpoints. There was a multitude of individual initiatives, which several colleagues came forth to lead. Among the founding fathers of susceptibility testing were Ericsson and Sherris1 and Bauer et al.2
Creation of EUCAST
The existence of these many initiatives created a problem. Systems were created in France, Germany, the Netherlands, Sweden, the UK, the USA and Norway, all developing in slightly different directions and recommending different methods and different breakpoints. Systems were put forward by the following: The different breakpoints were not primarily the result of a disagreement between the committees. Instead, the committees were not synchronized, did not communicate with each other and did not see a need for harmonization.
BSAC (UK).
CA-SFM (Comité de l'ántibiogramme de la Société Française de Microbiologie, France).
CLSI (formerly NCCLS) (USA).
CRG (Commissie Richtlijnen Gevoeligheidsbepalingen, the Netherlands).
DIN (Deutsches Institut für Normung, Germany).
NWGA (Norwegian Working Group on Antibiotics, Norway).
SRGA and SRGA-M (Swedish Reference Group of Antibiotics and its subcommittee on methodology, Sweden).
In 1997, ESCMID formed EUCAST under the leadership of the former ESCMID president and former chairman of the BSAC working party on AST, Ian Phillips (London, UK). The idea was to create a committee along similar lines to the CLSI and, through the formation of a number of working groups, to start setting breakpoints and developing methodology, Standard Operation Procedures (SOPs), etc. There was no move to engage the six national committees (listed above) so these continued doing what they had done well for 20–30 years: developing breakpoints for new agents and methods for the determination of susceptibility. Hence, there was no harmonization of breakpoints and no standardization of methods.
In 2001, Ian Phillips stepped down and I was given the task of evaluating whether there was an alternative model that might work. From the original EUCAST, Derek Brown (Clinical Microbiology, Addenbrooke's Hospital, Cambridge, UK) was persuaded to stay on as the scientific secretary, a role he had undertaken since 1997. The two of us got down to work and quickly found that, despite our rather opposite personalities, we worked well together. We realized that the key to success depended on convincing the six national breakpoint committees to come together and take joint responsibility for the task at hand. Only then could we hope for a harmonization of European breakpoints. I travelled to take part in their committee meetings and to propose to them that they should continue to work as national committees but come together under the umbrella of EUCAST. The idea, which was accepted, was to invite one member from each of the national committees to form a EUCAST Steering Committee (SC) and to have ESCMID appoint a chairperson and a scientific secretary.3
EUCAST SC
Under the leadership and coordination of the EUCAST chairperson and scientific secretary, and with the abundance of the expertise lodged in the national committees, we set to work. The expectation was that ideas and decisions would be taken to the national committees for advice and that once the national committees and the EUCAST SC were in agreement and the General Committee (GC) members had been consulted, a final decision would be taken by the SC. Any decision made through this consensus process would then be implemented in all six national systems. We set up a mechanism by which a country could formally ask for an exception. This was to defuse situations where pronounced differences in therapeutic traditions or in dosing called for different breakpoints. It was deemed very important, but as things developed it was only rarely used. As both EUCAST SC members and national committee members could see that the decision process worked and that national committees had not lost their role, confidence built up and committee members started looking forward to the next SC meeting (five each year). The SC consisted of the chairperson and scientific secretary (a clinical data coordinator later being added), one representative of each of the national breakpoint committees and two or three representatives of the GC. The ESCMID executive committee is responsible for appointing the chairperson, scientific secretary and clinical data coordinator. The national committees decide who they want to represent them on the SC. GC members apply to ESCMID for a 2 year position on the SC, and to date more than 15 countries have been represented. A tradition has developed for the EMA and ECDC to appoint observers to individual SC meetings, which are normally held in major European cities.
EUCAST GC and national AST committees (NACs)
Early on, we realized the importance of involving all European countries, and a GC was formed with one representative from each country.4 The GC meets once yearly in conjunction with the European Congress for Clinical Microbiology and Infectious Diseases (ECCMID). The members of the GC are primarily appointed by national societies for clinical microbiology or infectious diseases. Between meetings, the GC members participate in the consultation process that has been developed. This has a dual purpose. First, EUCAST obtains opinions and suggestions prior to deciding on breakpoints, methods, strategies and so on. Second, the country representatives are kept informed of progress and at a later stage take responsibility for implementing EUCAST standards and recommendations on a national level.
Over the last 5 years, EUCAST has encouraged countries to form NACs.5 The NACs are meant to deal with forming a coherent AST strategy at a national level, to help with implementation of breakpoints, methods and quality assessment and to take responsibility for education (national workshops, web sites) and the translation6 of EUCAST documents. We recommend that the NACs are the natural bodies for liaison and consultation with EUCAST, and we expect the national GC representative to be among the driving forces in the NAC. Many countries have formed an NAC, including most European countries (Figure 1), Australia, Brazil, Iceland, Israel, Morocco, South Africa and the USA. Several other countries have informed us that they are in the process of forming one.
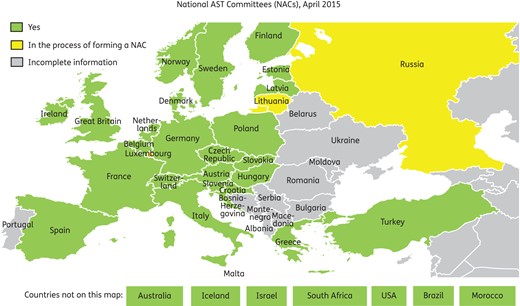
NACs in Europe and elsewhere 2015. Several of the countries with incomplete information are now part of the CAESAR project (jointly between WHO Europe, the Netherlands and ESCMID), which is preparing to adapt EUCAST methodology and breakpoints.
EUCAST subcommittees
There are areas where the SC is in need of particular expertise. Several subcommittees have been created, some organized as standing committees and others with specific remits and timelines.
The EUCAST Antifungal Susceptibility Testing7 (AFST) subcommittee, formed in 2002, was initially chaired by Juan-Luis Rodriguez-Tudela and, with Peter Donnelly as the scientific secretary, rapidly created a framework for setting breakpoints for both existing and new antifungal agents for both Candida and Aspergillus species. Methods of MIC determination were developed for both genera. The leadership was taken over by Maiken Cavling Arendrup, and the subcommittee faced new challenges when several new azoles required breakpoints.
The subcommittee on the AST of anaerobic bacteria was asked to address which antimicrobials should have breakpoints for anaerobic Gram-positive and Gram-negative bacteria, to determine whether all anaerobes should have the same breakpoints or should be speciated and to start addressing the difficult methodological questions in the susceptibility testing of anaerobes.
Over the years, more subcommittees were created, the two most recent being on the role of WGS in the susceptibility testing of bacteria and on the susceptibility testing of veterinary pathogens.8
A subcommittee to prepare a EUCAST document on how to define and deal with intrinsic resistance and expert rules in AST was formed under the leadership of Roland Leclerc (Paris, France) and Rafael Canton (Madrid, Spain). This has created much discussion on how intrinsic resistance should be defined and on the significance of some of the rules.9
During the last 10 years, a discussion on the relevance of detecting and reporting certain resistance mechanisms developed in both EUCAST and the CLSI. Should breakpoints and the susceptibility categorization they provide not suffice? Is it reasonable to develop caveats for the use of breakpoints rather than discuss lowering the breakpoint to ensure that resistance mechanisms of importance impact on the susceptibility categorization?10 The long tradition of excluding the presence of an ESBL before applying third-generation cephalosporin breakpoints came under fire, and most recognized that the tradition had developed because it was believed that other β-lactam resistance mechanisms could be overcome and would tolerate higher breakpoints. As the discussion developed in all the national committees and EUCAST, it was eventually decided that breakpoints must be set to be valid without first excluding one or several resistance mechanisms. The decision was implemented in EUCAST and CLSI as a rule for extended β-lactamases (in its broadest sense) in Enterobacteriaceae and as a general rule in EUCAST breakpoint setting. This prompted EUCAST to develop a ‘guideline for the detection of resistance mechanisms and specific resistances of clinical or epidemiological importance or both’. A subcommittee under the leadership of Christian Giske (Stockholm, Sweden) was created for this purpose, and the guideline was published in 2013.11
The field of WGS is developing fast. The cost has decreased, bioinformatics tools are developing quickly, and the identification of known and new resistance genes is no longer as cumbersome and expensive as it was only a few years ago. It is now possible to tackle the relationship between phenotype and genotype, and guidance on how WGS may impact on routine AST is needed. In 2015, a subcommittee is being created to tackle some of these issues.
Financing of EUCAST
ESCMID has taken full responsibility for EUCAST and has financed EUCAST since its beginning.
The basic development and upkeep of the EUCAST disc diffusion method is financed by ESCMID, which has also provided platforms for the education of laboratory staff and clinical colleagues in AST. For more than 10 years, EUCAST has run educational workshops on AST in conjunction with ECCMID, with audiences of up to 800 colleagues from around the world. ESCMID postgraduate courses have been well attended, twice in Madrid, Spain, and recently in Linz, Austria. Without ESCMID, there would not have been a European harmonization of breakpoints and AST methods.
However, for much of the lifespan of EUCAST, there has been a significant financial contribution by the European Union to the committee work of EUCAST, either through DG Sanco of the European Union or as a result of calls for tender from the ECDC.
Relationship between EUCAST and industry
Industry has no formal position on EUCAST, and there is no seat for industry on either the SC or the GC. However, industry is frequently consulted on technical issues and EUCAST consults with industry, both the pharmaceutical industry and manufacturers of AST devices and materials, as part of the open public consultations, which are an integrated part of the EUCAST decision process. Questions from industry are treated with the same respect as questions from NACs, agencies and colleagues.
Information for industry is an important part of the EUCAST web site.12 It describes the procedures through which companies can bring a new agent to EUCAST to obtain technical advice and eventually clinical breakpoints as part of the EMA process for the registration of new compounds. The latter is also regulated through the SOP agreed between the EMA, the pharmaceutical industry and EUCAST (see below).
At no stage is industry allowed to contribute financially to any of the activities offered by EUCAST.
Harmonization of breakpoints for existing agents and the setting of breakpoints for new agents
Through the decision process described above, the SC made plans to harmonize the breakpoints for existing antimicrobial agents. A set of procedures was defined. SOPs for how to achieve agreement without it being a mere compromise were created.13 A decision was taken to document all the variables and arguments that went into each breakpoint and to publish these on the EUCAST web site as ‘Rationale Documents’. To date, there have been 40 rationale documents on antibacterial agents14 and 11 on antifungal agents.15
The EMA together with industry and EUCAST agreed in 2005 on a SOP through which industry and EMA could use EUCAST expertise in setting breakpoints.16 The SOP was revised in 2007 and reviewed without changes in 2009. In January 2006, daptomycin was the first agent to be approved by the EMA with clinical breakpoints determined by EUCAST. Since then, EUCAST has determined breakpoints for the following new agents: tigecycline, doripenem, ceftaroline and the antimycobacterial agents bedaquiline and delamanid; oritavancin, dalbavancin and tedizolid; and several antifungal agents, including posaconazole and voriconazole for Candida and Aspergillus and micafungin for Candida. This has been part of the official process for the approval of new antibacterial and antifungal agents.
Pharmacokinetics/pharmacodynamics in the setting of breakpoints
The use of pharmacokinetics, pharmacodynamics and the Monte Carlo mathematical simulation of large-population statistics gradually gained acceptance over the period 2000–10. EUCAST rationale documents were given sections on pharmacokinetics and pharmacodynamics and Monte Carlo simulations and, under the leadership of Johan Mouton (Rotterdam, the Netherlands), EUCAST published an article describing the methodology employed to allow pharmacokinetics/pharmacodynamics to impact on the process of both harmonizing breakpoints for previously available agents and setting breakpoints for new agents.17 For agents for which data would allow the calculation of a pharmacokinetic/pharmacodynamic breakpoint, this was included in the rationale document and in the EUCAST breakpoint tables.
MIC WT distributions, epidemiological cut-offs (ECOFFs) and their use
In 2002, EUCAST launched the concept of gathering large numbers of MIC values to present on a web site as aggregated reference MIC distributions for each species–agent combination. Only MIC distributions that adhered to a set of basic conditions were accepted for aggregation with other distributions. The conditions of acceptance were: (i) that each contribution of MIC values must consist of a minimum number of isolates; (ii) that the species was defined; (iii) that MIC determinations were performed using standardized methodology (or a method calibrated to a standardized method); and (iv) that the concentrations tested were not truncated at the lower end of the concentration series. It was evident that MIC values from commercial semi-automated machines were not acceptable, since truncation of the data was the rule rather than an exception. On the other hand, controlled gradient test data were rarely truncated and were accepted when in line with broth microdilution data. Each contribution was scrutinized and accepted or rejected. Contributors were not informed about the fate of their data, and no data were discarded, although some data were just not presented. There are currently more than 26 000 MIC distributions in the EUCAST database, which amounts to several million MIC values. The distributions come from breakpoint committees, individual researchers in human and veterinary medicine, programmes for the surveillance of antimicrobial resistance in humans and animals, EUCAST development projects, pharmaceutical companies as part of programmes for the development of new agents, and more.
A typical aggregated MIC distribution for Escherichia coli and cefotaxime is shown in Figure 2. Of the total of 72 distributions (Table 1) that were submitted, 41 fulfilled the criteria for acceptance and were aggregated and displayed on the EUCAST web site.18 Distributions that were not accepted were either truncated at the lower end or consisted of only a few isolates, making it impossible to judge the quality of the distribution. As seen from the figures with (Figure 2a) and without (Figure 2b) the unacceptable distributions, the truncated datasets push the distribution upwards, resulting in an erroneous MIC distribution and an erroneous ECOFF (as explained below). This shows the importance of identifying and excluding these. Suggested rules for accepting distributions for aggregation and for defining ECOFFs are listed in Table 2. However, it is recommended that for species and agents for which distributions are difficult to obtain, tentative aggregations and ECOFFs may be defined from three distributions that agree or from a set of isolates for which MIC determinations have been performed by three independent investigators. EUCAST distributions and ECOFFs may be questioned by anyone who can present evidence to contradict the conclusions drawn by EUCAST.
MIC distributions for E. coli and cefotaxime18
| Investigator | 0.002 | 0.004 | 0.008 | 0.016 | 0.032 | 0.064 | 0.12 | 0.25 | 0.5 | 1 | 2 | 4 | 8 | 16 | … |
|---|---|---|---|---|---|---|---|---|---|---|---|---|---|---|---|
| A | NT | NT | NT | NT | NT | NT | NT | 1671 | 205 | 20 | 6 | 2 | 0 | 0 | |
| B | 0 | 0 | 0 | 0 | 0 | 4 | 10 | 16 | 4 | 0 | 6 | 1 | 2 | 0 | |
| C | 0 | 0 | 3 | 1 | 28 | 51 | 9 | 3 | 3 | 0 | 1 | 1 | 0 | 0 | |
| D | 0 | 4 | 7 | 47 | 310 | 510 | 99 | 12 | 5 | 4 | 1 | 0 | 0 | 0 | |
| E | 0 | 0 | 1 | 20 | 97 | 185 | 116 | 31 | 33 | 6 | 5 | 3 | 7 | 1 | |
| F | 0 | 0 | 0 | 0 | 28 | 88 | 108 | 88 | 13 | 3 | 3 | 0 | 1 | 0 | |
| G | 0 | 1 | 8 | 60 | 105 | 58 | 19 | 5 | 8 | 5 | 0 | 0 | 0 | 0 | |
| H | NT | NT | NT | NT | NT | 135 | 37 | 12 | 5 | 5 | 3 | 8 | 3 | 11 | |
| I | 0 | 0 | 0 | 0 | 0 | 28 | 47 | 1 | 1 | 0 | 0 | 0 | 0 | 0 | |
| K | 0 | 0 | 0 | 0 | 8 | 149 | 113 | 25 | 2 | 0 | 1 | 0 | 0 | 0 | |
| L | 0 | 0 | 0 | 0 | 24 | 181 | 102 | 9 | 0 | 0 | 0 | 2 | 0 | 0 | |
| M | NT | NT | NT | NT | NT | NT | 301 | 12 | 0 | 1 | 1 | 0 | 1 | 0 | |
| N | NT | NT | NT | NT | NT | NT | 150 | 2 | 1 | 1 | 2 | 2 | 2 | 4 | |
| O | NT | NT | NT | NT | NT | NT | 159 | 1 | 0 | 1 | 2 | 0 | 1 | 1 | |
| P | NT | NT | NT | NT | NT | NT | 263 | 8 | 0 | 0 | 6 | 3 | 4 | 3 | |
| Q | 0 | 0 | 0 | 0 | 15 | 188 | 90 | 7 | 2 | 0 | 0 | 0 | 0 | 0 | |
| R, etc. | 0 | 0 | 0 | 1 | 29 | 206 | 73 | 7 | 1 | 0 | 0 | 0 | 0 | 1 | |
| In total 72 |
Of the 72 distributions, only the first 17 are shown. Of the total 72 contributions (Figure 2a), 41 were accepted (Figure 2b) and 31 were not accepted for aggregation (the shaded rows in the table). Common reasons for rejecting distributions were truncation of the lower end of the concentration series (NT) or individual distributions consisting of too few isolates, making it impossible to identify the median of the main Gaussian distribution. Of the 41 accepted contributions, most exhibited a median (marked in bold in the table) concentration of 0.064 with a variation of ±1 concentration in a 2-fold dilution series.
Tentative rules for aggregating MIC distributions from multiple investigators and for defining ECOFFs
| Total no. of MIC distributionsa | No. of MIC distributions not in agreementa | Action (none, aggregate, aggregate and define ECOFF)b |
|---|---|---|
| 1 | — | none |
| 2 | 0 | none |
| 3 | 0 | aggregate 3 |
| 3 | 1 | none |
| 4 | 0 | aggregate 4 + define ECOFF |
| 4 | 1 | aggregate 3 |
| 4 | >1 | none |
| 5 | 0 | aggregate 5 + define ECOFF |
| 5 | 1 | aggregate 4 |
| 5 | >1 | none |
| 6 | 0 | aggregate 6 + define ECOFF |
| 6 | 1 | aggregate 5 + define ECOFF |
| 6 | >1 | none |
| 7 | 0 | aggregate 7 + define ECOFF |
| 7 | 1 | aggregate 6 + define ECOFF |
| 7 | 2 | aggregate 5 + define ECOFF |
| 7 | >2 | none |
| etc. |
aThe number of observations in each distribution should ideally be at least 50 and the median of the Gaussian MIC distributions should agree to within ±1 MIC dilution (see the marked medians in Table 1).
bAlternative actions: none (do not aggregate), aggregate (but do not determine the ECOFF until more distributions are available) and aggregate and define ECOFF.

The database of aggregated MIC values distributions grew rapidly. The part of the MIC distribution that represented organisms devoid of phenotypically detectable resistance mechanisms was Gaussian in terms of the distribution graphs of MIC values and inhibition zone diameters. It was not affected by the location where the isolates had been collected, the specimen source (healthy or sick individuals, humans or animals) or the era of collection (as some of the distributions date from the 1950s and others from just yesterday). There were numerous ways (biological, statistical) to sample the upper end of what was labelled ‘the WT MIC distribution’ to find out where the WT distribution ended. Not surprisingly, there is no absolute end to the WT—a small overlap normally covering one concentration (in a series of 2-fold dilutions) arises from unavoidable variations in methods. However, defining the end of the WT distribution by identifying an ECOFF (the highest concentration of organisms devoid of phenotypically detectable resistance mechanisms) has turned out to be very useful as it has provided a cut-off whereby resistant and susceptible populations could be distinguished in a biological sense.
Several methods can be used to define the ECOFF. The statistical approaches published by Turnidge et al.19 and by Kronvall et al.20 are alternative methods. However, MIC values are most often distributed over a series of concentrations obtained through 2-fold dilutions. Since most WT distributions cover only 3–5 dilution steps (see the examples for ciprofloxacin at http://mic.eucast.org/Eucast2/) and since the MIC is a discontinuous variable, the statistics for defining ECOFFs in MIC distributions are not as straightforward as those developed by Kronvall et al.21 for inhibition zone diameter distributions where the WT normally covers 10–14 data points (1 mm intervals) and where the data represent a more continuous variable with a linear scale. The statistical methods have in common that since a standard deviation has to be agreed on prior to applying the statistical method to the distribution, there is an element of subjectivity to all methods. However, the ECOFF values determined using one or the other of the methods coincide to within one dilution step.19 Furthermore, there are published and ongoing studies that show an excellent correlation between using EUCAST ECOFFs as available on the web site and WGS to distinguish organisms that harbour resistance mechanisms from those that do not, both in Enterobacteriaceae22 and in Staphylococcus aureus (D. M. Aanensen, E. J. Feil, M. T. G. Holden et al., unpublished data).
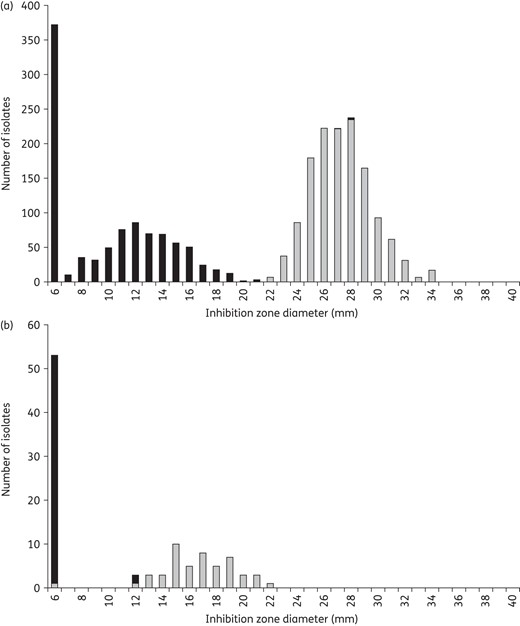
A useful way of defining or validating the MIC ECOFF is to determine the MIC for isolates that are on and ±1 mm from the ECOFF defined using a distribution of inhibition zone diameters. The composite zone diameter/MIC histogram also provides good information on what is a reasonable ECOFF (Figure 3a and b).
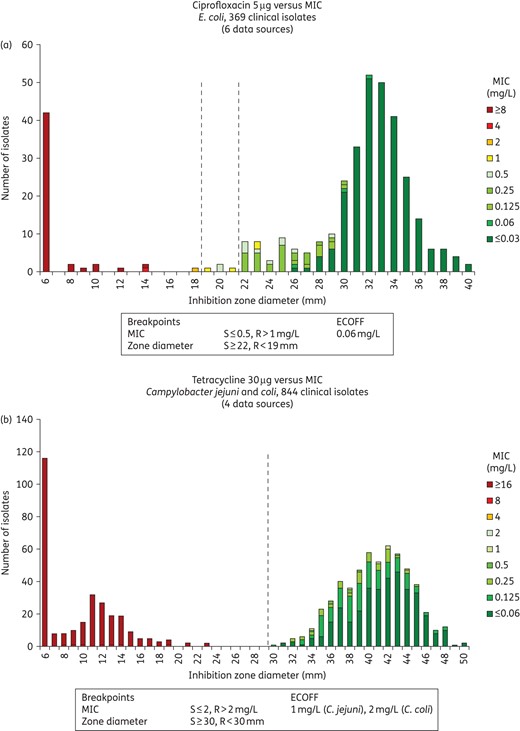
Inhibition zone and MIC distributions for (a) E. coli versus ciprofloxacin (5 μg disc) and (b) C. jejuni and C. coli versus tetracycline (30 μg disc).
The ECOFF is the highest MIC value for the species and agent in question, devoid of phenotypically detectable resistance mechanisms. Thus, once it has been established that the species is a good target for the agent in question, it is the lowest possible susceptible breakpoint. It is also the relevant ‘cut-off’ to screen for low-level resistance.11 Furthermore, ECOFFs provide an opportunity to compare antimicrobial resistance and resistance development when clinical breakpoints: (i) are different between committees (e.g. EUCAST versus CLSI) or agencies (e.g. FDA versus CLSI); (ii) change over time; or (iii) are different between humans and animals.
There is no difference in principle between MIC distributions and ECOFFs in fast-growing non-fastidious and fastidious bacteria and those exhibited by slow-growing bacteria such as Mycobacterium tuberculosis (Figure 4) or fungi such as Candida spp. and Aspergillus spp. (Figure 5).23,24 Furthermore, MIC values for bacteria from humans and animals are distributed in the same way.25
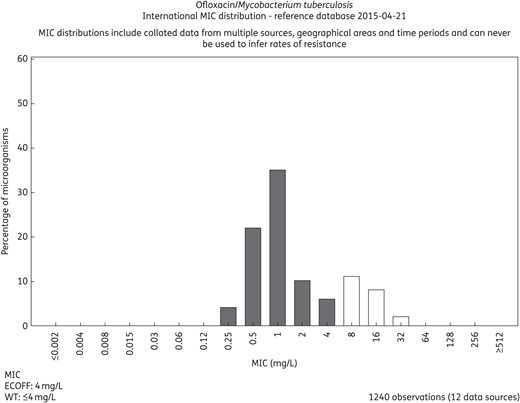
MIC distributions for ofloxacin and M. tuberculosis based on contributions from 12 independent investigators. The distribution is available on the EUCAST MIC distribution web site (http://mic.eucast.org/Eucast2/regShow.jsp?Id=37681).
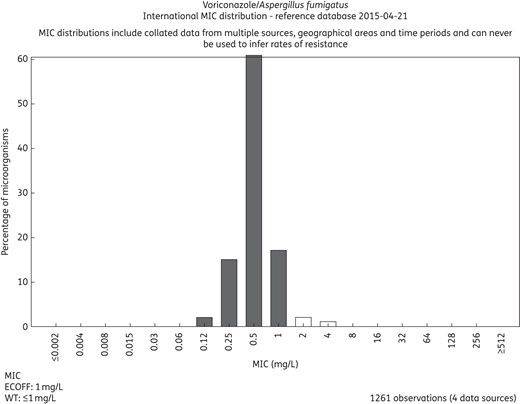
MIC distributions for voriconazole and Aspergillus fumigatus based on contributions from four independent investigators. The distribution is available on the EUCAST MIC distribution web site (http://mic.eucast.org/Eucast2/regShow.jsp?Id=27905).
The EUCAST software and database structure for MICs and zone diameter distributions is owned by ESCMID and ECDC, but the MIC distributions are owned individually by each contributing investigator.
Phenotypic AST and breakpoints
AST using phenotypic methods is based on the standardized measurement of the MIC and on breakpoints. Since 2006, the standardized measurement of an MIC using the broth microdilution technique has been described in the International Organization for Standardization (ISO) standard.26 All other phenotypic tests, including disc diffusion tests, gradient tests and semi-automated susceptibility testing systems, are surrogate methods that must be calibrated to the ISO method to withstand modern requirements for performance, now often as part of a formal accreditation.
Today, EUCAST breakpoints are available on semi-automated machines such as the Vitek2 (bioMérieux), the Phoenix (BD) and the MicroScan (Siemens) and can be used directly with any of three commercially available gradient tests (bioMérieux, Thermofisher, Liofilchem). Their ability to cope with EUCAST breakpoints, recommendations and nomenclature is described in a document ‘Compliance of Manufacturers’ available on the EUCAST web site.27 All now report EUCAST ‘S’, ‘I’ and ‘R’ (in accordance with the EUCAST category interpretation, namely that S ≤X and R >Y), and ‘IE’, which signifies ‘insufficient evidence to determine a breakpoint’, for which the agent should either not be reported or be reported as ‘IE’ accompanied by an MIC value or a comment, and by a ‘dash’ where the agent should either not be reported or be reported resistant without testing. EUCAST takes no responsibility for the accuracy and reproducibility of AST systems listed in the document ‘Compliance of Manufacturers’ but will publish warnings on the EUCAST web site when aberrations are detected.
In 2008, EUCAST performed a survey among European countries, which showed that the implementation of EUCAST breakpoints in Europe would require a EUCAST-recommended disc diffusion method calibrated to EUCAST clinical breakpoints. Even laboratories that had embraced semi-automated systems were in need of another method as a complement to their semi-automated method. A questionnaire sent to all GC members disclosed an overwhelming majority in favour of using the same or a similar technical base for the EUCAST-recommended disc diffusion test as that originally described by Bauer et al.2 and adopted by the CLSI. There were several reasons for this: Mueller–Hinton (MH) agar is the only medium that is available from several manufacturers and for which there is enough experience of susceptibility testing. It has become the most frequently used platform for susceptibility testing in laboratories around the world, and we felt that suggesting a method that was at least recognizable and that would not require major changes in the laboratory would facilitate and speed up the process. However, there were countries and laboratories not using MH agar, and for them the change was more pronounced.
Over the following 4 years, my laboratory (Clinical Microbiology, Central Hospital, Växjö, Sweden) took the main responsibility for the development of a disc diffusion method. By including MH and discs from at least three manufacturers throughout the development, we ensured that the recommendations included a reasonable manufacturer's batch-to-batch variation as well as the variability occurring between manufacturers so as not to make it too difficult for laboratories or manufacturers to attain reasonable accuracy and reproducibility. Since EUCAST had decided not to let clinical breakpoints split WT MIC distributions, there was no need for an intermediate category to buffer the methodological variation. In EUCAST, the intermediate category is used mainly to signal the need for a higher dose (or optimized drug delivery) to cover a higher MIC target than that covered with the standard dosages.
The EUCAST disc diffusion test was developed along similar lines to the method used by many laboratories. However, the fact that we started from scratch allowed us to introduce a number of improvements.
It was decided to use MH medium and a Kirby–Bauer inoculum (using a suspension with a turbidity equivalent to that of a 0.5 McFarland standard) and to recommend swabbing of plates, 16–20 h of incubation in air (and CO2 for fastidious organisms) and 35 ± 1°C for incubation.
We based the development of an MH agar for fastidious microorganisms on our collective experience with the BSAC and SRGA disc diffusion testing systems. MH agar was supplemented with 5% mechanically defibrinated horse blood and 20 mg/L β-NAD. This turned out to be a better medium for Haemophilus influenzae than the Haemophilus Test Medium recommended by the CLSI, simply because the organism grew decidedly better. The medium also grew many other fastidious organisms, such as Pasteurella spp., Corynebacteria spp., Listeria monocytogenes, Aerococcus spp., Kingella spp. and Campylobacter spp. but was not useful for Neisseria spp. or most anaerobic bacteria. It did not need the 20–24 h of incubation recommended by the CLSI, and therefore EUCAST may uniformly recommend 16–20 h of incubation.28–30
With experience from the SRGA and BSAC test systems, we developed lower disc contents than those recommended by the CLSI for several agents. Discs that are too potent yield very large zone diameters and the discrimination between susceptible and non-susceptible organisms is often poorer. Most CLSI disc contents were developed during a time when industry influenced the content of discs and where decisions were based on commercial rather than methodological principles. As a few examples, EUCAST has brought down disc contents for cefotaxime from 30 to 5 μg, ceftazidime from 30 to 10 μg and benzylpenicillin from 10 to 1 μg.
Much of the basic work on the disc diffusion method was financed by ESCMID and performed in the EUCAST Development Laboratory in Växjö. However, many other laboratories around the world were involved—mostly in areas where they had specific interest, know-how and an abundance of well-characterized isolates with a varying range of susceptibility. We welcomed collaborators with special knowledge of Listeria, Campylobacter, Corynebacteria, Kingella, Salmonella and many others. The EUCAST Development Laboratory provided structure, coordination, materials and transportation of isolates, and the EUCAST Network Laboratories provided isolates and laboratory work. All collections of bacteria, many of which were supplied by friends and co-workers across the world, were top-loaded with organisms with known and varied resistance mechanisms, and we especially valued the addition of organisms with MIC values close to the S and R breakpoints. Care was taken to identify several manufacturers of discs and media. All development was performed on MH media from at least three manufacturers and on several batches from each of them. Likewise, discs from at least two, often three, producers were utilized, both for correlations between MICs and inhibition zone diameters and for defining quality control (QC) zone diameter targets and ranges for the EUCAST QC tables. We adopted a technique used for many years by the BSAC working party on AST and the SRGA-M subcommittee to plot integrated MICs and inhibition zone diameters. This is shown for ciprofloxacin and E. coli (Figure 3a) and for tetracycline with Campylobacter jejuni and Campylobacter coli versus (Figure 3b). It was also used for demonstrating the correlation between zone diameter breakpoints and specific resistance mechanisms as shown for a cefoxitin disc and S. aureus correlated to the presence and absence of the mecA gene (Figure 6a), and for a benzylpenicillin 1 U disc and H. influenzae and the presence and absence of β-lactam resistance mediated by an aberrant PBP as determined by PCR (Figure 6b). All EUCAST correlations between MIC values (as determined by broth microdilution) and inhibition zone diameters (as determined by the EUCAST disc diffusion method) are freely accessible from the EUCAST web site.31 These correlations also serve as a reference for checking performance of the methods in individual laboratories.
Inhibition zone diameter correlated to specific resistance mechanisms. (a) Methicillin resistance in S. aureus defined as mecA-positive (black) and mecA-negative isolates (grey) correlated to the inhibition zone diameters using a cefoxitin 30 μg disc. Isolates without mecA exhibit zone diameters of 22 mm or above. (b) Chromosomally mediated β-lactam resistance defined by mutations in the PBPs of 104 β-lactamase-negative H. influenzae correlated to the inhibition zone diameters using a benzylpenicillin 1 U disc. Isolates without PBP mutations exhibit zone diameters of 12 mm or above.
Where the methodology coincided between EUCAST and CLSI, the QC ranges published by CLSI were thoroughly checked against discs and MH agar from different manufacturers. Some were found to be incorrect and these were adjusted in discussions between the CLSI and EUCAST. In other cases, EUCAST chose to use lower disc contents or a different medium (for fastidious organisms) compared with the CLSI, and new QC ranges were then developed. We also introduced the use of a target value in the middle of the QC range to emphasize that the aim is to achieve mean values over time that are close to the target but may vary within the range from day to day. Hence, it is not good enough to aim only for a mean that is inside the range. We put our recommendations to the test by involving the EUCAST Network Laboratories around the world to help ensure that the recommendations were realistic and attainable. We now know that they are and that QC strains on relevant antimicrobial agents (those that are in clinical use at the laboratory in question) should be run at least 5 days a week to ensure a high and consistent quality output from the laboratory. From the EUCAST QC tables,32 it is evident which ranges are identical in the EUCAST and CLSI recommendations.
EUCAST web site
The EUCAST web site is freely accessible at http://www.eucast.org. It requires no log in and no registration. It contains all the relevant information on EUCAST and on EUCAST clinical MIC and zone diameter breakpoints. By signing up to the newsflow or by regular visits to the table of changes in the left-hand margin (http://www.eucast.org/website_changes/), users can keep abreast of all additions and changes to the EUCAST system. The web site is frequently updated. Almost 60 000 visits per month attests to the usefulness and popularity of the web site. Through this web site, it is also possible to link to the EUCAST web site on International MIC and zone diameter distributions and ECOFFs.
Implementation of EUCAST standards and methods
EUCAST clinical breakpoints have replaced national breakpoints in France, Germany, Norway, Sweden, the Netherlands and the UK. Other European countries have either completed the transition from CLSI to EUCAST or are in the process of doing so.33 This is also the case for an increasing number of laboratories outside Europe in countries currently including South Africa, Australia, Morocco, New Zealand and Brazil. EUCAST clinical breakpoints are now implemented on machines for semi-automated susceptibility testing and the transition is simple for laboratories using these devices—just the push of a button. However, each device has limitations and these are listed on the EUCAST web site.29
The EUCAST disc diffusion test has replaced national disc diffusion tests in Scandinavia, Germany and France and will soon do so in the UK,34 leaving only two disc diffusion tests on the scene: the CLSI and EUCAST methods. The development of the change from CLSI to EUCAST standards is nicely illustrated in the graph from the UK National External Quality Assessment Service (NEQAS) (Figure 7), which shows that almost 90% of laboratories taking part in NEQAS have currently adopted EUCAST guidelines.
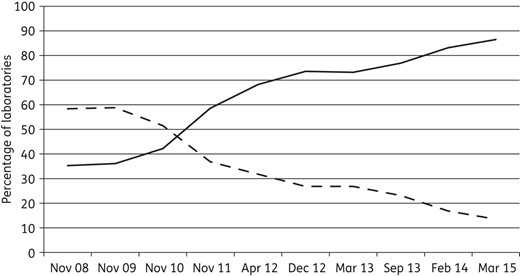
The adoption of EUCAST guidelines (continuous line) and the fate of CLSI guidelines (broken line) in Europe from November 2008 to March 2015 by participants (630–750 per year from 40 countries) in the UK NEQAS. Courtesy of Christine Walton and Derek Brown, UK NEQAS.
The future
A frequently asked question is ‘When do we get truly international breakpoints?’, meaning ‘When will EUCAST and CLSI merge or cooperate to the extent where all breakpoints are harmonized?’ CLSI and EUCAST are set up in completely different ways. The leadership of CLSI has taken some tough decisions over the last year and is in the process of removing industry from voting on breakpoint decisions, but this is hardly enough. EUCAST is financed by ESCMID and to some extent by the ECDC. The CLSI depends on income from sales of documents and from industry. A major difference, however, is the relationship between the respective committees and the medicines agencies. Whereas EUCAST and the EMA have developed a working relationship in which the EMA will normally adopt breakpoints developed by EUCAST, the FDA will not do the same with CLSI breakpoints.
Although cooperation between EUCAST and CLSI on determining breakpoints is less than impressive, it has occurred. In the first decade of 2000, the two committees simultaneously and partly together revised breakpoints for third-generation cephalosporins, agreeing on cefotaxime and ceftriaxone breakpoints and the removal of the caveat that ‘third-generation cephalosporin breakpoints were only valid provided the production of an ESBL had first been excluded’. At approximately the same time, under the guidance of the ISO, representatives from the two committees collaborated to create an international standard for testing the in vitro activity of antimicrobial agents against rapidly growing aerobic organisms26 and in a separate document a standard for the evaluation of performance of antimicrobial susceptibility test devices.35
The two committees recently created a joint subcommittee with the remit to review and possibly revise colistin (polymyxin B) breakpoints and methods for MIC determination, the final report to be made public in 2015. In addition, in the phenotypic susceptibility testing of bacteria, there is technical cooperation on QC issues and on the development of various screening procedures, such as the detection of methicillin resistance in staphylococci using a cefoxitin disc and the use of a pefloxacin disc to detect low-level fluoroquinolone resistance in Salmonella spp.
Despite this, I still think that a formal merge of the two committees will be difficult, although the thought has occurred to many. Many countries, certainly in Europe but also in many other places, have currently decided to adopt EUCAST standards and recommendations.33 The fact that all output is easily and freely available on the EUCAST web site is certainly an attraction. Over the last year, a group of scientists in the USA has formed a EUCAST NAC and signed up to the EUCAST process. This may hold greater promise for future international agreement.
The future of EUCAST involves setting breakpoints, developing standard methods and QC ranges and targets for a series of new agents currently under development. A number of species are under consideration for clinical breakpoints and, where relevant, the development of disc diffusion methodology (Aerococcus spp., Kingella kingae, Nocardia spp., Actinomyces spp. and Mycobacterium spp.). Some species have clinical breakpoints but lack a useful everyday method (Neisseria spp. and anaerobic bacteria with the exception of Clostridium difficile). The MH fastidious medium developed by EUCAST has proven suitable for streptococci (including pneumococci), H. influenzae, Corynebacterium spp., Campylobacter spp., Pasteurella spp., L. monocytogenes, Aerococcus urinae and Aerococcus sanguinicola and most probably also for K. kingae. It will not grow all anaerobes or Neisseria sufficiently well, but work with these continues. The standing AFST subcommittee meets at least twice yearly and has so far managed to keep up with the requirements for procedural speed. The new subcommittee on the relationship between phenotypic AST and WGS will commence working in 2015. More and more countries ask for the help of EUCAST in changing from their old method to standardized susceptibility testing according to EUCAST. When I took on the role of chair of EUCAST in 2001, little did I expect to see a day when almost all of Europe and sizable parts of the rest of the world would adopt the recommendations of ‘my’ committee. This is the product of those who saw the need for EUCAST and had the courage to abandon what they were comfortable with, one of the most difficult leaps to take. I thank all those who made this possible!
Transparency declarations
Due to our developmental role, the EUCAST Development Laboratory tests products and gives advice to many companies producing materials for AST, such as Mast, Oxoid, BD, bioMérieux, Liofilchem, Bio-Rad and others. I consult for Oxoid on technical matters.
Acknowledgements
EUCAST is funded by ESCMID and ECDC. I wish to acknowledge the many SC members who have helped make EUCAST what it is today, especially Rafael Canton, who took over the chair of EUCAST in 2012, and Derek Brown, long-time meticulous scientific secretary and friend. Special thanks to Erika Matuschek and Jenny Åhman who keep track of all technical developments in the EUCAST Development Laboratory, Sweden.
