


Abstract
Anaerobic ammonium oxidation (anammox) contributes substantially to ocean nitrogen loss, particularly in anoxic marine zones (AMZs). Ammonium is scarce in AMZs, raising the hypothesis that organic nitrogen compounds may be ammonium sources for anammox. Biochemical measurements suggest that the organic compounds urea and cyanate can support anammox in AMZs. However, it is unclear if anammox bacteria degrade these compounds to ammonium themselves, or rely on other organisms for this process. Genes for urea degradation have not been found in anammox bacteria, and genomic evidence for cyanate use for anammox is limited to a cyanase gene recovered from the sediment bacterium Candidatus Scalindua profunda. Here, analysis of Ca. Scalindua single amplified genomes from the Eastern Tropical North Pacific AMZ revealed genes for urea degradation and transport, as well as for cyanate degradation. Urease and cyanase genes were transcribed, along with anammox genes, in the AMZ core where anammox rates peaked. Homologs of these genes were also detected in meta-omic datasets from major AMZs in the Eastern Tropical South Pacific and Arabian Sea. These results suggest that anammox bacteria from different ocean regions can directly access organic nitrogen substrates. Future studies should assess if and under what environmental conditions these substrates contribute to the ammonium budget for anammox.
Introduction
Anaerobic ammonium oxidation (anammox) plays a major role in aquatic nutrient cycling. In this microbial process, autotrophic bacteria oxidize ammonium with nitrite, producing energy for CO2 fixation and cellular growth, and N2 as an end product. Anammox is therefore a nitrogen sink, converting bioavailable nitrogen to a gaseous form unavailable to most organisms. Anammox is particularly important in anoxic marine zones (AMZs) ([1–4]). In the major AMZs of the Eastern Tropical Pacific and Arabian Sea, dissolved oxygen is below detection (<10 nM), nitrite is abundant (often >5 μM), and anammox combined with heterotrophic denitrification drive nitrogen loss, with ~20–40% of ocean nitrogen loss occurring in AMZs [5–10]. In these systems, anammox bacteria increase in abundance at anoxic depths, where ammonium is supplied by the mineralization of organic matter, yet concentrations are low and turnover and competition for this resource are high [11, 12]. Under these conditions, anammox bacteria may be under pressure to use alternative substrates as ammonium sources, or potentially to use energy and biomass production pathways other than anammox. Indeed, in experimental studies of anammox in AMZs, the direct use of organics as a source of ammonium by anammox bacteria was proposed as an explanation for higher anammox rates in incubations with 15N-nitrite compared to those with 15N-ammonium, as the former would integrate N2 production from anammox based on all ammonium sources [13, 14]. However, the metabolic versatility of marine anammox bacteria remains largely unknown. This is due in part to limited genomic characterizations of anammox bacteria from diverse marine habitats, including AMZs.
Anammox has thus far been described only in bacteria of the Order Brocadiales in the phylum Planctomycetes. This Order occurs globally in natural and man-made environments in both fresh and saltwater. No Brocadiales bacteria have yet been isolated in pure culture. The known diversity of this group is distributed across the Candidatus genera Brocadia, Kuenenia, Anammoxoglobus, Jettenia, and Scalindua. Of these, Ca. Scalindua is the dominant genus in ocean habitats, including sediments and AMZs [12, 15], but has also been found in freshwater [16]. Insight into the genomic potential of Ca. Scalindua is based on metagenomic contigs of Ca. S. profunda from marine sediment [17], Ca. S. brodae from a wastewater plant [18], and Ca. S. rubra from a marine brine pool [19]. These large genomes (>4000 genes; ~4–5.2 Mbp) contain many genes absent from characterized genomes of other anammox genera, but also vary in gene content among species. For example, of these three species, only Ca. S. rubra contains genes for gas vesicle biosynthesis, presumably as an adaptation for regulating position in brine pools. However, genomes of Ca. Scalindua cells from AMZs have not yet been reported. Our knowledge of gene content in Ca. Scalindua from AMZs is based on recruitment of meta-omic sequences to non-AMZ genomes, e.g., of Ca. Scalindua profunda [5, 17, 20]. We therefore have limited understanding of how anammox bacteria may be adapted to AMZ conditions.
The waste product urea (CO(NH2)2) and its breakdown product cyanate (OCN−) are potential alternative substrates for anammox bacteria. Urea is ubiquitous in ocean waters, originating from microbial degradation of dissolved organic matter and nitrogenous waste from microbes and animals [21]. Diverse microorganisms produce urease enzymes that hydrolyze urea to ammonia and CO2, potentially to aid pH regulation or to acquire ammonia for biomass production or energy generation [22]. Ureases have even been found in aerobic ammonia-oxidizing bacteria [23] and archaea [24, 25], as well as nitrite-oxidizing bacteria [26], suggesting that organic nitrogen plays a role in nitrification. Indeed, certain aerobic ammonia-oxidizing bacteria not only oxidize ammonia derived from urea, but also assimilate the CO2 resulting from urease activity [27]. Recently, anammox bacteria from the Eastern Tropical South Pacific (ETSP) AMZ were shown to produce N2 from added urea, but only after a lag of 1.5 days [28]. This was interpreted as evidence that anammox bacteria do not degrade urea directly but instead rely on the urealytic activity of other organisms or on abiotic urea degradation to supply ammonium. An inability of anammox bacteria to directly degrade urea is supported by the absence of urease-encoding genes (ure) in available anammox genomes.
In contrast to urea, cyanate addition stimulated N2 production by anammox without a lag phase in incubations of AMZ water [28]. This suggests that AMZ anammox bacteria might use cyanate directly, presumably though conversion to ammonia and CO2 by a cyanase enzyme, with the resulting ammonium used for anammox. Although absent from draft genomes of other Ca. Scalindua species [19], a putative cyanase-encoding gene (cynS) is present in the metagenome of Ca. S. profunda from sediment [17], and sequences related to this gene were detected in AMZ metagenomes and metatranscriptomes [28]. However, data conclusively linking cyanases to anammox bacterial genomes from AMZs are not yet available, and it is therefore unknown if these bacteria might also rely on other microbes for cyanate degradation, as has been shown for certain aerobic ammonia oxidizers [29].
Here, we explored the metabolic properties of Ca. Scalindua sp. from a marine AMZ, testing the hypothesis that these bacteria have the potential for directly catabolizing organic nitrogen substrates as ammonium sources for anammox. We explored this hypothesis using genomes of Ca. Scalindua cells from the Eastern Tropical North Pacific (ETNP) AMZ off Mexico. These genomes were then analyzed in conjunction with ETNP chemical concentration, anammox rate, and metatranscriptome data from a cruise in 2014. The results provide insight into the genetic basis for environmental variation and adaptation in this globally important lineage.
Materials and methods
Sample collection
Samples for single amplified genome (SAG) analysis were collected in 2013 from station 6T (18° 54.0N, 104° 54.0 W; Fig. S1) in the ETNP AMZ during the Oxygen Minimum Zone Microbial Biogeochemistry Expedition (OMZoMBiE) cruise (R/V New Horizon; 13–28 June). Seawater for cell sorting and SAG sequencing was collected from the secondary nitrite maximum (125 m) and AMZ core (300 m) using Niskin bottles on a rosette containing a Conductivity-Temperature-Depth profiler (Sea-Bird SBE 911plus). From each depth, triplicate 1 ml samples of bulk seawater (no pre-filtration) were aliquoted into sterile cryovials and 100 μl of a glycerol TE stock solution (20 ml 100 × TE pH 8.0, 60 ml deionized water, 100 ml glycerol) was added to each vial. The vials were then mixed and frozen at −80 °C.
Samples for metatranscriptome analysis and measurements of anammox rates were collected from the ETNP AMZ during a second OMZoMBiE cruise, in 2014 (R/V New Horizon; 10 May–8 June, 2014). Water was collected at six stations spanning a coastal to offshore gradient (Fig. S1). Stations and depths sampled for metatranscriptomics (n = 21) are in Table S1. Eight of the 21 metatranscriptome datasets were generated in this study; the remainder were generated in two prior studies [30, 31] and re-analyzed here. Seawater was collected by Niskin with microbial biomass then collected by in-line filtration of seawater (~1.5–2.5 L) through a glass fiber disc prefilter (GF/A, 47 mm, 1.6 µm pore-size, Whatman) and a primary collection filter (Sterivex™, 0.22 µm pore-size, Millipore) using a peristaltic pump. Sterivex™ filters were filled with RNA stabilizing buffer (25 mM sodium citrate, 10 mM EDTA, 5.3 M ammonium sulfate, pH 5.2), flash-frozen in liquid nitrogen, and stored at −80 °C. Approximately 15–45 min elapsed (depending on depth) between capture in the Niskin and arrival on deck; ~20 min elapsed between water retrieval from the Niskin and fixation of filters in buffer.
Ammonium concentrations were determined fluorometrically aboard ship using the orthophaldialdehyde method [32], with a detection limit of 10 nM. Samples for measuring nitrite concentrations were collected in acid-cleaned HDPE bottles and stored frozen until spectrophotometric measurement using the Griess method [33] with a Westco SmartChem 200 (Unity Scientific). On a cruise to the study area in 2017 (R/V Oceanus cruise OC1705), urea concentrations were determined fluorometrically following Mulvenna and Savidge [34] with a 5 cm cuvette. This method has a detection limit of 45 nM.
Anammox rate measurements
Anammox rates were measured for 14 of the 21 water samples from which metatranscriptomes were generated (Fig. 1, S2, Table S1). Water was sampled directly from the Niskin and transferred to 250 ml glass bottles without pre-filtration. Bottles were overflowed (three volume equivalents) and sealed without bubbles with deoxygenated butyl rubber stoppers to minimize oxygen contamination (following [13]). Within 6 h of collection, each bottle was amended with 5 µM 15NH4+, and purged with helium for ~20 min. With a slight overpressure, water was dispensed into 12 ml exetainers (Labco, Lampeter, Ceredigion, UK), which were immediately capped with deoxygenated lids. Headspaces of 2 ml were introduced into each exetainer and flushed twice with helium, with shaking between flushings. Exetainers were then incubated in the dark at in situ temperature (13 °C) for 24 h. For each sample, triplicate exetainers were preserved with 100 µl of 50% (w/v) ZnCl2 at the start of the incubation and again after 24 h.
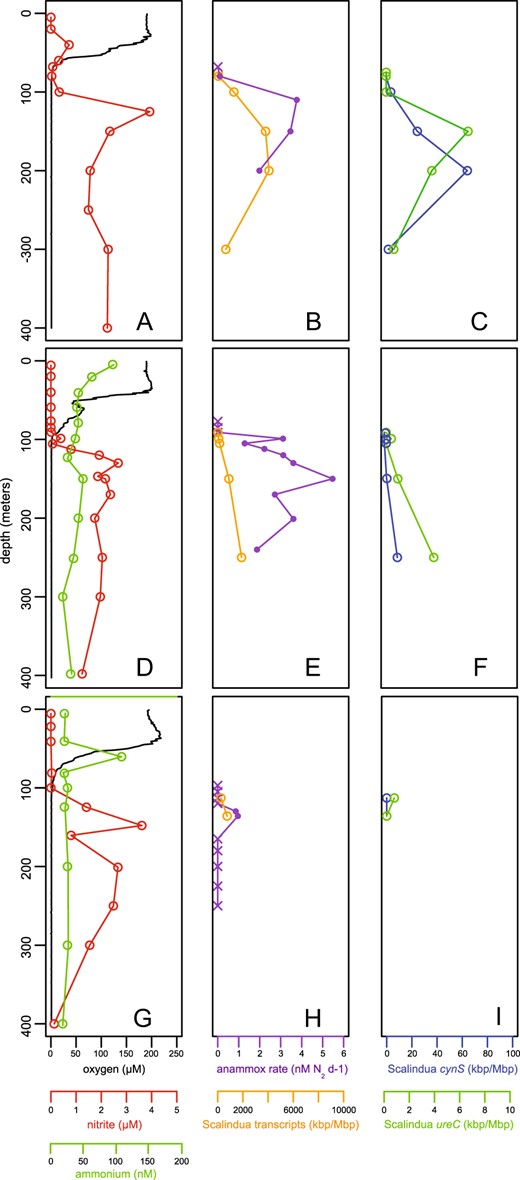
Anammox rates and representation of ETNP Ca. Scalindua transcripts relative to dissolved oxygen, ammonium, and nitrite concentrations at three ETNP stations: 6 (a–c), 7 (d–f), and 3 (g–i). The first column displays dissolved oxygen (black line, μM), nitrite (red circles and line, μM), and ammonium (green circle and line, nM). An ammonium profile at station 6 showed concentrations consistently above 140 nM, which is inconsistent with all other stations sampled and with AMZ literature to date. We therefore interpret this signal as potential contamination and have excluded these data. The second column displays anammox rates (purple line and circles) and the cumulative contribution of all transcripts recruiting to ETNP Ca. Scalindua (orange circle and lines, kbp/Mbp). Purple crosses denote non-significant rates. Transcript representation is calculated as length-corrected kilobase pairs of transcripts mapping (via BLASTX, with bit score >50 and AAI >95%) to a composite ETNP Ca. Scalindua SAG database, per Megabase pairs sequenced. The third column designates the activity and distribution of cyanate hydratase (cynS) and urease (ureC) transcripts associated with ETNP Ca. Scalindua. For all rows, the y-axis indicates water column depth. SAG samples were collected from 125 to 300 m at station 6 in 2013
Production of 14N15N and 15N15N was determined on a gas chromatography isotope ratio mass spectrometer (GC-IRMS) as in Dalsgaard et al. [1]. Rates of N2 production by anammox were calculated as in Thamdrup and Dalsgaard [35] from the slope of the linear regression of 14N15N with time. t-tests were applied in all cases to determine whether rates were significantly different from zero (p < 0.05).
SAG generation and taxonomic screening
SAGs were generated from individual bacterial cells according to the Department of Energy Joint Genome Institute workflow following Rinke et al. [36, 37] with minor modifications (as in ref. [38]). Cells were sorted on a BD Influx (BD Biosciences) and treated with Ready-Lyse lysozyme (Epicentre; 5 U/μL final conc.) for 15 min at room temperature prior to adding lysis solution. Whole genomes were amplified by multiple displacement amplification (MDA) using the REPLI-g Single Cell Kit (Qiagen), with final reaction volumes of 2 μL and termination after 6 h. The taxonomic identity of each SAG was determined by PCR amplification and Sanger sequencing of a ~470 bp region of the 16S rRNA gene using primers 926wF (5′-AAACTYAAAKGAATTGRCGG- 3′) and 1392 R (5′-ACGGGCGGTGTGTRC- 3′) for archaea and bacteria. Recovered sequences (average length: 423 bp) were classified using MOTHUR’s ‘classify_seq’ against the Greengenes database, with the probability of correct assignment to a taxonomic group calculated using the naïve Bayesian classifier method [39].
SAG sequencing
In total 20 SAGs classified with high confidence as belonging to the genus Ca. Scalindua were selected for genome sequencing. These included 9 and 11 SAGs from 125 m and 300 m, respectively. Indexed DNA sequencing libraries were prepared using the Nextera XT DNA Library Prep kit (Illumina, San Diego, CA, USA) following manufacturer instructions, pooled, and sequenced on an Illumina MiSeq using a v2-500 cycle (paired end 250 × 250 bp) kit.
RNA extraction and cDNA sequencing
RNA was extracted from Sterivex™ filters as in Ganesh et al. [5] using a modification of the mirVanaTM miRNA Isolation kit (Ambion). Filter cartridges were thawed on ice, and RNA stabilizing buffer was expelled by syringe from each cartridge and discarded. Cells were lysed by adding Lysis buffer and miRNA Homogenate Additive (Ambion). Following vortexing and incubation on ice, lysates were transferred to RNAase-free tubes and RNA extracted by acid phenol:chloroform according to the kit. The TURBO DNA-free™ kit (Ambion) was used to remove DNA and the extract purified using the RNeasy MinElute Cleanup Kit (Qiagen). RNA was prepared for sequencing using the ScriptSeqTM v2 RNA-Seq Library preparation kit (Epicentre). cDNA was synthesized from fragmented total RNA (rRNA not removed) using reverse transcriptase and amplified and barcoded using ScriptSeq™ Index PCR Primers (Epicenter) to generate single-indexed libraries. cDNA libraries were pooled and sequenced on an Illumina MiSeq using a v2-500 cycle (paired end 250 × 250 bp) kit.
SAG assembly, quality control, and sequence analysis
Illumina reads were filtered for quality using a Phred score cutoff of 25 and trimmed using TrimGalore (http://www.bioinformatics.babraham.ac.uk/projects/trim_galore/). High quality paired reads were merged using FLASH [40]. Quality-trimmed merged and unmerged reads were combined and assembled using the SPAdes assembler [41] with k-mer sizes of 21,33,55,77,99,127, and the single-cell (-sc) option. Coding sequences were predicted using GeneMark.hmm [42], and 16S rRNA gene sequences were identified using RNAmmer [43], both using default parameters. Percentage of contamination and genome completeness were assessed based on detecting lineage-specific marker genes using CheckM [44].
Full-length (>1500 bp) 16S rRNA gene sequences were detected on 8 SAGs. These sequences were imported into the ARB environment [45] and placed within the ARB backbone tree using the parsimony tool. Brocadiales-associated 16S rRNA genes from Woebken et al. [12] and Galan et al. [46] were imported for comparative purposes to assign SAG 16S rRNA genes to previously reported sub-clades of marine Ca. Scalindua. Additional sequences from Schmid et al. [47], representing species-level Candidatus Scalindua designations, were also included as outgroups to the “Arabian Sea” sequence cluster (see Results below). Sequence alignments were created using the automated aligner, then manually curated when needed. To assess the 16S rRNA gene phylogeny using only informative positions, a mask was created based on the curated alignment, and used for construction of Neighbor-Joining (with Feldstein correction), Maximum Likelihood (with LG substitution model), and Parsimony trees with 1000 bootstraps for all models.
All SAG-associated assemblies generated from MDA products were analyzed using Prokka [48]. The “faa” files from this pipeline were used as queries for BLASTP searches against public and custom databases (described below). For visualization of gene order and synteny, contigs with features of interest were extracted from the “gbk” files from Prokka. Contigs of interest were then imported into “EasyFig” and compared to one another using BLASTN. The associated output figures were manually curated in Adobe Illustrator. The package T-REKs [49] was used to identify tandem repeats on contigs of interest.
Predicted amino acid sequences from 6 SAGs were used to create a composite SAG database for comparison against public databases using BLASTP and for use as a reference database for BLASTX-based analyses of metagenomes and metatranscriptomes (described below). Our goal in creating this database was to capture the majority of functional gene content across the SAGs (related to one another at roughly the species level; see Results), rather than to resolve population-level variation among the SAGs. The 6 SAGs were chosen because they had relatively high completeness (28.2–50.0%), minimal contamination (<5%), and full-length 16S rRNA gene sequences. SAG sequences were clustered (using UCLUST and USEARCH commands) at 50% amino acid identity (AAI). Clustering yielded 2703 proteins, including 49 of the 54 universally conserved single-copy ribosomal proteins [50]. This result suggested that the composite database was ~91% complete (based only on universal marker gene recovery) and that a complete composite database would contain ~3000 protein-coding genes (50% AAI clusters), roughly consistent with genome size estimates based on individual SAGs (extrapolated using estimated genome completeness and counts of detected genes per SAG; Table 1).
ETNP Ca. Scalindua single-cell amplified genome (SAG) statistics
| rRNA genes | Urease and cyanase-associated | Marker proteins−anammox metabolism | |||||||||||||||||||||||||
|---|---|---|---|---|---|---|---|---|---|---|---|---|---|---|---|---|---|---|---|---|---|---|---|---|---|---|---|
| SAG | Comp | Cont | Heter | ORFs | Mbp | Est Gen (Mbp) | a5S | a16S | a23S | bUreA | bUreB | bUreC | bUreD | bUreE | bUreF | bUreG | cCynS | cOcta HZO | cHzsA | cOcta Hao1 | cOcta Hao2 | cOcta Hao3 | cOcta Hao4 | cNirS | cAmtB1 | bAmtB2 | cAmtB3 |
| B14 | 31.0 | 3.5 | 50.0 | 700 | 0.74 | 2.40 | − | + | + | − | − | − | − | − | − | − | − | − | − | − | + | − | − | − | + | + | − |
| B17 | 31.6 | 0.0 | 0.0 | 862 | 0.91 | 2.88 | − | − | − | − | − | − | − | − | − | − | − | − | + | + | + | − | + | − | + | + | − |
| B21 | 23.1 | 1.7 | 50.0 | 451 | 0.45 | 1.95 | − | − | − | − | − | − | − | − | − | − | − | − | − | + | − | − | − | − | − | + | + |
| C14 | 12.3 | 1.8 | 100.0 | 745 | 0.62 | NA | − | − | − | − | − | − | − | − | − | − | + | − | − | − | − | + | + | − | − | − | − |
| C8 | 19.7 | 0.0 | 0.0 | 773 | 0.51 | 2.62 | − | − | − | − | − | − | − | − | − | − | − | − | − | − | − | + | − | − | − | − | − |
| E14 | 28.2 | 0.0 | 0.0 | 800 | 0.62 | 2.18 | − | + | − | − | − | − | − | − | − | − | − | − | − | − | − | + | − | − | − | − | − |
| F8 | 36.5 | 0.0 | 0.0 | 1101 | 0.92 | 2.53 | − | − | − | − | − | − | − | − | − | − | − | + | − | + | − | − | + | + | + | + | − |
| G15 | 28.6 | 3.9 | 40.0 | 1251 | 1.04 | 3.65 | − | − | − | + | + | + | − | + | + | + | + | + | + | − | + | − | − | − | 6 | − | + |
| H20 | 43.1 | 6.7 | 70.0 | 1104 | 0.98 | 2.28 | + | − | + | − | − | − | + | − | + | + | − | + | 2 | + | + | 2 | − | − | + | − | + |
| J11 | 20.5 | 1.8 | 33.3 | 581 | 0.43 | 2.11 | + | + | + | − | − | − | − | − | − | − | − | − | − | − | − | − | − | − | − | − | − |
| K21 | 27.8 | 1.9 | 100.0 | 1230 | 1.06 | 3.80 | − | − | − | − | − | − | + | − | − | − | + | − | + | − | + | − | + | + | + | + | + |
| L14 | 31.0 | 1.1 | 0.0 | 951 | 0.79 | 2.56 | − | + | − | − | − | − | − | − | − | − | + | − | − | − | − | − | − | − | − | − | − |
| L20 | 26.6 | 5.6 | 100.0 | 697 | 0.58 | 2.17 | − | − | − | − | − | − | − | − | − | − | − | + | − | − | − | − | − | − | + | − | − |
| L7 | 15.8 | 1.8 | 0.0 | 695 | 0.58 | NA | − | + | − | − | − | − | − | − | − | − | − | − | − | − | − | + | − | + | − | − | − |
| L9 | 39.5 | 4.4 | 33.3 | 1321 | 1.12 | 2.83 | − | − | + | + | + | − | − | − | − | − | − | − | − | + | − | + | − | − | − | − | − |
| M13 | 4.2 | 0.0 | 0.0 | 580 | 0.48 | NA | − | − | − | + | + | + | + | + | + | + | − | + | − | + | − | − | − | − | + | − | + |
| M7 | 33.3 | 2.8 | 50.0 | 978 | 0.79 | 2.36 | − | − | − | − | − | − | − | − | − | − | − | + | + | − | + | − | + | + | − | + | + |
| N13 | 0.0 | 0.0 | 0.0 | 234 | 0.19 | NA | − | + | − | − | − | − | − | − | − | − | − | − | − | − | − | − | − | − | + | − | − |
| N19 | 46.2 | 1.1 | 0.0 | 1243 | 1.11 | 2.41 | + | + | + | + | + | + | + | + | + | + | − | + | − | − | − | + | − | − | − | − | + |
| N22 | 50.0 | 2.8 | 33.3 | 1637 | 1.25 | 2.50 | + | + | + | − | − | − | − | − | − | − | + | + | − | − | − | − | − | + | − | + | + |
Comp genome completeness (%) estimated by CheckM
Cont genome contamination (%) estimated by CheckM
Heter strain heterogeneity index (range 1–100) estimated by CheckM
ORFs number of protein-coding open reading frames recovered per SAG
Mbp Mbp of contigs recovered per SAG
Est Gen estimated genome size based on estimated completeness and Mbp of SAG; done only for SAGs with completeness >20% and contamination <5%
Ure urease, UreA gamma subunit, UreB beta subunit, ureC alpha subunit
Cyn cyanate hydratase
Ure urease accesory proteins
Octa Octahaem
Hzo hydrazine oxidoreductase/dehydrogenase, S. profunda homolog scal03295
Hzs hydrazine synthase, S. profunda homolog scal01318
Hao hydroxylamine oxidoreductase. S. produnda Hao1 homolog 00421, S. profunda Hao2 homolog 01317, S. profunda Hao 3 homolog 02116, S. profunda homolog 4 04164
Amt ammonia transporter. S. profunda Amt1 homolog 00587, S. profunda Amt2 homolog 00591, S. profunda Amt3 homolog 00594
NirS cytochrome c nitrite reductase, S. profunda nirS homolog 02098
top BLASTN match to Brocadiales-affiliated homolog via queries against the SILVA database
top BLASTP match to non-Brocadiales via queries against the NCBI-nr database (i.e., homologs not detected in other Brocadiales)
top BLASTP match to Brocadiales-affiliated homolog via queries against the NCBI-nr database+publically available Brocadiales databases
A custom database of protein sequences from anammox taxa was created for comparison to the SAG gene set. Anammox-associated genomes were identified in NCBI using the search term “Brocadiales”. All amino acid sequences (n = 50,272) from these genomes were downloaded and combined with amino acid sequences (n = 4330) from Ca. Scalindua profunda (obtained according to [17]), yielding a database of 54,602 proteins. SAG proteins were then queried against this database via BLASTP. A sequence was considered unique to the SAG set if this query did not return a significant match (bit score >50) to a database sequence. Using this method, all urea-associated proteins (urease and accessory proteins) were identified as unique to the ETNP SAG set, along with 1803 other genes (1811 total unique). Of the other genes unique to ETNP SAGs, 1604 encoded hypothetical proteins. Non-hypothetical, unique protein-coding genes are listed in Table S2.
To further assess relatedness among SAGs, average nucleotide identity (ANI) and average amino acid identity (AAI) between each pair of SAGs was calculated using the ani.rb and aai.rb scripts from the enve-omics toolkit [51] with ani.rb cutoffs of 700 bp minimum alignment length and 70% minimum identity, and aai.rb cutoffs of bit score >50 and 90% minimum alignment length (as a fraction of the shorter sequence). The get_homologues package [52] was used to identify genes shared between each SAG and protein-coding sequences in the Ca. Scalindua profunda genome.
Metatranscriptome analysis
Metatranscriptomic reads were trimmed and merged as above for SAG sequences. Merged reads were compared to the SILVA rRNA database using BLASTN, and sequences with significant matches to rRNA genes were identified and removed. Non-rRNA reads were queried (BLASTX) against the composite database (see above). BLAST output was parsed to identify transcripts recruiting to SAGs with bit score >50 and AAI >95%. Counts of mapped transcripts per gene were normalized by gene length and sequencing depth, with final counts expressed as kilobase pairs of mapped transcripts per Megabase pairs sequenced.
Screening of AMZ metagenomes and metatranscriptomes
Publically available metagenomes and metatranscriptomes from the ETSP AMZ and metagenomes from the Arabian Sea and Saanich Inlet AMZs were screened for close homologs of SAG ure and cyn genes (Table 2). Sequences first were compared to the SILVA rRNA database using BLASTN, and sequences identified as rRNA genes/transcripts were removed. Remaining reads were compared using BLASTX against a database of the urease and cyanase-encoding genes recovered from the ETNP SAGs, using match thresholds of bit score >50 and AAI >95%. To test for the presence of SAG urease genes in the ETNP community, we screened a deeply sequenced (HiSeq) metagenome from 200 meters at station 6 T against a 39,476 bp ure-containing SAG contig using BLASTN. This metagenome was trimmed and cleaned as in [53] and binned using MetaBat [54]. Genes recovered on the assembled contigs of the aforementioned metagenome were also compared by BLASTX against a custom database containing the SAG urease genes and 2870 ureC genes available in NCBI’s protein database (as of 01-03-2018), using the match parameters described above. The taxonomic identities of top matching database entries were used to estimate the taxonomic richness of ureases in the OMZ community. We did not screen for Ca. Scalindua-like cynS genes, as these have been previously reported in Eastern Pacific AMZ meta-omic datasets [28].
Detection of ETNP Ca. Scalindua urease and cyanase genes in diverse AMZ datasets
| SRA identifier | DNA/RNA | Environment | Readsa | ureA | ureB | ureC | ureD | ureE | ureF | ureG | cynS |
|---|---|---|---|---|---|---|---|---|---|---|---|
| SRX025906 | DNA | 50 m, oxycline, Chile, 2008 | 393403 | — | — | — | — | — | — | — | — |
| SRX025907 | RNA | 50 m, oxycline, Chile, 2008 | 379333 | — | — | — | — | — | — | — | — |
| SRX025908 | DNA | 85 m, base of oxycline, Chile, 2008 | 595662 | — | — | — | — | — | — | — | — |
| SRX025909 | RNA | 85 m, base of oxycline, OMZ, Chile, 2008 | 142020 | — | — | — | — | — | — | — | — |
| SRX025910 | DNA | 110 m, upper anoxic OMZ, Chile, 2008 | 197843 | — | — | — | 1 | — | — | 1 | — |
| SRX025911 | RNA | 110 m, upper anoxic OMZ, Chile, 2008 | 514076 | 1 | – | 2 | 1 | — | — | — | — |
| SRX025912 | DNA | 200 m, anoxic OMZ core, Chile, 2008 | 516426 | — | 4 | 8 | 10 | 6 | 5 | 6 | 2 |
| SRX025913 | RNA | 200 m, anoxic OMZ core, Chile, 2008 | 441273 | — | 1 | 2 | — | 2 | — | 2 | 4 |
| SRX080956 | DNA | 50 m, oxycline, Chile, 2010 | 1534798 | — | — | — | — | — | — | — | — |
| SRX080960 | DNA | 110 m, upper anoxic OMZ, Chile, 2010 | 1459563 | 1 | — | 1 | 2 | 2 | — | 2 | |
| SRX080955 | DNA | 110 m, upper anoxic OMZ, Chile, 2009 | 917531 | 1 | — | — | 1 | — | — | — | 1 |
| SRR070082 | DNA | 200 m, anoxic OMZ core, Chile, 2009 | 930936 | 1 | 1 | 1 | 2 | 2 | 1 | 1 | 1 |
| SRR2657589 | DNA | 600 m, anoxic OMZ core, Arabian Sea, 2009 | 2588720 | 2 | 0 | 2 | 3 | 1 | 1 | 0 | — |
| SRX1878045 | RNA | 200 m, anoxic seasonal OMZ, Saanich Inlet | 69907523 | — | — | — | — | — | — | — | — |
Total number of sequence fragments in dataset
All sequence data generated in this study are in NCBI under BioProject PRJNA407229.
Results and Discussion
Hydrographic conditions and anammox activity in the ETNP AMZ
Figure 1 shows data from the three most extensively sampled ETNP stations, including two near-shore stations (6 T, 7 T) and a station (3 T) farther offshore; data from three additional stations are in Fig. S2, with station coordinates in Table S1. At all stations, anoxic conditions were observed from depths of ~70–100 m. Nitrite concentration was near the detection limit in the surface layer, but increased directly below the oxic-anoxic interface to 3–5 μM, a characteristic feature of AMZs. Ammonium concentrations were generally in the low nanomolar range (20–50 nM) (Fig. 1, S2). Neither cyanate nor urea was measured on the 2014 cruise. However, in samples from a 2017 cruise along the same transect, urea concentration was below the detection limit within the AMZ, but above detection in the mixed layer, reaching maxima of ~100 nM (data not shown).
Anammox rates varied over depth and with proximity to shore. Measured rates were highest in the upper AMZ, increasing sharply below the oxic-anoxic interface with near-maximal rates reached only 10–20 m deeper (Fig. 1, S2). Rates were lowest and confined to a narrow depth range at station 3 T farthest from shore (up to 1 nM N2 d−1), with rates increasing to 5.5 nM N2 d−1 at the near-shore sites (6 T, 7 T; Fig. 1). This is consistent with analyses in the ETSP AMZ off Chile and Peru, which showed anammox rates to be highest in shelf waters and to diminish with distance from shore, strongly correlating with organic matter export [11]. Our measured rates are similar to those measured previously at sites close to ours in the ETNP [5, 55] and at other open ocean AMZ sites [56].
Genomic evidence for organic nitrogen utilization in ETNP Ca. Scalindua
Ca. Scalindua bacteria in AMZs may contain metabolic features distinct from those of anammox bacteria in other environments. We explored this potential by analyzing 20 SAGs from two anoxic depths at station 6 T in the ETNP. All 20 SAGs were classified with high confidence (Probability score = 100.0, Naïve Bayesian classifier) as Ca. Scalindua sp. based on PCR-amplified 16S rRNA gene fragments.
As is common in single-cell analysis [36, 57], estimated genome completeness and strain heterogeneity varied considerably among the SAGs (range: 0–50% and 0–100%, respectively; average: 27.4% and 33.0%). However, contamination was consistently low (average: 2.0%) and in some cases non-detectable, with moderate levels (>5%) in only two SAGs (Table 1). Based on genome completeness and total recovered sequence length, estimated genome size averaged 2.6 Mbp (range: 2.0–3.8 Mbp). The SAG with the highest estimated completeness (50%, SAG N22) contained 1637 protein-coding genes, suggesting a total gene count (~3300) smaller than that of Ca. Scalindua genomes of other species (>4000 genes). On average, regions homologous between SAGs shared 94.1% ANI (standard deviation: 2.7) and homologous open reading frames shared 85.3% AAI (standard deviation: 3.8) among SAGs and 73% AAI with homologs from Ca. Scalindua profunda, a sediment anammox bacterium with a near complete (>90%) genome. Analysis of diverse bacteria shows that strains of the same species generally share >94% ANI [58], whereas the AAI value observed here falls at the lower end of the estimated species boundary [59]. Full-length (>1500 bp) 16S rRNA genes were identified in 8 SAGs (1 from 125 m, 7 from 300 m), shared 98–100% ANI, and were identical or nearly identical to the 16S rRNA gene fragments obtained from all SAGs by PCR-based screening (Fig. S3). These 8 full-length 16S rRNA sequences clustered in a monophyletic sub-clade of Ca. Scalindua referred to as the Arabian Sea cluster and were nearly identical to clones primarily from the AMZ in the Arabian Sea [12], but more distantly related to a cluster of Ca. Scalindua sequences from the ETSP AMZ off Peru and Chile (Fig. 2). Together, these data suggest high relatedness among the analyzed cells, which cluster within a Ca. Scalindua clade distributed widely across diverse AMZs.
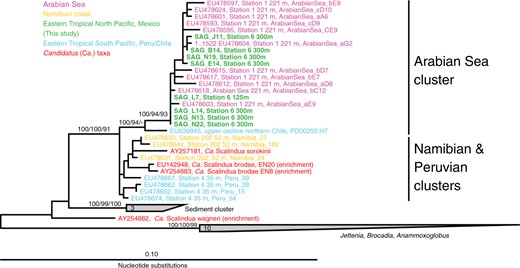
16S rRNA gene-based phylogenetic placement of 8 ETNP Ca. Scalindua-related SAGs from two anoxic depths in the ETNP AMZ. Full length (>1500 bp) 16S rRNA genes were identified in SAGs using RNAmmer, and characterized phylogentically relative to database sequences. The phylogeny was estimated using maximum likelihood in ARB with boot strap values based on Neighbor joining, maximum likelihood, and maximum parsimony using 1000, 100, and 1000 boot-strap re-samplings, respectively. Maximum likelihood support values are based on approximate likelihood Bayesian ratios (‘abayes’)
Protein-coding genes in the SAGs, hereafter referred to as ETNP Ca. Scalindua, were compared against a database of amino acid sequences from all available anammox-associated genomes. Genes diagnostic of the anammox process encoding hydrazine synthase (HZS), hydrazine oxidase/dehydrogenase (HZO), and cd1 nitrite:nitric oxide oxidoreductase (NirS) were found in 5, 8, and 6 of the 20 SAGs, respectively (Table 1), confirming the metabolic role of these bacteria. Genes encoding octahaem hydroxylamine oxidoreductases (HAO) and ammonium transporters (Amt), both of which are observed in multiple copies in anammox genomes, were identified in 16 and 15 of the SAGs, respectively. Amino acid sequences of HZS, HZO, NirS, HAO, and two of the three Amt proteins displayed highest scoring matches to homologs from other anammox bacteria when queried (BLASTP) against the NCBI nr database. Together, the recovery of multiple genes of anammox central metabolism and the shared ancestry of these genes with other Brocadiales identifies the SAGs as members of the AMZ anammox community.
Comparative analyses revealed 1811 non-redundant genes (out of 14,610 total (redundant/non-redundant) across the SAGs) that did not have a significant (bit score >50, BLASTP) match to a protein sequence in the custom database, and therefore may be unique to the ETNP Ca. Scalindua group. This “unique” gene set is dominated by uncharacterized hypothetical proteins (1569 of 1811, 86%), consistent with high proportions of uncharacterized lineage-specific genes in other anammox genomes [19]. A total of 206 non-redundant proteins displayed significant matches to the COG database via BLASTP, while 36 displayed an identifiable protein domain structure but did not display significant similarity to the COG database (Table S2).
Of the unique classifiable sequences, we focused on those that allowed us to explore the hypothesis of alternative nitrogen substrate use. In contrast to all characterized genomes of anammox bacteria, ETNP Ca. Scalindua SAGs contain genes for hydrolysis and transport of urea (Table 1, Fig. 3a). In three SAGs (G15, M13, N19), we identified contigs containing ureC encoding the alpha subunit of urease, the nickel (Ni)-containing enzyme that facilitates cleavage of urea into ammonia and carbamate [60], with the carbamate then spontaneously forming ammonia and carbon dioxide. The ETNP Ca. Scalindua ureC encodes conserved catalytic site residues present in enzymatically verified UreC of urease-positive bacteria (Fig. S4) and is directly downstream of genes for the non-catalytic gamma and beta urease subunits and directly upstream of genes encoding urease accessory proteins UreEFG required for assembly and activation of the apoprotein (Fig. 3). This gene order is nearly identical to that observed in enzymatically verified urease-positive bacteria (e.g., Proteus mirabilis; [61]. Studies using ure knockout mutants indicate that UreE is likely the Ni donor, while UreF and UreG are chaperones enabling Ni donation from UreE [60]. The ureD gene, which encodes a fourth subunit whose function is unclear but is required for urease assembly in P. mirabilis, was identified downstream of ureG on one of the ureC-containing contigs, and on separate, smaller contigs in other SAGs. Genes encoding high affinity ABC-type urea transporters (urtCDE, Fig. 3) are also present on the ure-containing contigs of SAGs N19 and M13. The urease-associated genes (ure and urt) show ≥98% ANI among SAGs, with the vast majority of mutations at the third codon position. The sequences from one SAG (G15) are nearly identical to those from an assembled metagenome contig from the AMZ core (JGI Scaffold in Fig. 3a), confirming the presence of these genes in community data from the site. However, SAG-affiliated ure genes (ureC) were at low proportional abundance (1 of 42, ~3%) in the total pool of ure genes present in the metagenome (Table S3). Overall, the dominant ureC variants were most closely related (based on BLASTX) to those of an alphaproteobacterium (Sphingorhabdus flavimaris; 24 of 42 ureC fragments), suggesting that other organisms in the OMZ may compete with ETNP Ca. Scalindua for urea.
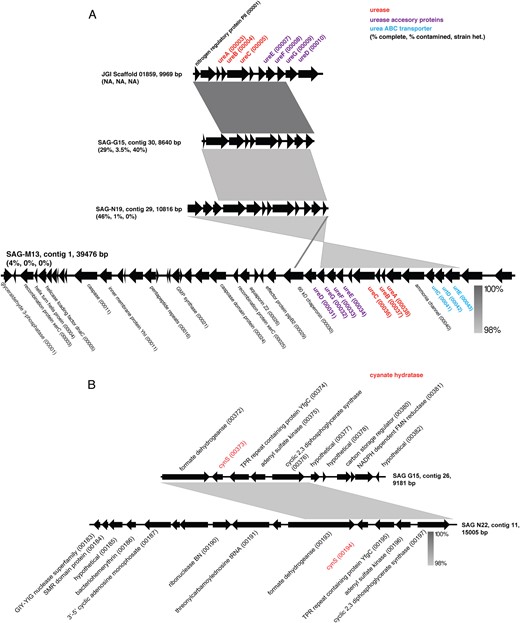
Gene order and synteny of putative urease (a) and cyanase (b)-encoding contigs identified in SAGs and a metagenomic assembly (JGI Scaffold). Gray shading indicates nucleotide similarity based on BLASTN using the default settings in EasyFig
UreC of ETNP Ca. Scalindua does not display a close phylogenetic affiliation with that of other lithotrophic organisms, including the ammonia-oxidizing Thaumarchaea and nitrite-oxidizing bacteria (e.g., Nitrospira). Rather, Ca. Scalindua UreC is most closely related (70% AAI) to UreC of a facultatively anaerobic marine Bacteroidetes bacterium (Raineyella antarctica; [62]) (Fig. 4a, S4). None of the urease-encoding contigs recovered from the SAGs contain marker genes typically used to assess phylogenies (e.g., 16S rRNA gene). However, the largest of these contigs (contig 1 from SAG M13; Fig. 3a) contains a gene encoding the glycolysis protein glyceraldehyde 3-phosphate dehydrogenase (GspA). GspA is conserved among representative genomes from most anammox genera, and phylogenetic analysis placed the M13 GspA in a highly supported clade with that of other Brocadiales, including other Ca. Scalindua species (Fig. S5). Several other genes on this contig also display highest similarity (BLASTP) to anammox-associated Brocadiales. These include two genes encoding XerC, an enzyme mediating site-specific recombination, a process potentially associated with horizontal gene transfer. Tandem repeat sequences, which are often affiliated with recombination, were identified on this contig in five protein-coding genes, all >1000 bp from the ure genes. Taken together, these data link a potential for urea utilization to ETNP Ca. Scalindua and, given the absence of these genes from other Ca. Scalindua species, raise the possibility that this function was acquired horizontally from a non-anammox organism. The potential for horizontal transfer is supported by the high ANI (≥98%) among ure genes from different SAGs, potentially reflecting recent transfer or strong selection pressure.
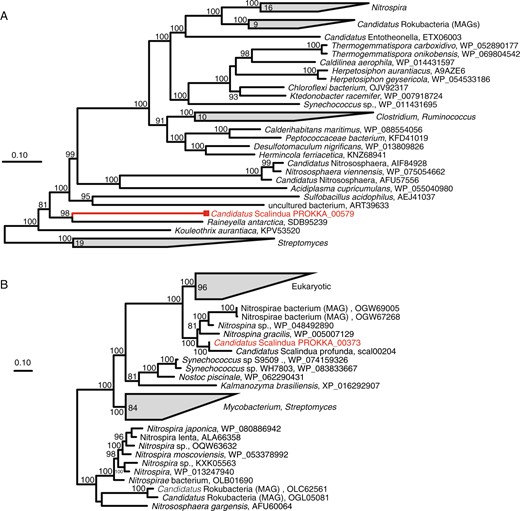
Maximum likelihood-based phylogeny of the ureC gene encoding the urease alpha subunit (a) and the cynS gene encoding cyanase (b). Representative sequences recovered from ETNP Ca. Scalindua SAGs are highlighted in red, relative to homologs identified as best matches in BLASTP queries of the SAG sequences against the NCBI nr database (black). For both trees, support values are based on approximate likelihood Bayesian ratios (‘abayes’), and trees were constructed using the maximum likelihood method
The SAG data also support the hypothesis, proposed by Babbin et al. [28], that Ca. Scalindua in AMZs can use cyanate as an ammonium source. Five of the SAGs (Table 1) contain the cynS gene putatively encoding cyanate hydratase (cyanase). Cyanases cleave cyanate to carbamate (H2NCOO−) and carbon dioxide and occur in diverse non-anammox bacterial and eukaryotic lineages [63–65], as cyanate is a common by-product of urea degradation and amino acid metabolism. The SAG cynS sequences share 94.5–98.9% ANI and, in two of the SAGs, are present on >9 kbp contigs with conserved synteny (Fig. 3b). The SAG cynS is most closely affiliated (82% AAI) with that of the only other cynS sequence linked to an anammox bacterium, Ca. Scalindua profunda from sediment. Both Ca. Scalindua CynS sequences cluster in a monophyletic clade with those of aerobic nitrite-oxidizing bacteria (Nitrospina) common in the oxycline of AMZ regions (Fig. 4b) [66, 67]. These SAG results link CynS to Ca. Scalindua in AMZs, supporting the work of Babbin et al. [28] showing that cyanate stimulates AMZ anammox.
Transcription of alternative nitrogen acquisition pathways by ETNP Ca. Scalindua
Metatranscriptomics confirmed the activity of key genes of Ca. Scalindua nitrogen-based energy metabolism (Tables S4–S6). We first estimated ETNP Ca. Scalindua’s contribution to community transcription by querying metatranscriptome datasets from 5 ETNP sites and multiple depths against a composite SAG amino acid database using a match threshold of >95% AAI (above the average between-SAG AAI of 85%). The composite database contained sequences from 6 of the most complete SAGs, representing an estimated ~90% of all homologs shared among the SAG set. This analysis showed that the representation of ETNP Ca. Scalindua transcripts increased dramatically from the base of the oxycline into the AMZ (Fig. 1b, e, h, S2), likely due to an increase in the number of Ca. Scalindua bacteria along this gradient [5]. This is consistent with the increase in anammox rates into the AMZ, although the depth of highest transcript representation was below that of highest rates and below the nitrite maximum (Fig. 1c-d).
Transcripts encoding the putative urease and cyanase of ETNP Ca. Scalindua were detected throughout the study area, increasing in representation with depth in a pattern roughly paralleling that of the total ETNP Ca. Scalindua transcript pool (Fig. 1c, f, i, S2). An analysis of metatranscriptome data from the AMZ core (200 m) at station 6 indicated that over half of all detected ureC transcripts in the AMZ community were most similar to those recovered on ETNP Ca. Scalindua SAGs (Table S6). Transcripts encoding ABC-type urea transporters (Urt) were also detected (Tables S4 and S5), peaking in proportional representation at 200 meters at Station 6 where urease transcripts were also most abundant (data not shown). In general, urease transcripts were less common than cyanase transcripts. Indeed, cyanases were among the top 40 most transcribed Ca. Scalindua genes at stations with high anammox rates (e.g., station 6 T, Fig. S6). However, both urease and cyanase transcripts were far less abundant than those encoding genes diagnostic of anammox, mainly HZS and HZO, which were commonly among the top 5 most transcribed ETNP Ca. Scalindua proteins (Figures S6 and S7). CO2 fixation in anammox bacteria occurs through the Wood-Ljungdahl pathway, with electrons donated from the oxidation of nitrite to nitrate. Genes diagnostic of this pathway and of nitrite oxidation, notably acsA encoding acetyl coA synthase and narG encoding nitrate/nitrite oxidoreductase respectively, were consistently observed among the Ca. Scalindua transcripts, albeit at low levels (Fig. S7).
The transcript data also provide insight into the importance of other nitrogen-containing compounds in AMZ anammox. Nitric oxide (NO) is a key intermediate in anammox, having been shown in Ca. Kuenenia stuttgartiensis to be condensed with ammonium to form hydrazine [68]. Under non-limiting nitrogen conditions in batch reactors, NirS-type cytochrome cd-1 containing nitrite reductase is implicated as the major route to NO and is among the most highly expressed proteins [68, 69]. However, while we identified NirS homologs in the SAGs, NirS transcripts were far less abundant than those encoding other anammox proteins, such as HZS and HZO (Figs. 5 and S7). A similar result was observed in a prior study that used the Ca. S. profunda genome to recruit metatranscriptome data from the ETSP AMZ [17]. Interestingly, biochemical investigations of octahaem cytochrome c-containing hydroxylamine/hydrazine oxidoreductase (OCC-HAO) proteins from Ca. Kuenenia stuttgartiensis revealed that one protein (kustc1061) produced NO through the oxidation of hydroxylamine [70]. This protein belongs to a subclade of OCC-HAO proteins named “HZO cluster 2a” and is phylogenetically distinguishable from other OCC-HAO/HZO homologs [71]. ETNP SAGs also contain a homolog belonging to HZO cluster 2a (B14_Prokka_00643 in Fig. 5a) and transcripts encoding this protein were consistently more abundant (up to 10–50 times) than those encoding NirS (Fig. 5c). A second HAO homolog, belonging to “cluster 3”, has also been predicted to produce NO from nitrite, although this function is not experimentally verified. This homolog (B14_00071 in Fig. 5) was detected in the SAGs and transcribed at a level comparable to that of “HZO cluster 2a” (Fig. 5c). Interestingly, recent work on an anammox bacterium from activated sludge (Ca. Brocadia sinica) demonstrated that in the absence of canonical enzymes of NO production (nirS, nirK), nitrite was reduced to hydroxylamine, potentially by an OCC-HAO protein (although this remains untested), and the resulting hydroxylamine was coupled with ammonium for hydrazine and ultimately N2 production [72]. Our results raise the possibility that hydroxylamine is also a critical intermediate in anammox bacteria from open ocean AMZs. However, the exact role of this substrate and that of associated OCC-HAO proteins in both NO-dependent and independent pathways of ETNP Ca. Scalindua remains speculative.
![Phylogeny and transcription of genes potentially mediating nitric oxide formation in anammox. a Octahem cytochrome c hydroxylamine/hydrazine oxidoreductase (HAO/HZO) phylogeny. Clade nomenclatures are based on a previous phylogenetic assessment of HAO/HZO proteins [71]. Clades with an asterisk indicate subgroups that are new based on the current work. b Cytochrome cd-1 containing nitrite reductase (NirS) phylogeny. Both trees were constructed using maximum likelihood, with support values based on approximate likelihood Bayesian ratios (“abayes”). c Proportional abundance of transcripts encoding the hypothesized hydrazine-oxidizing HZO (Panels 1, 4, 7), the hypothesized nitrite-reducing HAO (Panels 2, 5, 8), and the hydroxylamine oxidizing/NO forming HAO and cytochrome cd-1 containing NirS (panels 3, 6, and 9) at ETNP stations 6 (top row), 7 (middle row), and 3 (bottom row). All scales display activity in kbp/Mbp sequenced](https://oup.silverchair-cdn.com/oup/backfile/Content_public/Journal/ismej/12/11/10.1038_s41396-018-0223-9/2/m_41396_2018_223_fig5_html.jpeg?Expires=1750188579&Signature=bu0cLh8W~BQqRwcumnEWkf~Jlj1l5JqHllst2dM5eErezKVwY7IM2A1RJ-vBA0RxpiG4C4NDtIOwHKQ0z2dcMtN3gSuQSzxksojOkHtTrmTA3Pl48F-6XkVSi34rQlqPecaqmCrpRW6ct3ydymjoYH7RCDlctpeXzZqM7QnCvF-dqJ09oKmXq6F2MRwUPp7CF-2isNTYd7p0DUDoy5kJJU7MZN1Ss-lSayjO3CZYQFRe~QmTk1LPaboSa3ZR5hbPArAEpX6FXdVPeGY5XYPBoknVnOpLgjl4BphXTpxBnuewtxXA-OfAlUlSNto~CPKeE1rrwogvn7yxzUDRzXWfsg__&Key-Pair-Id=APKAIE5G5CRDK6RD3PGA)
Phylogeny and transcription of genes potentially mediating nitric oxide formation in anammox. a Octahem cytochrome c hydroxylamine/hydrazine oxidoreductase (HAO/HZO) phylogeny. Clade nomenclatures are based on a previous phylogenetic assessment of HAO/HZO proteins [71]. Clades with an asterisk indicate subgroups that are new based on the current work. b Cytochrome cd-1 containing nitrite reductase (NirS) phylogeny. Both trees were constructed using maximum likelihood, with support values based on approximate likelihood Bayesian ratios (“abayes”). c Proportional abundance of transcripts encoding the hypothesized hydrazine-oxidizing HZO (Panels 1, 4, 7), the hypothesized nitrite-reducing HAO (Panels 2, 5, 8), and the hydroxylamine oxidizing/NO forming HAO and cytochrome cd-1 containing NirS (panels 3, 6, and 9) at ETNP stations 6 (top row), 7 (middle row), and 3 (bottom row). All scales display activity in kbp/Mbp sequenced
Evidence for alternative nitrogen use pathways by anammox bacteria in other AMZs
We screened other AMZ datasets to determine if the potential for urea and cyanase use by anammox bacteria is widespread (Table 2). All screened AMZ datasets contain high numbers of sequences matching (>95% AAI) genes in our composite SAG database (data not shown). Of these, sequences closely related to the urease and cyanase-encoding genes from ETNP Ca. Scalindua were identified in metagenomes and metatranscriptomes from the ETSP AMZ off Chile. These genes were not detected in the ETSP oxycline (Table 2), consistent with the low abundance of Ca. Scalindua at non-AMZ depths in this region [73]. ETNP Ca. Scalindua-like urease genes were also detected in a metagenome from the core of the Arabian Sea AMZ [20], although cyanase genes were not found in this dataset. Close relatives of urease and cyanase genes were not detected in a metatranscriptome from a seasonally anoxic coastal AMZ in Saanich Inlet. These results suggest that the potential for urea and cyanate use for anammox exists in some AMZs, including the major AMZs of the ETSP and Arabian Sea where high anammox rates have been recorded [46, 74, 75]. Also, the failure to detect these genes in some sites (e.g., Saanich Inlet) is not definitive evidence of their absence, as several factors may preclude detection, including the depth of sequence coverage, the proportional abundance of anammox-cells, variability in the timing and depths of sample collection, and potential sequence divergence across systems. Further genomic analyses of anammox populations across systems, and perhaps at finer spatial and temporal scales of resolution, will help identify the evolutionary and environmental controls determining the distribution of urease and cyanase genes in marine anammox bacteria.
Conclusions
This study provides evidence that anammox bacteria have the potential to degrade both urea and cyanate. At this time, however, it is not possible to determine the exact biochemical role that ureases and cyanases play in ETNP Ca. Scalindua. It is possible that the ammonium liberated by these enzymes is used as an energy substrate for anammox, and therefore contributes to nitrogen loss through N2 production. Alternatively, it is possible that these enzymes serve other functions. Urea and cyanate are common products of protein degradation, and high intracellular concentrations of these substrates may be detrimental to cellular processes. Ureases and cyanases may therefore serve in detoxification, or potentially to cycle ammonium into anabolic pathways. Thus, these enzymes may play a role in the biological retention or recycling, rather than loss, of valuable nitrogen. However, the detection and transcription of urea transporter genes indicates that ETNP Ca. Scalindua likely consumes this organic substrate from the environment, suggesting that urease activity in this organism is not linked exclusively to nitrogen recycling. Furthermore, even recycling will decrease the assimilatory demand for exogenous ammonium and thereby indirectly increase its availability for dinitrogen production.
The consumption of organic nitrogen by aerobic ammonia-oxidizing microorganisms has gained much attention, notably as urease potential occurs in ubiquitous ammonia-oxidizing Thaumarchaeota [76]. Aerobic nitrite-oxidizing bacteria of the genus Nitrospira have also been shown to produce ammonia from urea, thereby sustaining co-occurring ammonia-oxidizers that provide nitrite to Nitrospira [26]. However, the contribution of urea to anaerobic pathways of lithotrophic ammonium consumption remains unclear. Indeed, these results are the first report of urease genes in any anammox-capable lineage. Furthermore, while cyanase genes had been reported in anammox bacteria from non-AMZ environments and cyanate shown to support anammox activity in AMZs [28], cyanase genes had not yet been definitively linked to genomes of AMZ anammox bacteria, for example by being found co-localized on a metagenome contig with definitive Ca. Scalindua signatures, or in a genome from a Ca. Scalindua cell/culture. The extent to which ammonium limitation in AMZs selects for organic nitrogen consumption by anammox bacteria remains uncertain, although our results suggest that urea and cyanate use may occur in populations from different AMZs.
Overall, the results expand our knowledge about the metabolic capacity of anammox bacteria and predict mechanisms by which these widespread organisms might supplement direct consumption of free ammonium. Few urea and cyanate measurements have been made for AMZs and data from other regions suggest that concentrations rarely exceed nanomolar levels in the open ocean [77, 78]. While urea and cyanate concentrations were not comprehensively surveyed in this study, our preliminary measurements, coupled with previous measurements of cyanate in Eastern Pacific AMZs [78, 79], suggest levels comparable (urea) or likely lower (cyanate) than those of ammonium. However, it is possible that turnover of these substrates is rapid, particularly at times or depths of lower ammonium levels. Counts of cyanase transcripts in this study were higher than those for urease, suggesting a potential greater role for cyanate as an alternative ammonium source. We caution, however, that the transcript data provide no temporal resolution and may be a poor proxy for actual substrate turnover. Indeed, our knowledge of the temporal variability in AMZ inorganic and organic substrate availability, and in rates of coupled microbial metabolisms, remains limited. Our data suggest only that the potential for direct cyanate and urease use exists for AMZ anammox bacteria. Future experiments should assess the environmental conditions that constrain the use of different ammonium sources. Such experiments should also determine what proportion of the urea and cyanate pools consumed by anammox bacteria are indeed lost through anammox, versus lost through detoxification or incorporation into new biomass. Urea and cyanate have gathered increasing attention within the context of aerobic nitrification, and recent data have indicated that marine populations of aerobic nitrifiers can oxidize ammonia at vanishingly low oxygen levels (nM) that are well within the range under which anammox occurs [80]. Thus, an important question becomes to what extent periodic oxygenation of the anoxic core, and shoaling of the oxycline, change the dynamics of thaumarchaeal ammonium consumption and anammox, and the extent that use of alternative substrates by either group is stimulated or inhibited by these events. Resolving such questions may improve models estimating the role of diverse nitrogen consumption pathways in bulk nitrogen and carbon budgets under AMZ expansion, providing refinements for global marine nutrient cycling.
Acknowledgements
This work was supported by the National Science Foundation (1151698, 1558916, 1564559 to FJS and 1416673 to KTK), a European Research Council Advanced grant (OXYGEN, 267233 to BT), the Danish National Research Foundation (DNRF53 to BT), a Community Science Program grant from the U.S. Department of Energy (to FJS and KTK), and the Millennium Science Initiative (IC 120019) and Chilean National Scientific and Technological Research Fund (1161483, supporting MA and OU). The work conducted by the DOE Joint Genome Institute, a DOE Office of Science User Facility, is supported under Contract No. DE-AC02-05CH11231. We are grateful to Neha Sarode for help in sequencing analysis, Philipp Hach for help with sample collection, and the captain and crew of the R/V New Horizon for enabling sample collection.
Compliance with ethical standards
Conflict of interest
The authors declare that they have no conflict of interest.
References
Electronic supplementary material The online version of this article (https://doi.org/10.1038/s41396-018-0223-9) contains supplementary material, which is available to authorized users.
Author notes
These authors contributed equally: Sangita Ganesh, Anthony D. Bertagnolli.
