


Abstract
Little is known about the influence that hospital quality systems have on quality at department level, in Australia and elsewhere. This study assessed the relationships between organizational-level quality management systems, and the extent to which hospital-level quality management systems and department-level quality management strategies are related.
A multi-level, cross-sectional, mixed-method study.
As part of the Deepening our Understanding of Quality in Australia (DUQuA) project, we invited all large hospitals in Australia (~200 or more beds) which provided acute myocardial infarction (AMI), hip fracture and stroke care. The quality managers of these hospitals were the respondents for one of seven measures of hospital quality management systems and strategies. Data across the six remaining measures were collected through site visits by external surveyors assessing the participating hospitals.
Relationships were assessed between three organization-level quality management system measures: a self-report measure assessing organization-level quality activities (quality management systems index, QMSI); externally assessed organization-level compliance to procedures used to plan, monitor and improve quality of care (quality management compliance index, QMCI); and externally assessed implementation of quality systems (clinical quality implementation index, CQII). Associations were also assessed between organization-level quality management systems and department-level quality management strategies: how clinical responsibilities are assigned for a particular condition; whether department organization processes are organized to facilitate evidence-based care recommendations; compliance with selected recommendations of international agencies; and whether clinical reviews are performed systematically.
Of 78 invited hospitals, 32 participated in the study. QMSI was positively associated with QMCI and CQII, but after controlling for QMSI, no relationship was found between QMCI and CQII. There appears to be a cluster of relationships between QMSI and department-level measures, but this was not consistent across all departments.
This is the first national study undertaken in Australia to assess relationships within and between organization-level and department-level quality management systems. These quality management system tools align with many components of accreditation standards and may be useful for hospitals in continuously monitoring and driving improvement.
Introduction
Requirements to demonstrate hospital service quality have increased nationally and internationally in recent decades due to increased societal attention, a multiplicity of government policies, and the introduction of mandatory hospital accreditation [1–5]. The necessity for quality strategies to be embedded throughout hospitals has led to numerous efforts to develop reliable ways to measure quality management systems at organization and department levels [6–10]. Less is known, however, about the influence that hospital-level quality (e.g. infrastructure, quality improvement processes) has on department-level quality (e.g. organization of department processes, approaches to patient safety). Understanding these relationships is crucial because, for example, it may help us determine whether efforts to improve department-level quality management systems also require investments in improving organization-level quality systems (e.g. governance board quality, quality management, performance monitoring activities) [11, 12]. Similarly, if the emphasis is on ensuring organization-level quality but commitment, responsibility and engagement is not embedded at the department level, we may find lower quality healthcare delivery, patient safety incidents, or worse outcomes for patients [12–14]. If we can pinpoint how organization and department-level performance are related (and beyond this, the links to patient outcomes, as assessed in other reports in this Supplement), this may uncover key areas to focus targeted interventions to raise the standards of quality and safety [15].
Recent work has been undertaken in Europe to explore, using validated measures to gather both internal and external perspectives, relationships among different elements of quality management systems both within and between organization and department levels of hospitals [9, 10, 16]. The Deepening our Understanding of Quality Improvement in Europe (DUQuE) study concluded that, across 77 hospitals in seven countries, it is possible to obtain a comprehensive picture of hospital quality management maturity, incorporating different administrative levels within the hospital, across several hospital departments (acute myocardial infarction [AMI], hip fracture and stroke) [15]. An assessment of the relationships between quality management systems within and between organization and department levels of hospitals has not yet been undertaken in Australia, and rarely elsewhere. Therefore, the aims of this study are to assess: (i) the relationships between organization-level quality systems including the quality management systems index (QMSI), quality compliance and improvement (quality management compliance index [QMCI]) and implementation of clinical quality activities (quality management compliance index [CQII]), and (ii) the extent to which hospital-level quality management systems, and department-level quality management strategies are related across a sample of hospital departments.
Methods
A protocol for the full study has been published [17], and some additional details (e.g. actual recruitment) have already been described in other papers in this Supplement [18–20]; here we provide a summary of the methods relevant to this sub-study, which focuses on three organization-level quality management systems and four department-level quality management strategies, including changes from the published protocol. The seven measures were initially developed for the DUQuE study and adapted and validated by Deepening our Understanding of Quality in Australia (DUQuA) to ensure relevance to the targeted Australian hospitals. Figure 1 shows the relationships between organization and department-level measures in the DUQuA study. These measure levels are described below.
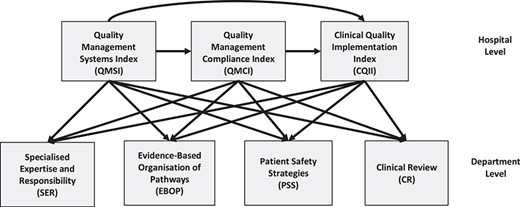
Simplified directed acyclic graph (DAG) showing the relationships between organization-level and department-level measures in DUQuA
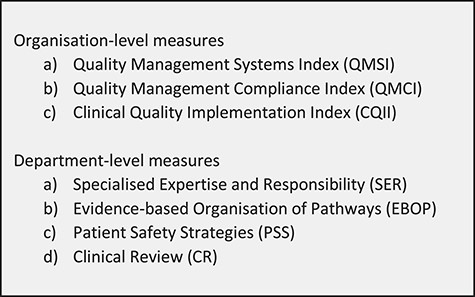
DUQuA organization and department-level measures list
Setting, participants, recruitment and data collection
The study population comprised 78 Australian public hospitals meeting the DUQuA hospital inclusion criteria (~200 beds or more with an ED and 10 or more admissions per month for each of AMI, hip fracture and stroke) [17]. All were invited and 32 received ethics approval and participated.
The senior hospital quality manager at each hospital, or equivalent role-holder, completed an organization-level survey (QMSI) and coordinated with the research team for external surveyors to conduct an on-site assessment for two organization-level quality management systems and four department-level measures of quality management strategies. The hospital quality manager did not receive special training; external surveyors, all experienced hospital evaluators, received research-specific training as detailed in Supplementary Appendix A. All measures are listed in Figure 2 and summarized in Table 1, with an indication of how data was collected. Where the measure is a scale comprising subscales, the subscales are listed in the table.
Organization-level measures
Organization-level quality management systems were assessed using three measures: the QMSI, the QMCI and the CQII. Each of these measures, validated as part of the DUQuE project, was adapted for Australian conditions and validated in its revised form [19]. Full validation properties can be found for these measures in measures in the Supplement [19].
QMSI. This is a measure of the management system aspects of quality that might influence the implementation of quality systems in hospitals. Fifty one questions in the QMSI are used to generate eight quality subscales including quality policy, hospital governance board activities, quality resources, quality management, preventive protocols, performance monitoring and internal quality methods (separately for general activities and patients) [19]. The questionnaire is designed as a four-point Likert scale (range 1–4) for each item, with scores of 4 representing more comprehensive systems. While questionnaire completion represents self-assessment, the classifications required were considered objective, and thus unlikely to be unduly biased by self-assessment. Seven out of eight QMSI subscales achieved adequate internal consistency (Cronbach’s α > 0.8) during validation.
QMCI. This is a measure of compliance with procedures used to plan, monitor and improve quality of care. The QMCI comprises 11 questions each assessed on a five-point Likert scale (range 0–4), with higher scores reflecting more comprehensive approaches to compliance; scores are used to create two subscales: monitoring of patient and professional opinions; and quality control and monitoring. Assessments are completed during on-site audits completed by trained external surveyors who review and verify relevant evidence of compliance. Adequate internal consistency (Cronbach’s α > 0.8) was achieved when validating both QMCI subscales.
CQII. This is a measure of evidence of implementation of quality systems at hospital level; including whether systems exist, to what extent implementation has been monitored, and whether implementation is sustainable. The index is based on the results of an on-site audit completed by trained external surveyors, who score each of 35 questions on five-point Likert scales (0–4), with higher scores representing more comprehensive implementation. Seven domains were selected, each producing a separate subscale score: preventing and controlling healthcare associated infections, medication safety, preventing patient falls, preventing pressure injuries, routine assessment and diagnostic testing of patients in elective surgery, safe surgery that includes an approved checklist, recognizing and responding to clinical deterioration in acute healthcare. The surveyors assessed the presence of an active committee for the domain, relevant policy or guidelines and monitoring of compliance, sustainability of the system and the adoption of an improvement focus. Lack of variation and ceiling effects in the data resulted in very low internal consistency scores for CQII, but items were retained for theoretical reasons.
Department-level measures
Four DUQuE measures were refined, and structure and validity tested, to assess department-level quality activities in Australian hospitals: (i) Specialized Expertise and Responsibility (SER) assessed how clinical responsibilities were assigned for a particular condition; (ii) Evidence-Based Organization and Pathways (EBOP) measured if department organization processes, such as admission, acute care, rehabilitation and discharge, were organized to facilitate evidence-based care recommendations; (iii) Patient Safety Strategies (PSS) measured compliance with selected general clinical practice guidelines and (iv) Clinical Review (CR) measured if CRs were performed systematically.
SER, CR and PSS measures were identical for the three conditions, and the EBOP has the same structure for each condition-specific department (AMI, hip fracture and stroke), however the content followed the evidence recommendations specific to each condition. Each of the four indices was scored on a five-point Likert scale (0–4), with higher ratings indicating greater compliance. In line with the experience and advice of the DUQuE research consortium, the four assessments were expected to be completed by surveyors during one- to two-day external on-site assessments.
DUQuA organizational and department-level measures, data collection methods and its format
| Measures | Content | Data collection methods | Format |
|---|---|---|---|
| Organization-level measures | |||
| QMSI | Eight subscales: Quality policy; Hospital governance board activities; Quality resources; Quality management; Preventive protocols; Internal quality methods for general activities; Performance monitoring; Internal quality methods for patients | Self-report questionnaire completed by the hospital’s Quality Manager or equivalent | Paper-based questionnaire |
| QMCI | Two subscales: Monitoring patient and professional opinions; Quality control and monitoring | External quality assessment by trained healthcare surveyors (site | Paper-based audit forms filled |
| CQII | Seven subscales: Preventing and controlling healthcare associated infections; Medication safety; Preventing patient falls; Preventing pressure injuries; Routine assessment and diagnostic testing of patients in elective surgery; Safe surgery that includes an approved checklist; Recognizing and responding to clinical deterioration in acute health care | visit) | by surveyors |
| Department-level measures (separately for inpatient departments responsible for AMI, hip fracture and stroke) | |||
| SER | Assignment of clinical responsibilities for a condition | External quality assessment by | Paper-based |
| EBOP | Organization of department processes (admission, acute care and discharge to facilitate evidence-based care recommendations) | trained healthcare surveyors (site visit) | audit forms filled by surveyors |
| PSS | Use of international consensus-based patient safety recommendations | ||
| CR | Integration of audit and systematic monitoring in departmental quality management mechanisms | ||
Statistical analysis
A directed acyclic graph (DAG), a simplified version of which is shown in Figure 1, presents assumed causal relations among variables and thereby determines which confounding variables are included in the statistical models. For example, to examine whether QMCI has an effect on SER, we controlled for QMSI because it is a predictor for both QMCI and SER.
Data were analysed in SAS/STAT software version 9.4 (SAS Institute, Cary, North Carolina, USA). Each organization scale was calculated as the sum of all subscales (for QMSI, 8 was subtracted from the sum, in line with DUQuE procedures) [9]; each subscale was the mean of all non-missing items; subscales with more than 50% missing items were treated as missing, and a value was subsequently imputed. For department scales, each scale was the mean of all applicable non-missing items; scales with more than 50% applicable items missing were treated as missing.
Visual inspection of missing data patterns in the organization-level suggested that data was missing at random. Multiple imputations were, therefore, performed (MI procedure) for the missing organization subscales, repeated 100 times, and scale scores were calculated after imputation. Each imputed dataset was merged with department-level data and general linear models were used to examine the associations between measures as specified in the simplified DAG model in Figure 1, with hospital peer group (referral/acute) also controlled for. Analysis was performed on each imputed dataset and pooled parameter estimates and standard errors were derived, if any imputed values were involved in the calculations.
Results
Participating hospitals over-represent principal referral hospitals and hospitals with over 500 beds and under-represent inner regional remoteness areas and the state of Western Australia (see Appendix B, Supplementary eTable B1). Hospital-level measures were collected from all 32 hospitals; two hospitals shared a single quality management system and governance, so only 31 questionnaires were collected for the QMSI. Missing data for the organization scales ranged from 0% to 3.1% at subscale level. There were 87 department-level measures expected (by condition: 27 AMI, 31 hip fractures and 29 strokes).
Descriptive statistics of the three hospital-level measures, after imputation, are detailed in Table 2, for the overall scale and each component subscale. The mean QMSI score was 19.4 (standard deviation [SD]: 3.1) out of maximum possible of 24; the mean QMCI was 7.1 (SD: 1.3) out of 8; and the mean CQII was 25.1 (SD: 2.9) out of 28. All subscales were rated at three or above with one exception: the CQII subscale for ‘Routine assessment and diagnostic testing of patients in elective surgery’ had a mean score of 2.3. The median hospital score was the maximum (i.e. 4.0) for one of eight QMSI subscales and for six of seven CQII subscales. All subscales had standard deviations less than one with the exception of two CQII subscales one of which had an out-of-range value, above four, imputed.
Descriptive statistics for hospital-level measuresa
| Index | n | Mean | SD | Median | Min | Maxb | IQR |
|---|---|---|---|---|---|---|---|
| QMSI | 31 | 19.4 | 3.14 | 20.3 | 10.1 | 23.9 | 3.9 |
| Quality policy | 31 | 3.2 | 0.89 | 3.3 | 1.3 | 4.0 | 1.0 |
| Hospital governance: board activities | 31 | 3.4 | 0.52 | 3.6 | 2.0 | 4.0 | 0.8 |
| Quality resources | 31 | 3.4 | 0.36 | 3.3 | 2.4 | 4.0 | 0.4 |
| Quality management | 31 | 3.5 | 0.48 | 3.7 | 2.0 | 4.0 | 0.7 |
| Preventive protocols | 31 | 3.6 | 0.40 | 3.7 | 2.5 | 4.0 | 0.6 |
| Internal quality methods: general activities | 31 | 3.4 | 0.47 | 3.4 | 2.0 | 4.0 | 0.7 |
| Performance monitoring | 31 | 3.3 | 0.68 | 3.3 | 1.7 | 4.0 | 1.3 |
| Internal quality methods: patients | 31 | 3.7 | 0.42 | 4.0 | 3.0 | 4.0 | 0.5 |
| QMCI | 32 | 7.1 | 1.27 | 7.4 | 1.4 | 8.2 | 0.8 |
| Monitoring patient and professional opinions | 32 | 3.5 | 0.74 | 3.8 | 0.6 | 4.8 | 0.8 |
| Quality control and monitoring | 32 | 3.5 | 0.62 | 3.8 | 0.8 | 4.0 | 0.7 |
| CQII | 32 | 25.1 | 2.85 | 25.6 | 18.8 | 28.0 | 4.3 |
| Preventing and controlling healthcare associated infections | 32 | 3.9 | 0.20 | 4.0 | 3.2 | 4.0 | 0.0 |
| Medication safety | 32 | 3.9 | 0.21 | 4.0 | 3.2 | 4.0 | 0.2 |
| Preventing patient falls | 32 | 3.9 | 0.13 | 4.0 | 3.6 | 4.0 | 0.1 |
| Preventing pressure injuries | 32 | 3.8 | 0.50 | 4.0 | 1.2 | 4.0 | 0.3 |
| Routine assessment and diagnostic testing of patients in elective surgery | 32 | 2.3 | 1.54 | 2.5 | 0.0 | 4.0 | 3.3 |
| Safe surgery that includes an approved checklist | 32 | 3.3 | 1.25 | 4.0 | 0.0 | 5.0 | 1.0 |
| Recognizing and responding to clinical deterioration in acute healthcare | 32 | 3.9 | 0.18 | 4.0 | 3.2 | 4.0 | 0.0 |
aAfter multiple imputation techniques applied to missing data.
bOut-of-range values were retained to ensure accurate calculation of variance when assessing the association between measures [21].
Legend: IQR = inter-quartile range
Results of the associations between organization-level scales are summarized in Table 3. The value of the betas is an artefact of the scoring ranges of the scales used and is not therefore of importance, excepting that the sign signifies a positive or negative association. QMSI was statistically associated with QMCI (P = 0.002) and with CQII (P = 0.003) after adjustment for peer group; more specifically, 1-point increases in QMSI is associated with a 0.20 point increase in QMCI (95% CI: 0.07–0.33), and a 0.45 point increase in CQII (95% CI: 0.16–0.74). There was no association between QMCI and CQII (P = 0.98) after adjustment for QMSI.
Associations between organization-level measures
| QMCI | CQII | |||||
|---|---|---|---|---|---|---|
| Index | n | Beta (95% CI) | P-value | n | Beta (95% CI) | P-value |
| QMSIa | 32 | 0.199 (0.071, 0.327) | 0.002* | 32 | 0.447 (0.155, 0.740) | 0.003* |
| QMCIa,b | 32 | −0.013 (−0.861, 0.834) | 0.975 | |||
| QMCI | CQII | |||||
|---|---|---|---|---|---|---|
| Index | n | Beta (95% CI) | P-value | n | Beta (95% CI) | P-value |
| QMSIa | 32 | 0.199 (0.071, 0.327) | 0.002* | 32 | 0.447 (0.155, 0.740) | 0.003* |
| QMCIa,b | 32 | −0.013 (−0.861, 0.834) | 0.975 | |||
Legend: QMSI (Index 0–24), QMCI (Index 0–8), CQII (Index 0–28).
aAdjusted for hospital peer group; bAdditionally adjusted for QMSI; *Statistically significant at P = 0.05.
Descriptive statistics of the four department-level measures are summarized in Table 4, separately for AMI, hip fracture and stroke. For each of the three condition-specific departments, the mean scale scores ranged from 2.3 to 3.6 with the highest scores were consistently found for the PSS measure (3.4–3.6), and the lowest scores were for the CR measure (2.2–2.9).
Descriptive statistics for department-level measures
| Department | Index | n | Mean | SD | Median | Min | Max | IQR |
|---|---|---|---|---|---|---|---|---|
| AMI | SER | 27 | 2.9 | 0.93 | 2.7 | 0.7 | 4.0 | 1.7 |
| EBOP | 27 | 3.0 | 0.77 | 3.3 | 1.0 | 4.0 | 1.0 | |
| PSS | 27 | 3.6 | 0.34 | 3.6 | 2.9 | 4.0 | 0.6 | |
| CR | 27 | 2.3 | 1.50 | 2.7 | 0.0 | 4.0 | 3.3 | |
| Hip fracture | SER | 29 | 2.5 | 1.16 | 2.7 | 0.3 | 4.0 | 2.0 |
| EBOP | 29 | 2.6 | 1.06 | 2.6 | 0.2 | 4.0 | 1.2 | |
| PSS | 29 | 3.5 | 0.37 | 3.4 | 2.7 | 4.0 | 0.4 | |
| CR | 29 | 2.2 | 1.60 | 2.7 | 0.0 | 4.0 | 3.0 | |
| Stroke | SER | 31 | 3.3 | 0.74 | 3.7 | 1.3 | 4.0 | 1.0 |
| EBOP | 31 | 3.2 | 0.89 | 3.4 | 0.8 | 4.0 | 1.4 | |
| PSS | 31 | 3.4 | 0.33 | 3.3 | 2.6 | 4.0 | 0.5 | |
| CR | 31 | 2.9 | 1.25 | 3.3 | 0.0 | 4.0 | 2.0 |
Legend: IQR = inter-quartile range
Results of the associations are summarized in Table 5. With 36 associations assessed, two associations would be expected to be statistically significant by chance, one each positive and negative. We found five statistically significant positive associations between QMSI and department-level measures: one for SER (stroke); one for EBOP (hip fracture); one for PSS (hip fracture) and two for CR (AMI and stroke). There were no statistically significant associations between QMCI and the four department-level measures, after adjustment for QMSI. There were two statistically significant associations between CQII and the four department-level measures: a negative association with PSS for AMI; and a positive association with CR for hip fracture.
Associations of department-level measures with hospital-level measures
| AMI | Hip fracture | Stroke | ||||||||
|---|---|---|---|---|---|---|---|---|---|---|
| Index | Outcome | n | Beta (95% CI) | P-value | n | Beta (95% CI) | P-value | n | Beta (95% CI) | P-value |
| QMSIa | SER | 27 | −0.023 (−0.137, 0.091) | 0.678 | 29 | 0.051 (−0.097, 0.200) | 0.486 | 31 | 0.090 (0.005, 0.174) | 0.038* |
| EBOP | 27 | −0.032 (−0.131, 0.066) | 0.504 | 29 | 0.120 (0.015, 0.225) | 0.027* | 31 | 0.074 (−0.028, 0.177) | 0.150 | |
| PSS | 27 | 0.033 (−0.009, 0.074) | 0.115 | 29 | 0.049 (0.005, 0.094) | 0.030* | 31 | 0.020 (−0.021, 0.061) | 0.322 | |
| CR | 27 | 0.211 (0.038, 0.384) | 0.019* | 29 | 0.081 (−0.073, 0.235) | 0.289 | 31 | 0.186 (0.047, 0.325) | 0.010* | |
| QMCIa,b | SER | 27 | 0.216 (−0.271, 0.702) | 0.385 | 29 | 0.279 (−0.097, 0.655) | 0.146 | 31 | −0.010 (−0.376, 0.356) | 0.958 |
| EBOP | 27 | 0.269 (−0.145, 0.683) | 0.202 | 29 | −0.005 (−0.282, 0.272) | 0.972 | 31 | −0.092 (−0.537, 0.353) | 0.685 | |
| PSS | 27 | −0.055 (−0.234, 0.123) | 0.544 | 29 | 0.056 (−0.059, 0.170) | 0.340 | 31 | 0.098 (−0.076, 0.272) | 0.271 | |
| CR | 27 | 0.332 (−0.409, 1.072) | 0.380 | 29 | 0.133 (−0.270, 0.536) | 0.517 | 31 | 0.161 (−0.438, 0.759) | 0.599 | |
| CQIIa,b,c | SER | 27 | 0.085 (−0.042, 0.212) | 0.189 | 29 | 0.039 (−0.130, 0.208) | 0.653 | 31 | 0.005 (−0.097, 0.106) | 0.928 |
| EBOP | 27 | 0.044 (−0.067, 0.155) | 0.434 | 29 | 0.042 (−0.082, 0.166) | 0.506 | 31 | 0.024 (−0.098, 0.147) | 0.696 | |
| PSS | 27 | −0.051 (−0.094, −.007) | 0.023* | 29 | 0.026 (−0.025, 0.077) | 0.312 | 31 | 0.018 (−0.029, 0.065) | 0.452 | |
| CR | 27 | 0.171 (−0.015, 0.358) | 0.072 | 29 | 0.183 (0.017, 0.349) | 0.031* | 31 | 0.087 (−0.075, 0.250) | 0.293 | |
Legend: QMSI (Index 0–24), QMCI (Index 0–8), CQII (Index 0–28), SER (Index 0–4), EBOP (Index 0–4), PSS (Index 0–4), CR (Index 0–4).
Adjusted for: ahospital peer group; balso adjusted for QMSI; calso adjusted for QMCI.
*Statistically significant at 5%.
Discussion
To our knowledge, this is the first time the relationship between quality management systems within and between organization and department levels of hospitals has been tested in Australia, and one of only a few internationally. Collecting data from 32 hospitals across five states and two territories, key findings indicate that QMSI (a self-report measure assessing organizational-level quality activities, was positively associated with QMCI and CQII (two measures applied by externally trained surveyors for assessing organizational-level compliance to procedures used to plan, monitor and improve quality of care, and implementation of quality systems), but after controlling for QMSI, no relationship was found between QMCI and CQII. There appears to be a cluster of relationships between QMSI and department-level measures, but this was not consistent across all departments. More specifically, QMSI was associated with how clinical responsibilities are assigned for a particular condition (SER) for stroke, whether department organization processes are organized to facilitate evidence-based care recommendations (EBOP) and compliance with selected recommendations of international agencies (PSS) for hip fracture, and systematic implementation of CR for AMI and stroke. There was no clear evidence of an effect of QMCI or CQII on department-level measures, after adjustment for QMSI.
At the organizational level, in contrast to our findings, DUQuE found positive associations between all three measures [15]. The DUQuE study presented 18 out of 36 significant positive associations between hospital and department-level quality management systems across AMI, hip fracture and stroke: five with QMSI; 11 with QMCI after adjustment for QMSI, and two with CQII after adjusting for both other measures. DUQuA found six positive associations: five with QMSI; none with QMCI (adjusted for QMSI) and one with CQII (adjusted with QMSI and QMCI). The starkest difference between the two studies is in the effect of QMCI (adjusted for QMSI) on the four department-level measures: in DUQuE this is consistent across all but one of 12 department-level measures, while in DUQuA no relationships were found.
There are a number of possible explanations for these differences. First, to ensure the measures were relevant and appropriate for the Australian system, a number of modifications were made for the DUQuA study, including removal of some items pertaining to the assessment of individual staff licences, education, certification, experience and performance reviews, and changes to ensure scale descriptions were explicit. Nonetheless, we have found the measurement properties for all revised measures to be sound [19]. Second, the timeframes for data collection for DUQuE and DUQuA were starkly different. For example, data collection for the entire DUQuE study lasted eight months, whereas—despite the cross-sectional study design intentions—DUQuA data collection took over two years. In DUQuA, the timing on the internally assessed measure (QMSI) and the six externally assessed measures (QMCI, CQII, SER, EBOP, PSS and CR) were not identical; the median timing difference was zero (i.e. same month) but it ranged from QMSI completion 11 months before to eight months after (IQR: 2.5 months before to one month after). As such, changes in personnel, processes and/or resources [22, 23] during this time may have introduced error into the assessment of associations. Third, the DUQuA results are left-skewed in comparison to DUQuE: for QMSI, the mean DUQuA score was 19.4 out of 24 (80.8% of maximum) versus 19.4 out of 27 (71.9%) for DUQuE; for QMCI (DUQuA = 7.1/8 [88.8%] versus DUQuE = 10.4/16 [65.0%]); and CQII (DUQuA = 25.1/28 [89.6%] versus DUQuE = 8.4/14 [60.0%]), the differences are more marked, with the Australian hospitals clustered at higher scores. In Australia, accreditation [24] has been mandatory for all public hospitals since 2013 [25]; importantly, during DUQuE data collection, this was not the case for participating hospitals (of the participating DUQuE hospitals, only 34% were locally accredited) [16]. The extensive preparation that Australian hospitals undergo to ensure systems, processes, and records will meet the accreditation standards prior to assessment (every four years with a biannual shortened assessment) [25] likely reduced the range of index scores for DUQuA, especially for CQII (which contains many accreditation-related features). Finally, hospital sample sizes were smaller in DUQuA (n = 32) than in DUQuE (n = 72).
Assessing our findings in relation to the wider literature, the stronger and more frequent associations between QMSI and other organization and department-level measures align with previously reported quantitative and qualitative findings. For example, the quality of the hospital board and its associated quality activities—a key component of the QMSI measure—has been positively associated with high performing hospitals [26], the likelihood that hospitals have quality improvement programs (a key component of our CQII measure) [12], and better performance on process measures at care pathway level [27, 28]. Furthermore, the provision of adequate resources to departments for quality and use of quality data to drive improvement by senior management and governing boards (two additional components measured by QMSI) have been reported as key attributes of hospital departments with concrete protocols and practices undertaken to reduce mortality among patients [14].
Limitations of this study include non-concurrent internal and external data collection, and a restricted response range to the organization-level indices. Non-concurrent collection derives from problems related to addressing site-specific governance processes across our participating hospitals [29], and difficulties arranging access to hospitals for external surveyors as research data collectors (despite these individuals being trained to collect accreditation data in the same hospitals) [30]. The lack of a broad response range for organization-level indices, especially QMSI and CQII, makes it difficult to differentiate between hospitals and thus explore associations; for countries with universal accreditation, more sensitive indices may need to be developed if we are seeking to examine associations between organization and department-level measures of system maturity. Both of these issues were compounded by the low number of hospitals retained in the study—we targeted 78, 62 initially agreed, and 32 completed the study; the design and test combination was therefore likely underpowered for detecting the hypothetical effect sizes of interest [17].
Despite these limitations, unlike unvalidated accreditation assessment tools, the previously validated quality management system assessment tools refined and revalidated for the Australian healthcare system, allow hospitals to reliably and continuously measure, diagnose, benchmark and drive-targeted improvements for quality at the organization and department levels. The alignment of these tools with the assessment criteria used by accreditation agencies in Australia may help with interim monitoring of performance in preparation for accreditation.
Conclusion
This national study of 32 Australian hospitals has demonstrated relationships within and between organization and department-level quality management systems, the strength of which is most visible for relationships involving organizational-level quality activities (QMSI). Some similarities in relationships were found with the earlier DUQuE study, despite differences in hospital accreditation policy between Australia and Europe. These quality management system tools align with many components of accreditation standards and may be useful for hospitals in continuously monitoring and stimulating improvement.
Acknowledgements
Members of the original DUQuE team (Oliver Gröne, Rosa Suñol) provided extensive input and advice in the initial stages of the project, supporting design modifications from DUQuE and the planned DUQuA study approach. Dr Annette Pantle provided expert advice on revision and development of DUQuA measures, and Professor Sandy Middleton, Associate Professor Dominique Cadillac, Kelvin Hill, Dr Carmel Crock and Professor Jacqueline Close provided input into the development of our AMI, hip fracture and stroke clinical process indicator lists. Nicole Mealing and Victoria Pye provided statistical advice in the initial phases of the project. We greatly appreciate their efforts. Zhicheng Li and Chrissy Clay also organized and coordinated the external site visits at all participating hospitals with all external researchers/assessors (surveyors).
Funding
This research was funded by National Health and Medical Research Council (NHMRC) Program Grant APP1054146 (CI Braithwaite).
Contributions
The research team consists of experienced researchers, clinicians and biostatisticians with expertise in health services research, survey design and validation, large-scale research and project management, sophisticated statistical analysis, quality improvement and assessment, accreditation, clinical indicators, policy and patient experience. JB led the research grant to fund the project. NT led the study design and development of the manuscript. RCW, HPT and GA co-led the study design and contributed to the development of the manuscript. HPT and GA also provided statistical expertise for the study design and developed the analysis plan for the manuscript. TW and EH contributed to the logistics of project management, the refinement of measures and the development of the manuscript.
Data sharing statement
Data will be made publicly available to the extent that individual participants or participating hospitals cannot be identified, in accordance with requirements of the approving Human Research Ethics Committees.
Ethical consideration
Ethical approvals were gained by the DUQuA team at Human Research Ethics Committees (HRECs) in all regions covering participating hospitals [18]. Site-specific authorisations, including the permission of using external researchers to collect data in hospitals, have also been granted before commencement of research. We complied with confidentiality requirements of national legislation or standards of practice of each jurisdiction.
