


Abstract
The aim of this study was to evaluate the outcomes of implementing a sepsis screening (SS) tool based on the quick Sequential [Sepsis-Related] Organ Failure Assessment (qSOFA) and the presence of confirmed/suspected infection. The implementation of the 6-h bundle was also evaluated.
Interrupted times series with prospective data collection.
Five hospital wards in a developing nation, Argentina.
A total of 1151 patients (≥18 years) recruited within 24–48 h of hospital admission.
The qSOFA-based SS tool and the 6-h bundle.
The primary outcome was the timing of implementation of the first 6-h bundle element. Secondary outcomes were related to the adherence to the screening procedures.
Of 1151 patients, 145 (12.6%) met the qSOFA-based SS tool criteria, among them intervention (39/64) patients received the first 6-h bundle element earlier (median 8 h; 95% confidence interval (CI): 0.1–16) than baseline (48/81) patients (median 22 h; 95% CI: 3–41); these times, however, did not differ significantly (P = 0.525). Overall, 47 (4.1%) patients had sepsis; intervention patients (18/25) received the first 6-h bundle element sooner (median 5 h; 95% CI: 4–6) than baseline patients (15/22) did (median 12 h; 95% CI: 0–33); however, times were not significantly different (P = 0.470). While intervention patients were screened regularly, only one-third of patients who required sepsis alerts had them activated.
The implementation of the qSOFA-based SS tool resulted in early, but not significantly improved, provision of 6-h bundle care. Screening procedures were regularly conducted, but sepsis alerts rarely activated. Further research is needed to better understand the implementation of sepsis care in developing settings.
Introduction
Sepsis is a global health challenge affecting 30 million people resulting in 6–9 million deaths every year [1]. Reported mortality varies across developed and developing nations with lower rates found in Australia (18%) compared to Brazil (55%) [2, 3]. While most evidence is generated in the developed world, results are variable with experts suggesting mortality rates are likely higher than reported in developing nations [4]. However, in the past two decades, the implementation of guidelines has decreased mortality where timely treatment was provided [5, 6]. For example, studies in Brazil and Rwanda demonstrated that adherence to guidelines decreased mortality [7–9] and improved the use of evidence-based interventions [10]. Conversely, the implementation of an early resuscitation protocol for sepsis was associated with increased mortality in Zambia [11], suggesting that the implementation of sepsis guidelines in the developing world requires greater scrutiny.
Prompt recognition of sepsis has been acknowledged as a research priority [12, 13] and is necessary to facilitate timely implementation of treatment; however, the implementation of tools to recognize sepsis in the developing world remains under-reported [14]. Therefore, the aim of this study was to evaluate the outcomes of implementing a sepsis screening (SS) tool based on the quick Sequential [Sepsis-Related] Organ Failure Assessment (qSOFA) [15] and the Surviving Sepsis Campaign (SSC) 6-h bundle [16] in a developing nation.
Methods
An interrupted times series study was conducted over a 24-week period in 2017 to evaluate the implementation of a qSOFA-based SS tool and the 6-h bundle in medical–surgical wards in a 169-bed tertiary referral hospital in Argentina, a developing nation. The study protocol was approved by Griffith University Human Research Ethics Committee and relevant Institutional Review Boards. Individual consent was waived as the information collected was consistent with local regulation and aligned with that already collected in usual care.
Outcomes
The primary outcome was the time to implement the first 6-h bundle element (any of cultures or lactate obtained; fluids, vasopressors or antibiotics administered) after time zero. Time zero was the moment the patient met qSOFA-based SS tool criteria, which is consistent with the SSC that describes time zero as the time of presentation/triage or the time the chart documentation indicated evidence of sepsis [17]. The primary outcome was measured in two groups of patients: those who met the qSOFA-based SS tool criteria and those diagnosed with sepsis at discharge.
Secondary outcomes were as follows: frequency and percentage of screenings (three times a day) completed by nurses using the qSOFA-based SS tool during patients’ hospitalization and time to sepsis alert activation (time zero to the moment nurses requested a medical review for investigation of sepsis). Improvements in the documentation of qSOFA variables were evaluated at baseline and intervention periods.
Setting
The hospital provided complex medical–surgical care, critical care and diagnostic services 24/7. Study wards comprised 55% (n = 94) of hospital beds distributed over five floors. The nurse-to-patient ratio ranged from 1:3 in a 6-bed ward to 1:6 in the larger 31-bed ward. Wards were staffed by one internal medicine specialist physician and residents. After hours, four residents were on duty supported by on-call specialist consultants. Staff had limited administrative support. The patient medical record comprised electronic health records for documenting routine reviews, treatment and pathology, and paper-based documents to record vital signs, medication and fluid orders. Access to computers (with slow internet connection) varied; wards had 3–5 computers shared by all professionals.
Sample
Participants were adults (≥18 years) admitted to the study wards. Exclusion criteria were as follows: patients admitted to specialty areas, under palliation and do not resuscitate (DNR) status or existing sepsis diagnosis. Eight consecutive patients admitted to hospital in the previous 24–48 h were recruited each day for 24 weeks. Prior to recruitment, wards were randomly ordered from first to fifth to allow for sample variation across larger and small wards. Recruitment was interrupted between weeks 12 and 13 when the intervention was introduced.
Intervention
The intervention tested consisted of the qSOFA-based SS tool (Supplementary Fig. 1) and the application of the 6-h bundle when a patient met the qSOFA-based SS tool criteria (Supplementary Fig. 2). The screening tool, developed specifically for testing in this study, included vital signs and the source of suspected or confirmed infection or antibiotics administered. The vital signs, respiratory rate (RR), systolic blood pressure (SBP) and altered mentation (AM) were reported as per the qSOFA [18]; these were also common SS variables identified in a recent systematic review [14]. Listed sources of infection were based on the instrument tested by Gyang et al. and were consistent with the SSC [19, 20]. The qSOFA was selected because it demonstrated good predictive validity for in-hospital mortality in non-intensive care patients with infection [18].
Prior to implementation, the qSOFA-based SS tool and the SSC 6-h bundle were reviewed by management and bedside clinicians. The qSOFA-based SS tool was incorporated into nursing documentation workflows in a paper format. Evidence-based information about sepsis and the intervention (Supplementary Fig. 1 and 2) that underpinned the education was available for staff; all materials were in Spanish. Nurses were asked to screen for sepsis at admission, during routine observations or when they identified a change in a patient’s clinical condition. If a patient scored ≥2 qSOFA points, with the presence of confirmed/suspected infection, or the patient had antibiotics administered, the nurse was directed to immediately activate a sepsis alert by calling the physician-in-charge, requesting a medical review and documenting the alert in the screening form. Physicians were instructed to review these patients and, if required, to provide 6-h bundle care (Supplementary Fig. 2) [16].
Data collection
Data prospectively collected included demographics, comorbidities, use of operating room, admission to intensive care, hospital length of stay and diagnosis at discharge. Diagnosis was informed by the Sepsis-3 criteria [15] and determined by an intensivist who reviewed the electronic health records and was blinded to the qSOFA-based SS tool assessments. Where a patient did not meet the Sepsis-3 criteria, they were classified as having an infection or other diagnosis.
Information collected to assess the primary outcome included the date and time the cultures and lactate were obtained; fluids, vasopressors and antibiotics were administered; and the source of suspected/confirmed infection. If no source of infection was documented but the patient was receiving antibiotics, it was assumed clinicians suspected an infection. qSOFA variables collected during the patient’s admission were recorded from the paper vital sign (RR, SBP) and electronic forms (AM). Times for these assessments were not always available owing to documentation omissions. Where the documented time was not available, the mean time of assessment was calculated from a random sample of screening forms for each of the morning, afternoon and night shifts, and the relevant estimated time was used (Supplementary Methods). The date and time of the earliest qSOFA score of ≥2 documented became the time zero in patients with confirmed/suspected infection, or where antibiotics were administered. In the remaining patients, the date and time of the first qSOFA score of ≤ 1 was considered.
To assess secondary outcomes, screening information, including the number of screening procedures expected and completed and the date and time the sepsis alerts were activated, were collected from the screening forms. To evaluate improvements in documentation of the qSOFA variables, the absence of documented variables was noted. Data were entered into a password-protected Microsoft® Excel (version 2016) file or REDCap database.
Data analysis
Following data cleaning, data accuracy was verified via review of 10% of randomly selected participant data (error rate 0.01). Median and interquartile ranges (IQR) were used to analyze continuous, non-normally distributed data and frequencies to analyze categorical data. Patient characteristics were compared by diagnostic group using chi-square and Kruskal–Wallis techniques according to the type of data. The discharge diagnoses of sepsis and septic shock were grouped into one sepsis cohort.
Timing of implementation of the first 6-h bundle element was examined by Kaplan–Meier analysis for patients who met the qSOFA-based SS tool criteria and patients with sepsis diagnosis at discharge. The log-rank test determined the statistical significance (P < 0.05). The period considered from time zero to the first 6-h bundle element implemented was 48 h. This time frame represented a balance between what was desired and realistic given involvement of various practitioners, barriers to accessing patient information and limited administrative support. A subgroup analysis was conducted including the times of patients who met the qSOFA-based SS tool criteria and received the first 6-h bundle element; times were examined between baseline and intervention groups using Mann–Whitney U test and effect size. Patients who did not receive a 6-h bundle element during this 48-h time-frame, were discharged or became DNR during this time, were censored.
Percentages, descriptive statistics and statistical process control (SPC) were used to assess secondary outcomes. The percentage of screenings completed by nurses was the ratio of screening assessments conducted in relation to the total number of expected procedures during admission. Time (from time zero to the alert time documented in the screening form) was presented as categories and its frequencies described. The improvement in documentation of qSOFA variables was evaluated using SPC R-Chart [21]. The number of patients with ≥1 non-documented qSOFA variables varied among subgroups and was not normally distributed. To address this limitation, 15 patients were randomly sampled per subgroup. Upper and lower control limits were then calculated using the average of subgroup ranges and the predetermined constants (D3 = 0.347; D4 = 1.653) [22]. This procedure provided a robust subgroup sample, greater than the minimum recommended, and contributed to the homogeneity of data points. The R-Chart was preferred because it is considered a usual SPC practice to assess variation and illustrated the spread of non-documentation practice [21]. IBM SPSS Statistics for Windows® Version 25 (IBM Corp, Armonk, NY) was used for all analyses.
Results
Among 1151 patients, 47 (4.1%) had sepsis, 413 (35.9%) had infection and 691 (60.0%) had other diagnoses at discharge (Table 1). Overall, 145 of 1151 patients met the qSOFA-based SS tool criteria; 28 of 145 were diagnosed with sepsis at discharge (Table 2); 19 of 47 with sepsis at discharge did not met the qSOFA-based SS tool criteria (Fig. 1).
Patients clinical characteristics
| Clinical characteristics | Whole cohort n = 1151 | Sepsis n = 47 | Infection n = 413 | Other n = 691 | P value |
|---|---|---|---|---|---|
| Age, median (IQR) | 69.9 (29.0) | 76.4 (21.3) | 72.0 (28.8) | 68.4 (29.6) | 0.004 |
| Gender, n (%) | |||||
| Male | 532 (46.2) | 27 (57.4) | 204 (49.4) | 301 (43.6) | 0.049 |
| Female | 619 (53.8) | 20 (42.6) | 209 (50.6) | (390 (56.4) | |
| Condition at discharge, n (%) | |||||
| Alive | 1117 (97) | 36 (76.6) | 407 (98.5) | 674 (97.5) | <0.001 |
| Deaths excluding DNR | 7 (0.6) | 3 (7.9) | 2 (0.5) | 2 (0.3) | |
| DNR status | |||||
| Yes, n (%) | 29 (2.5) | 9 (19.1) | 5 (1.2) | 15 (2.2) | |
| Days from admission to DNR decision, median (IQR) | 5.0 (7.0) | 7.0 (11.0) | 9.0 (11.5) | 3.0 (5.0) | 0.187 |
| CCI, median (IQR) | 2.0 (3.0) | 3.0 (3.0) | 3.0 (3.0) | 2.0 (4.0) | <0.001 |
| HLOS, median (IQR) | 4.0 (4.0) | 9.0 (11.0) | 5.0 (4.0) | 4.0 (3.0) | <0.001 |
| Use of ICU or CCU, n (%) | |||||
| Yes | 114 (9.9) | 13 (27.7) | 18 (4.4) | 83 (12.0) | <0.001 |
| No | 2037(90.1) | 34 (72.3) | 395 (95.6) | 608 (88.0) | |
| ICU or CCU length of stay, median (IQR) | 1.4 (2.0) | 7.8 (7.8) | 2.5 (2.2) | 1.1 (1.1) | <0 .001 |
| Use of OR, n (%) | |||||
| No use of OR | 656 (57.0) | 31 (66.0) | 274 (66.3) | 351 (50.8) | <0.001 |
| ≥1 procedure in OR | 495 (43.0) | 16 (34.0) | 139 (33.7) | 340 (49.2) |
CCI, Charlson Comorbidity Index; HLOS, hospital length of stay; ICU, intensive care unit; CCU, coronary care unit; OR, operating room.
Screening criteria and 6-h bundle implemented
| Screening criteria and 6-h bundle | Whole cohort n = 1151 | Sepsis n = 47 | Infection n = 413 | Other n = 691 | P value |
|---|---|---|---|---|---|
| Confirmed or suspected source of infection, n (%) | |||||
| No source of infection | 635 (55.2) | 1 (2.1)a | 11 (2.7) | 623 (90.2) | <0.001 |
| 1 Source of infection | 393 (34.1) | 31 (66.0) | 301 (72.9) | 61 (8.8) | |
| ≥2 Sources of infection | 123 (10.7) | 15 (31.9) | 101 (24.5) | 7 (1.0) | |
| qSOFA, n (%) | |||||
| ≥2 Points | 213 (18.5) | 28 (59.6) | 94 (22.8) | 91 (13.2) | <0.001 |
| ≤1 Point | 938 (81.5) | 19 (40.4) | 319 (77.2) | 600 (86.8) | |
| qSOFA-based SS tool criteria met, n (%) | |||||
| Yes | 145 (12.6) | 28 (59.6) | 92 (22.3) | 25 (3.6) | <0.001 |
| No | 1006 (87.4) | 19 (40.4) | 321 (77.7) | 666 (96.4) | |
| Antibiotics administered, n (%) | |||||
| Yes | 559 (48.6) | 46 (97.9) | 392 (94.9) | 121 (17.5) | <0.001 |
| No | 592 (51.4) | 1 (2.1) | 21 (5.1) | 570 (82.5) | |
| Patients with lactate obtained, n (%) | |||||
| Yes | 264 (22.9) | 34 (72.3) | 125 (30.3) | 105 (15.2) | <0.001 |
| No | 13 (27.7) | 288 (69.7) | 586 (84.8) | ||
| Lactate mmol/l, median (IQR) | 1.8 (1.0) | 1.9 (1.6) | 1.7 (1.0) | 1.8 (1.0) | 0.153 |
| Patients with higher lactate obtained, n (%) | 26 (2.3) | 9 (19.1) | 9 (2.2) | 8 (1.2) | |
| Higher lactate mmol/l, median (IQR) | 2.2 (3.1) | 3.4 (3.3) | 2.1 (1.3) | 1.9 (1.5) | 0.091 |
| Patients with fluids administered, n (%) | |||||
| Yes | 38 (3.3) | 11 (23.4) | 13 (3.1) | 14 (2.0) | <0.001 |
| No | 1113 (96.7) | 36 (76.6) | 400 (96.9) | 677 (98.0) | |
| Amount of fluids, ml crystalloids, median (IQR) | 500 (500) | 500 (1000) | 500 (500) | 1000 (500) | 0.477 |
| Vasopressor initiated, n (%) | |||||
| Yes | 10 (0.9) | 8 (17.0) | 0 (0) | 2 (0.3) | <0.001b |
| No | 1141 (99.1) | 39 (83.0) | 413 (100) | 689 (99.7) | |
| Cultures obtained, n (%) | |||||
| No cultures | 626 (54.4) | 2 (4.3) | 56 (13.6) | 568 (82.2) | <0.001 |
| ≥1 Culture | 525 (45.6) | 45 (95.7) | 357 (86.4) | 123 (17.8) | |
| Type of culture, n (%) | |||||
| Blood cultures ≥1 | 364 (31.6) | 43 (91.5) | 259 (62.7) | 62 (9.0) | <0.001c |
| Urine culture ≥1 | 256 (22.2) | 31 (66.0) | 163 (39.5) | 62 (9.0) | <0.001c |
| Other cultures ≥1 | 231 (20.1) | 20 (42.6) | 167 (40.4) | 44 (6.4) | <0.001c |
| Culture reports, n (%) | |||||
| ≥1 Negative culture | 428 (37.2) | 39 (83.0) | 281 (68.0) | 108 (15.6) | <0.001d |
| ≥1 Positive culture | 268 (23.3) | 33 (70.2) | 206 (49.9) | 29 (4.2) | <0.001d |
| ≥1 Gram-negative bacteria | 145 (12.6) | 17 (36.2) | 110 (26.6) | 10 (1.4) | <0.001e |
| ≥1 Gram-positive bacteria | 75 (6.5) | 11 (23.4) | 46 (11.1) | 5 (0.7) | <0.001e |
| ≥1 Fungi | 20 (1.7) | 2 (12.8) | 12 (2.9) | 2 (0.3) | <0.001e |
| All multiresistant bacteria ≥1 (MRSA, ESBL, KPC) | 35 (3.0) | 2 (4.3) | 29 (7.0) | 4 (0.6) | <0.001f |
ml, milliliter; MRSA, methicillin-resistant Staphylococcus aureus; ESBL, extended spectrum β-lactamases; KPC, Klebsiella pneumoniae carbapenemase.
This patient did not have information related to infection or antibiotic administration but was diagnosed with sepsis based on a review of the electronic health record.
Two cells (33.3%) had expected count <5; the minimum expected count is 0.41.
Chi-square calculated based on dichotomized variable ≥1 blood, urine and other culture and no culture; no culture is not reported.
Chi-square calculated based on dichotomized variable ≥1 positive, negative and no culture; no culture is not reported.
Chi-square calculated based on dichotomized variable ≥1 microbe and no microbe; no microbe is not reported.
Chi-square calculated based on dichotomized variable ≥1 multiresistant bacteria and no multiresistant bacteria; no multiresistant bacteria is not reported.

Patients who met the qSOFA-based SS tool criteria and patients with sepsis diagnosis at discharge.
Primary outcomes
Among patients who met the qSOFA-based SS tool criteria, 48/81 (59.3%) of baseline patients and 39/64 (60.9%) of intervention patients received the first 6-h bundle element within 48 h after time zero (Supplementary Table 1). Intervention patients received the first 6-h bundle element earlier (median 8 h; 95% confidence interval (CI): 0.1–16) than baseline patients (median 22 h; 95% CI: 3–41), yet the times did not differ significantly (P = 0.525) (Fig. 2A). A smaller proportion (14.1%) of censored patients did not receive any element of the 6-h bundle during the intervention period when compared to baseline (25.9%) (Supplementary Table 1). The subgroup analysis of times in patients who met the qSOFA-based SS tool criteria and received the first 6-h bundle element within 48 h of time zero (excluding censored patients) in baseline and intervention was consistent with the overall results. Times were not different (median 6 versus 4 h) and represented a very low effect size (U = 736, z = −1.716, P = 0.086, r = 0.03).
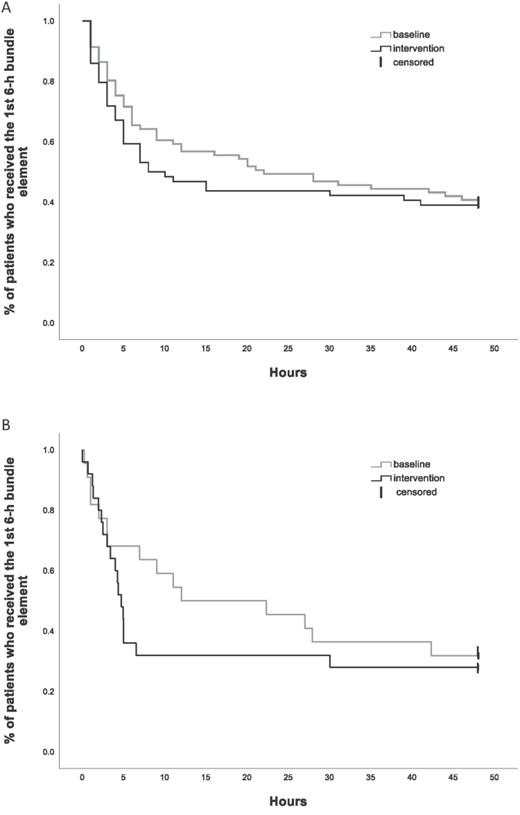
Timing of implementation of the first 6-h bundle element in patients who met the qSOFA SS tool criteria (A) and in patients with sepsis diagnosis at discharge (B).
Among patients with sepsis at discharge (15 [68.2%] baseline; 18 [72.0%] intervention; Supplementary Table 2), there was a trend towards the first 6-h bundle element being applied sooner in intervention patients (median 5 h; 95% CI: 4–6) than baseline (median 12 h; 95% CI: 0–33), (P = 0.470) (Fig. 2B). Patients with sepsis at discharge received the first 6-h bundle element sooner than those who met the qSOFA-based SS tool criteria when compared in the same periods, baseline (median 12 versus 22 h) and intervention (median 5 versus 8 h).
Secondary outcomes
During the intervention period, 506 (92.5%) patients were screened, a total of 6519 times representing a median (IQR) of 70.9 (27%) of the possible times. There was variation in frequency across intervention weeks, with the first (week 13) being a median (IQR) of 64.3 (36), the highest 80.0 (30.0) in week 16 and the last of 70.7 (35.0) in week 24 (Supplementary Fig. 3). Nurses activated sepsis alerts in 21/64 (32.8%) patients who met the qSOFA-based SS tool criteria, and delays of ≥7 h were observed for most patients with only five alerts communicated immediately (Supplementary Table 3).
In documentation of qSOFA variables, 722 (62.7%) patients had ≥1 non-documented qSOFA variable (Supplementary Table 4), most commonly AM (n = 669; 58.1%), RR (n = 171; 14.9%) and SBP (n = 163; 14.2%). Analysis of non-documented qSOFA variables occurred generally within the control limits as examined via SPC R-Chart analyses (Fig. 3); however, the process was not stable. Signals of instability were data points that raised above the control limits in weeks 2 and 6 (or above +3 sigma) and in weeks 14, 15 and 19–21 where points were below −2 sigma (equivalent to below −2 SD) [23]. This cyclic pattern with erratic shifts above and below the central line suggests the absence of statistical control; it is not possible to differentiate changes attributable to the intervention [24].
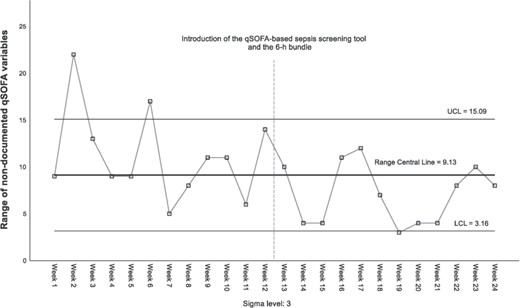
Patients with ≥1 non-documented qSOFA variable per study week.
Discussion
Although there was a trend towards earlier implementation of the first 6-h bundle element, this did not reach statistical significance. The former 6-h bundle has recently been revised and became the 1-h bundle [17]. The trend achieved is far behind the new standard. The low prevalence of sepsis found in the present study prevented the evaluation of effect on death.
Patients with sepsis at discharge were treated sooner than patients who met the qSOFA-based SS tool criteria. A limitation of this comparison is the overlap of patients in the sepsis group who also met the qSOFA-based SS tool criteria (Fig. 1). There were also patients who did not meet the qSOFA-based SS tool criteria and yet received an element of the 6-h bundle. This finding suggests that clinical judgment was different for patients who later developed sepsis. Clinical judgment has shown to be reliable in distinguishing ward patients at risk of clinical deterioration and poor outcomes [25]. More understanding of clinical judgment in sepsis could help inform future screening strategies.
There were, however, patients who received no element of the 6-h bundle, or they did with significant delays. A quarter of patients in the baseline period and almost 15% in the intervention period met the qSOFA-based SS tool criteria but received no element of the 6-h bundle (Supplementary Table 1). These patients may have required a different treatment than that specified in the 6-h bundle, as only 28/145 patients who met the qSOFA-based SS tool criteria were diagnosed with sepsis. For a few patients diagnosed with sepsis at discharge, there was an absence or delay in treatment. It is likely that this sub-group of patients could have presented other unrecognized symptoms not explored in this study. The complexity of the cellular changes underlying sepsis makes early recognition [26] of sepsis in this population challenging.
Implementation of the 6-h bundle was physician-driven, yet nurses, pharmacist and pathology practitioners were also involved. Delays in its delivery may have been related to very busy staff particularly after hours. Poor implementation of the 6-h bundle was reported in low-income country settings in Asia and South America [27, 28], suggesting that context is an important consideration for effective implementation. Given the study wards in the Argentinean site had limited administrative support, reduced connectivity to the electronic health records and varied skill mix after hours, it is likely that physicians might have experienced competing priorities and challenges accessing patient information, which may have resulted in treatment delays. In addition, the small number of sepsis alerts activated and delays in alert activation by nurses could have influenced the implementation of the first 6-h bundle element. Similar to physicians, competing priorities may have resulted in delayed alert activation. Further research may help to understand setting characteristics for effective implementation of SS and care.
The findings related to the improvement in the documentation of qSOFA variables are inconclusive. An important limitation in the R-Chart analysis is the lack of stability in the process during the baseline period, followed by a cyclic pattern during intervention [23]. Out-of-control points in baseline are explained by hospital demands. In week 2, an electronic procedure for requesting/dispensing medication was introduced, and in week 6, the annual resident physician’s intake occurred. In the manufacturing industry, cyclic patterns are signals associated with changes in the environment [29]. However, having an out-of-control baseline process, interpretation of this signal would be speculative.
Of all the qSOFA variables, AM was most often missing. Documentation of mental status assessment is challenging [30]; however, lack of documentation does not mean that the patient was not assessed. It is unclear that the extent to which non-documented AM can be attributed to difficulties with assessment or documentation.
Despite this study being prospective, with a large sample size, and the first of its kind in a developing nation health setting, there are limitations to acknowledge. First, data collection was challenging owing to some information being unavailable in the paper and electronic patients’ health records; therefore, some screening information may have been missed. In particular, identifying accurate times for assessment could have affected evaluation of the primary outcome. Second, hospital length of stay could not be reliably evaluated because some patients remained in hospital for non-medical reasons. Third, only the first 6-h bundle element after meeting the qSOFA-based SS tool criteria was evaluated as not all patients received all elements. Finally, it is also possible that using proven screening tool and a different criterion to diagnose sepsis would have yielded a different outcome. The low frequency of sepsis prevented the evaluation of mortality.
Contextual details including nurse/physician-to-patient ratios, staff qualifications, non-professional and administrative support and the type of health records must be considered when planning practice change and associated research. Factors that prevent nurses from activating sepsis alerts and strategies that assist physicians provide timely treatment should also be considered. Finally, strategies that result in a sustained improvement in sepsis care in developing nation health settings and the outcomes of its use are required too.
In conclusion, in a developing nation health setting, while there was a trend towards early provision of the first 6-h bundle element in intervention patients, this change was not statistically significant. A higher percentage of screening procedures was achieved and sustained during the intervention period. Regardless, only one-third of patients who met the qSOFA-based SS tool criteria had the sepsis alert activated. Challenges to improve sepsis care in a developing nation health setting persist and require ongoing development.
Acknowledgements
Authors acknowledge Ms Silvina Bravo (Director of Nursing, Clínica Bazterrica) and Dr Alejandra Di Leo Lira (Medical Director, Clínica Bazterrica) for granting access to the study site and supporting all study activities. Special thanks to Ms Maria Marta Ayala, Mr Alberto Sotomayor (Nurse Unit Managers, Clínica Bazterrica), and Mr David Sanz (Director of Nursing, Executive Assistant) for assisting the data collector with computing facilities and help to manage the study. Thanks to Dr Carlos Martin (Internal Medicine Director, Clínica Bazterrica) and his team, to the Nurse Unit Managers from specialty areas and the nurses from the study wards for supporting the data collection. Special thanks to the administrative, audit and security staff (Clínica Bazterrica) for granting access to paper health records after-hours. Thanks to Ms Brooke Musty for assisting with data entry. We also acknowledge Dr Ian Hughes (Gold Coast University Hospital, Gold Coast Health) for his advice on data management, and Professor Robert Ware (Menzies Health Institute Queensland) for providing statistical advice.
Funding
This study is part of the principal investigator PhD study at Griffith University and was supported by PhD Scholarships (Griffith University International Postgraduate Research Scholarship, Griffith University Postgraduate Research Scholarship, and Completion Assistance Postgraduate Research Scholarship).
Conflicts of Interest
Authors have no conflict of interest to declare.
