


Abstract
To assess organizational culture in neonatal intensive care units (NICUs) in Japan.
Cross-sectional survey of organizational culture.
Forty NICUs across Japan.
Physicians and nurses who worked in NICUs (n = 2006).
The Competing Values Framework (CVF) was used to assess the organizational culture of the study population. The 20-item CVF was divided into four culture archetypes: Group, Developmental, Hierarchical and Rational. We calculated geometric means (gmean) and 95% bootstrap confidence intervals of the individual dimensions by unit and occupation. The median number of staff, beds, physicians’ work hours and work engagement were also calculated to examine the differences by culture archetypes.
Group (gmean = 34.6) and Hierarchical (gmean = 31.7) culture archetypes were higher than Developmental (gmean = 16.3) and Rational (gmean = 17.4) among physicians as a whole. Hierarchical (gmean = 36.3) was the highest followed by Group (gmean = 25.8), Developmental (gmean = 16.3) and Rational (gmean = 21.7) among nurses as a whole. Units with dominant Hierarchical culture had a slightly higher number of physicians (median = 7) than dominant Group culture (median = 6). Units with dominant Group culture had a higher number of beds (median = 12) than dominant Hierarchical culture (median = 9) among physicians. Nurses from units with a dominant Group culture (median = 2.8) had slightly higher work engagement compared with those in units with a dominant Hierarchical culture (median = 2.6).
Our findings revealed that organizational culture in NICUs varies depending on occupation and group size. Group and Hierarchical cultures predominated in Japanese NICUs. Assessing organizational culture will provide insights into the perceptions of unit values to improve quality of care.
Introduction
Organizational culture is described as the reflection of values, dominant leadership styles, the language and symbols, the procedures and routines, and the definitions of success that make an organization unique [1]. The most common definition of organizational culture is that by Schien [2], who describes it as ‘a pattern of shared basic assumptions that a group has learned as it solved its problems of external adaptation and internal integration, that has worked well enough to be considered valid and therefore, to be taught to new members as the correct way to perceive, think and feel in relation to those problems’. The study of organizational culture began in the 1980s, and understanding organizational culture has become an essential approach to implementing strategic management in the business field. Similarly, organizational culture in the healthcare industry has also been drawing much attention since the late 1990s, as it has been recognized as an important contributor to healthcare quality and performance. Organizational values and beliefs often focus on quality of care and patient safety, and there is strong evidence of these values in most healthcare organizations [3]. Notably, organizational culture has been shown to have an impact on job satisfaction [4–6], employee turnover [7], patient satisfaction [5, 8], quality improvement [9], guideline adherence [10] and performance outcomes [11].
Studies have suggested that a cooperative culture is associated with improved patient outcomes in neonatal intensive care, such as a decrease in mortality of preterm infants [12] and higher safety performance [13]. Conversely, there is an argument that the interpretation of results should be done with a degree of caution due to methodological weakness [14, 15]. Considering that organizational culture in healthcare may be a critical indicator of quality improvement, measuring organizational culture is increasingly needed for organizations to identify enhancements and barriers to implementing quality improvement. A number of instruments have been developed to measure organizational culture and have been used in several studies to assess organizational culture in healthcare [16–19]. For example, the Competing Values Framework (CVF) is commonly used in the healthcare setting [20–23]. To date, however, no studies, including but not limited to healthcare settings, have taken into account the nature of fixed choice (ipsative data) of the CVF scales [6, 8, 9, 20, 22–25].
While Japan is a country with one of the lowest infant mortality rates in the world, practice variations and disparities in the morbidity and mortality of very low birth weight infants have been found among neonatal intensive care units (NICUs) [26]. There are multiple clinical and nonclinical factors behind these variations and disparities among facilities, and organizational culture might differ depending on practice performance. Differences in organizational culture in the context of quality improvement of NICUs have not yet been investigated in Japan. This study, therefore, analyzed ipsative data with the view to assess the organizational culture of NICUs in Japan.
Methods
Sample and data
We used baseline data from a self-administered questionnaire for physicians and nurses at 40 NICUs across Japan that participated in the Improvement of NICU Practice and Team Approach Cluster randomized controlled trial (INTACT) [27]. INTACT aimed to improve the outcomes of very low birth weight infants by conducting a multifaceted intervention, which consisted of (i) comprehensive feedback of facility profiles, (ii) on-site educational workshops, (iii) assistance in the development and implementation of action plans and (iv) audits of the status of action plans to provide advice. Questionnaires were distributed to 345 physicians and 1800 nurses. The unlinked anonymous survey was conducted from December 2011 to March 2012.
Ethical consideration
Participation in the study was voluntary and written consent was obtained from each participant. Anonymity and confidentiality of data was assured to all participants. Ethical approval was obtained on 15 July 2011 from the independent review board of INTACT (UMIN000007064), which has its administrative office located at Tokyo Women's Medical University. This study was also approved by the Ethics Committee of Kyoto University Graduate School and Faculty of Medicine on 28 March 2014.
Instrument
Competing Values Framework
The original CVF instrument comprised 16 items validated by Quinn and Spreizer [28]. We used a modified 20-item version from the Quality Improvement Implementation Survey created by Shortell [9] for use in the hospital environment, and included the CVF scales adapted from Zammuto and Krakowe [29]. Shortell's 20-item version is divided into four organizational culture archetypes, measuring over five organizational dimensions: facility character, cohesion, managers, emphasis and facility rewards. The four organizational culture archetypes are referred to as Group, Developmental, Hierarchical and Rational. Group culture focuses on norms and values associated with affiliation, teamwork and participation. This archetype has an internal focus and emphasizes flexibility. Developmental culture focuses on risk-taking innovation and change. This has an external focus and emphasizes flexibility. Hierarchical culture reflects the values and norms associated with bureaucracy. This has an internal focus and emphasizes control. Rational culture focuses on efficiency, productivity and achievement. This archetype has an external focus and emphasizes control. There are two versions of the instrument, Likert scales and ipsative scales. Quinn and Spreizer found that both versions of the instrument conformed to the CVF, and items among the four subscales correlated as predicted in the model [28]. Cronbach Alphas on CVF Likert scales were 0.76–0.90 for Group culture; 0.77–0.86 for Development culture; 0.62–0.70 for Hierarchical culture; and 0.71–0.80 for Rational culture [30–32]. In the present study, we used ipsative scales in which respondents allocated 100 points among four items of each cultural dimension according to how well each item described the organization relative to the other items.
Utrecht Work Engagement Scale Japan (UWES-J)
Work engagement was measured using the Japanese 9-item (α = 0.92) short version of the Utrecht Work Engagement Scale Japan [33]. The three sub-dimensions of vigor, dedication and absorption were each represented by three items (e.g. ‘At my job, I feel strong and vigorous’; ‘I am enthusiastic about my job’; and ‘I feel happy when I work intensely’). Respondents rate how often they experience these positive work-related states, using a 7-point scale from 1 = ‘never’ to 7 = ‘always/every day’.
Translation process
The 20-item CVF instrument was translated into Japanese from English by a professional translator, and then back translated by a different translator. To maintain quality control, the back translation was shared with Dr. Stephen M. Shortell, Principal Investigator of the original study [8]. After two authors (H.S. and R.M.) assessed the expressions used in the Japanese CVF, a pretest was performed on 30 physicians and 124 nurses from three pre-intervention facilities that participated in INTACT. The pretest was performed to see whether the Japanese CVF would be appropriate and easily understood. Based on the results of the pretest, the translation was modified and finalized.
Ipsative scales
Ipsative data are scale scores for respondents that always add to the same total [34]. Because the measurement approach requires respondents to allocate a fixed number of points among four culture archetypes, the number of points a respondent assigns to one type of culture affects the number of points he or she assigns to the other types of culture [8]. In these kinds of fixed scales, items are grouped in item sets, and respondents must compare options instead of selecting the most desirable alternative, as is the case with normative scores such as Likert-type scales [35].
Because of the holistic nature of organizational culture, the quadrants (Group, Developmental, Hierarchical and Rational) of CVF scales are interdependent [36]. The ipsative scales maintain the quadrants’ interdependence [28]. Thus, ipsative scales are suitable for use when correlating cases and undertaking Q factor analysis [37]. Considering this feature, ipsative scales are not appropriate for correlations-based analysis such as factor analysis and regression [28].
Statistical analysis
We excluded data from analysis if there was a missing value on any variable in the CVF instrument and if the sum of each subscale was not 100 points. We calculated means and confidence intervals (CIs) of the individual dimensions by hospital and occupation. Hospitals were classified according to the founder. We also calculated median number of staff, beds, physicians’ work hours and work engagement to investigate the differences by hospital types and culture archetypes.
The analysis of ipsative data, however, is problematic because standard statistical analyses yield biased results [35]. Van Eijnattan et al. [35] proposed an alternative statistical method to take into account the ipsative nature of the CVF: the closed part-wise geometric mean, the nonparametric bootstrap 95% CIs and envelopes. Construction of 95% bootstrap CIs is described as follows: (i) extract nonparametric samples from the data, (ii) compute collective dimensional profiles (CDP) for each of the bootstrap samples with the closed part-wise geometric means, (iii) compute the Aitchison distance [38] for each bootstrap CDP, (iv) delete the CDP pertaining to the 5% largest Aitchison distance and (v) determine the upper and lower bounds of each CI based on the highest and lowest values for each component of the remaining 95% of the bootstrap mean CDPs. The suggested approach satisfies basic statistical requirements for the analysis of ipsative data: scale invariance, permutation variance and subcompositional coherence [35]. This approach can correctly compute and compare organizational culture profiles within the same organization. On the other hand, Van Eijnattan et al. argued that the problem of drawing inter-organization contrasts in ipsative scales still remains uncertain. Thus, we can only interpret our results as a relative comparison between organizations. We did not test psychometric property of the scales in this study because correlation-based analysis and factor analysis are not suitable to ipsative data, as explained above. Although there are some statistical limitations on ipsative scales, we gave priority over its merits and applied this method to analyze our data in this study.
All statistical analyses were undertaken in R-software package ‘compositions’ [39–41] and SPSS version 21.0 (IBM Corporation, USA). The syntax of R program was obtained from Van Eijnattan [35].
Results
Description of sample
A total of 2006 questionnaires were completed by 316 physicians (response rate = 92%) and 1690 nurses (response rate = 94%). The high response rate was achieved due to the provision of feedback results to each NICU. After excluding missing values and values scored with the same numbers, the final data for analysis were 1758, including 289 physicians and 1469 nurses. The 289 physicians consisted of 56 (19.4%) managerial doctors, 206 (71.3%) doctors, 23 (8.0%) residents and 4 (1.4%) unknown. The 1469 nurses consisted of 124 (8.4%) managerial nurses, 1324 (90.1%) nurses, 3 (0.2%) assistant nurses and 18 (1.2%) unknown. The highest number of years of practice in their own unit was 1–2 years for nurses and less than 1 year for physicians (Table 1).
Characteristics of NICUs and their staff
| N | % | |
|---|---|---|
| Neonatal intensive care units | 40 | 100 |
| Facility type | ||
| Public | 24 | 60.0 |
| Private | 10 | 25.0 |
| Other | 6 | 15.0 |
| Number of beds in unit | ||
| 6–9 | 17 | 42.5 |
| 10–13 | 11 | 27.5 |
| 14–17 | 3 | 7.5 |
| 18–21 | 7 | 17.5 |
| >22 | 2 | 5.0 |
| Staff | 1736 | 100 |
| Head physician | 56 | 3.3 |
| Staff physician | 229 | 13.2 |
| Head nurse | 124 | 7.1 |
| Staff nurse | 1327 | 76.4 |
| Years of working experience | ||
| Less than 1 year | 367 | 21.1 |
| 1–2 years | 385 | 22.2 |
| 3–4 years | 366 | 21.1 |
| 5–9 years | 383 | 22.1 |
| More than 10 years | 235 | 13.5 |
Means and CIs of culture archetypes
The hospitals consisted of one Red Cross hospital, 10 university hospitals, 13 private hospitals, 10 public hospitals and 6 national hospitals. Among 40 NICUs, Hierarchical culture was the dominant culture in 35 units and Group culture was dominant in 5 units (Table 2). Figure 1 shows the organizational culture profile of all 40 units. Hierarchical was stronger than other culture types. With regard to the culture archetypes of physicians by units, 23 units had a higher emphasis on Group and Hierarchical, 12 units had a higher emphasis on Group, 4 units had a higher emphasis on Hierarchical and 1 unit had a higher emphasis on Rational and Hierarchical. The smaller units with mostly less than 10 respondents had wide CIs. For example, the highest gmean fell within the range of the other dimensions, or the minimum score of one dimension was close to the maximum score of another dimension. Therefore, more than one dominant culture was present in those small units. This was not the case among total units and nurses because of the large number of respondents. Figure 2 shows the organizational culture profile for the total physician sample. Group (gmean = 34.6) and Hierarchical (gmean = 31.7) archetypes were both higher than Developmental (gmean = 16.3) and Rational (gmean = 17.4). In terms of nurses’ organizational culture, 34 units placed a higher emphasis on Hierarchical, 5 units had a higher emphasis on Group and 1 unit had a higher emphasis on Developmental. Figure 3 shows the organizational culture profile for the total nurse sample. Hierarchical (gmean = 36.3) was the highest, followed by Group (gmean = 25.8), Developmental (gmean = 16.3) and Rational (gmean = 21.7).
Culture archetype means, 95% CI in units (total)
| Unit | Hospital types | No. of beds | No. of staff (respondents) | Culture archetypes | |||||||
|---|---|---|---|---|---|---|---|---|---|---|---|
| Group | Developmental | Rational | Hierarchical | ||||||||
| Mean | 95% CI | Mean | 95% CI | Mean | 95% CI | Mean | 95% CI | ||||
| Overall (40 units) | 1758 | 27.1 | 26.3–27.9 | 16.4 | 15.9–16.8 | 21.0 | 20.4–21.5 | 35.5 | 34.6–36.4 | ||
| 1 | 3 | 12 | 33 | 27.0 | 20.5–34.9 | 14.0 | 11.1–16.7 | 18.4 | 15.5–21.8 | 40.5 | 32.4–48.9 |
| 2 | 5 | 9 | 45 | 27.4 | 22.6–33.2 | 14.0 | 11.0–17.1 | 19.7 | 17.1–22.9 | 38.9 | 32.7–45.3 |
| 3 | 4 | 30 | 80 | 23.9 | 21.1–27.0 | 20.4 | 18.2–22.3 | 22.3 | 19.9–24.4 | 33.4 | 29.8–37.1 |
| 4 | 3 | 9 | 37 | 26.1 | 22.2–30.3 | 16.0 | 13.6–18.8 | 19.9 | 17.7–21.9 | 37.9 | 33.4–43.0 |
| 5 | 4 | 12 | 49 | 19.4 | 15.8–23.6 | 12.6 | 10.1–15.3 | 19.8 | 16.6–22.8 | 48.2 | 42.1–54.4 |
| 6 | 2 | 21 | 70 | 20.3 | 16.8–24.0 | 13.9 | 11.3–16.5 | 22.2 | 19.5–25.8 | 43.6 | 38.0–49.3 |
| 7 | 4 | 6 | 26 | 28.2 | 23.7–33.5 | 19.5 | 16.2–23.0 | 22.1 | 19.2–25.9 | 30.1 | 25.9–35.4 |
| 8 | 5 | 9 | 25 | 22.8 | 17.8–28.8 | 14.6 | 11.1–18.9 | 16.7 | 12.3–20.3 | 46.0 | 37.6–54.8 |
| 9 | 3 | 12 | 44 | 27.7 | 22.8–32.7 | 15.8 | 13.3–18.5 | 21.4 | 18.1–24.7 | 35.1 | 29.8–40.8 |
| 10 | 2 | 24 | 45 | 31.0 | 26.5–35.4 | 16.9 | 14.3–19.5 | 20.6 | 17.9–23.7 | 31.4 | 26.9–36.2 |
| 11 | 1 | 9 | 38 | 31.9 | 27.6–36.3 | 17.0 | 14.4–20.1 | 20.6 | 18.3–22.8 | 30.5 | 26.3–35.2 |
| 12 | 2 | 9 | 37 | 26.3 | 21.7–31.3 | 16.8 | 14.0–19.5 | 22.5 | 19.1–26.0 | 34.4 | 29.2–40.1 |
| 13 | 3 | 9 | 44 | 28.7 | 24.1–33.4 | 16.3 | 13.9–19.1 | 19.8 | 17.1–22.3 | 35.2 | 30.0–40.7 |
| 14 | 3 | 12 | 43 | 25.8 | 22.3–29.5 | 16.9 | 14.7–19.7 | 21.2 | 18.5–24.0 | 36.1 | 32.0–40.7 |
| 15 | 3 | 11 | 35 | 25.4 | 19.6–32.4 | 12.9 | 9.7–16.6 | 22.4 | 18.1–27.4 | 39.4 | 32.3–47.1 |
| 16 | 2 | 12 | 48 | 26.4 | 21.9–31.5 | 16.4 | 13.5–19.4 | 20.9 | 17.6–23.8 | 36.3 | 30.3–42.3 |
| 17 | 4 | 21 | 65 | 28.1 | 24.4–32.2 | 19.5 | 16.9–22.6 | 22.0 | 19.0–24.9 | 30.4 | 26.9–34.6 |
| 18 | 2 | 15 | 42 | 28.3 | 23.7–34.0 | 18.3 | 15.1–21.4 | 20.8 | 17.4–24.0 | 32.6 | 27.1–38.6 |
| 19 | 2 | 6 | 24 | 24.8 | 19.7–30.8 | 15.0 | 11.4–18.8 | 19.9 | 15.8–24.1 | 40.3 | 33.2–47.5 |
| 20 | 5 | 15 | 63 | 23.5 | 19.5–27.8 | 16.1 | 13.6–19.1 | 20.0 | 17.5–22.5 | 40.5 | 35.3–46.0 |
| 21 | 5 | 12 | 36 | 25.6 | 21.3–30.4 | 17.0 | 13.9–20.2 | 21.1 | 17.1–24.7 | 36.3 | 30.8–41.5 |
| 22 | 2 | 12 | 43 | 25.5 | 22.1–29.1 | 17.2 | 14.7–19.7 | 22.8 | 19.8–25.8 | 34.6 | 30.4–38.9 |
| 23 | 5 | 9 | 27 | 28.9 | 23.6–34.4 | 17.1 | 14.1–20.9 | 20.2 | 17.2–24.0 | 33.8 | 28.4–40.0 |
| 24 | 4 | 9 | 21 | 37.6 | 31.9–43.4 | 20.9 | 17.5–24.0 | 17.8 | 15.0–21.2 | 23.8 | 19.8–28.3 |
| 25 | 3 | 18 | 76 | 30.2 | 26.5–34.0 | 17.5 | 15.4–19.8 | 19.5 | 17.4–22.0 | 32.8 | 28.9–36.9 |
| 26 | 4 | 21 | 72 | 29.5 | 26.1–33.1 | 22.4 | 20.1–24.9 | 23.3 | 20.5–26.2 | 24.8 | 21.6–28.0 |
| 27 | 4 | 18 | 49 | 30.6 | 25.8–35.3 | 17.8 | 15.2–20.5 | 19.9 | 16.8–23.1 | 31.7 | 27.1–36.8 |
| 28 | 3 | 6 | 31 | 31.0 | 25.5–37.2 | 15.8 | 13.1–19.2 | 18.1 | 15.0–21.5 | 35.0 | 28.2–42.1 |
| 29 | 4 | 12 | 36 | 29.0 | 23.4–35.1 | 21.1 | 17.8–24.7 | 23.3 | 19.9–27.6 | 26.7 | 21.9–32.2 |
| 30 | 5 | 6 | 35 | 33.7 | 30.3–37.3 | 19.4 | 17.0–21.9 | 21.5 | 19.0–23.9 | 25.4 | 22.5–28.5 |
| 31 | 3 | 9 | 26 | 30.8 | 25.6–36.3 | 15.5 | 12.6–18.8 | 20.4 | 17.6–24.1 | 33.3 | 27.7–38.9 |
| 32 | 2 | 12 | 37 | 27.7 | 23.3–32.9 | 16.4 | 13.1–19.9 | 22.3 | 18.0–26.1 | 33.7 | 27.9–40.0 |
| 33 | 4 | 21 | 54 | 25.7 | 22.1–29.7 | 21.7 | 19.0–24.4 | 25.4 | 22.2–28.5 | 27.3 | 23.6–31.5 |
| 34 | 2 | 18 | 65 | 22.3 | 18.7–26.3 | 16.1 | 13.3–18.8 | 25.3 | 22.–28.7 | 36.3 | 31.6–41.2 |
| 35 | 3 | 9 | 43 | 21.0 | 17.1–25.5 | 12.4 | 9.6–15.3 | 22.3 | 19.3–25.2 | 44.3 | 37.6–51.6 |
| 36 | 3 | 9 | 43 | 31.4 | 25.9–37.5 | 16.6 | 13.7–19.5 | 19.2 | 16.0–23.0 | 32.8 | 27.0–39.2 |
| 37 | 3 | 9 | 38 | 23.3 | 19.2–27.7 | 16.5 | 13.–19.9 | 22.4 | 19.4–25.5 | 37.8 | 32.8–43.7 |
| 38 | 4 | 12 | 47 | 30.0 | 26.3–34.3 | 18.8 | 16.6–21.1 | 20.9 | 18.0–23.7 | 30.3 | 26.2–34.2 |
| 39 | 2 | 9 | 30 | 27.1 | 23.1–31.3 | 18.5 | 15.4–21.9 | 24.0 | 21.0–27.5 | 30.4 | 26.3–34.9 |
| 40 | 3 | 15 | 56 | 27.9 | 24.9–30.9 | 17.7 | 15.7–19.9 | 21.8 | 19.8–23.7 | 32.6 | 29.7–35.8 |
1: Red Cross hospitals, 2: University hospitals, 3: Private hospitals, 4: Public hospitals, 5: National hospitals.
Mean: closed part-wise geometric means, 95 % CI: 95 % bootstrap confidence envelopes.
Bold values indicate the highest culture archetypes in each hospital.
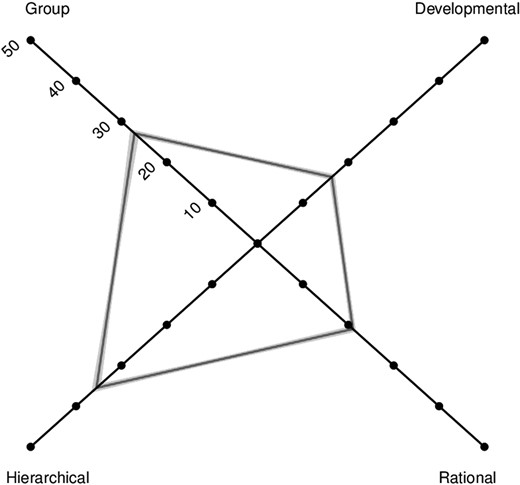
Organizational culture profile for total sample (N = 1758); closed part-wise geometric means and 95% bootstrap confidence envelopes.
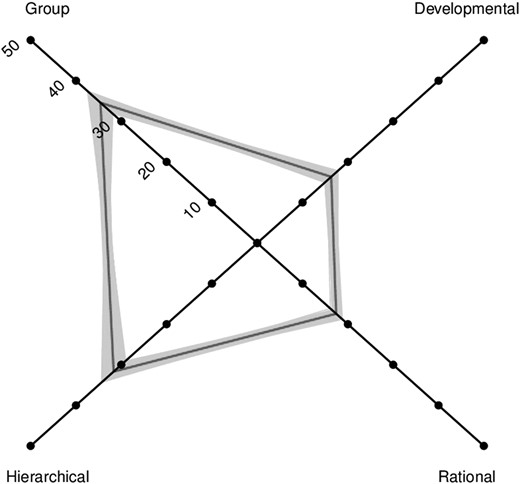
Organizational culture profile for total physician sample (N = 289); closed part-wise geometric means and 95% bootstrap confidence envelopes.
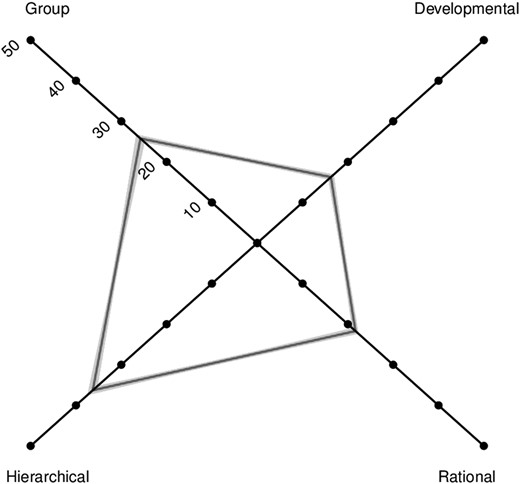
Organizational culture profile for total nurse sample (N = 1469); closed part-wise geometric means and 95% bootstrap confidence envelopes.
Association between culture archetypes and organizational/individual factors
Units with a dominant Hierarchical culture had a slightly higher median number of physicians (median = 7, minimum = 4, max = 14) than dominant Group culture (median = 6, minimum = 3, max = 12) among physicians. Units with a dominant Group culture had a higher median number of beds (median = 12, minimum = 6, max = 21) than dominant Hierarchical culture (median = 9, minimum = 6, max = 30). There were no differences in work hours per week (Group median = 70.9, Hierarchical median = 71.0) and work engagement (Group median = 3.4, Hierarchical median = 3.3). Among units with dominant Hierarchical culture among nurses, public hospitals had a higher number of nursing staff (median = 40.5, minimum = 21, max = 68) than other hospitals (university hospitals: median = 37.0, minimum = 18, max = 61; private hospitals: median = 36.0, minimum = 21, max = 65; national hospitals: median = 30.0, minimum = 21, max = 57). Nurses’ work engagement was slightly higher in units with dominant Group culture (median = 2.8, minimum = 2.5, max = 3.3) than units with dominant Hierarchical culture (median = 2.6, minimum = 2.1, max = 3.0). There was no difference in the number of beds depending on dominant culture archetypes (Group: median = 12, minimum = 6, max = 24, Hierarchical: median = 12, minimum = 6, max = 30).
Discussion
This is the first study to assess organizational cultures in a large number of NICUs in Japan. We analyzed ipsative data of the CVF by taking into account its nature. Our findings revealed that dominant culture varied according to occupation. Group and Hierarchical cultures were both strong among physicians, while Hierarchical culture was stronger among nurses. The high Hierarchical culture scores had a positive association with the number of physicians. Nurses were likely to experience greater work engagement when working in units that emphasized Group values.
Physicians identified strongly with cultures emphasizing cohesiveness (group) and rules (hierarchical), which is partially consistent with previous findings that showed Canadian physicians working in NICUs gave their units a significantly higher hierarchical culture score. Mahl et. al argued that this can be explained by the uniquely specialized setting of the level III NICU, which manages the care of extremely premature or critically ill babies and so is generally a more protocol-focused setting with standardization of practice (Hierarchical) [23]. Teamwork is also highly important in life-threatening and time-critical situations such as the NICU, where a team requires clear communication and collaborative actions to avoid needless morbidity and mortality [42, 43]. This feature is clearly related to the other dominant culture (Group) of physicians.
Previous research in adult patients reported that points were equally distributed to four culture archetypes when assessing nurse culture in medical/surgical units [44]. In a survey on nursing staff of 11 dementia units in 11 Dutch nursing homes, 56% of nursing staff scored highest on Group culture, 28% scored highest on Hierarchical, 9% scored highest on Developmental and 7% scored highest on Rational culture [45]. In contrast, we found that nurses placed high value on Hierarchical culture. This result is most likely due to the characteristics of hospital nurses belonging to a nursing department. Nursing departments, particularly in Japan, expect nurses to carry out various management roles, which differ from other departments where nursing activities take place [46]. In addition, group size may influence culture. One report showed that large hospitals with subspecialty services tended to be more hierarchical than smaller hospitals [47].
In this study, Hierarchical culture was dominant in most units overall. This result may be influenced by the high value that nurses place on this culture archetype, yet this is inconsistent with Canadian surveys in which 34 NICUs placed a higher emphasis on Developmental culture [48]. Regarding the association between Group culture and work engagement in nurses, a collaborative work environment of trust and unity might have influenced their motivation. This is consistent with previous findings that group culture values are positively related to job involvement and job satisfaction [4, 24]. On the other hand, according to Shimazu [33], work engagement and burnout may be considered opposite in the sense that they represent a positive (work engagement) and a negative (burnout) aspect of health-related well-being. If work engagement is assumed to be negatively related to burnout, nurses working in units with dominant Hierarchical culture may be more likely to burnout. It is important to take into account individual factors from both positive and negative aspects to explore the implementation of quality management and activities in different culture types.
There are few limitations in this study. The generalizability of our findings is unknown since we studied only NICUs that participated in the randomized controlled trial. Additionally, although the instrument has been adopted to measure culture in healthcare organizations, it has not been confirmed whether the dimensions are relevant to the Japanese context until it is examined qualitatively how health professionals perceive their organization.
Nonetheless, our results demonstrated a variation in perceived values across different units and occupations. It has been suggested that allowance must be made among professional groups such as nurses or physicians for the co-existence of multiple and heterogeneous values inside health organizations [49]. The inconsistency of cultural perceptions among different occupations has been observed in previous research on safety culture in Japan [50]. Although members in an organization belong to the same team, it is important to collect data from all members, and to understand the similarity and difference of cultures by positions or occupations. The importance of variety of respondents has also been suggested by authors, who concluded that the type of organizational culture was not associated with the development of quality management in a multi-country survey that measured organizational culture among only senior managers in European hospitals [51]. Identifying the strengths and weaknesses of organizational culture before initiating quality of care in practice is particularly useful for managers who struggle to improve patient outcomes. Otherwise, the implementations may become counterproductive. Strategy implementation for improving quality of care must differ by the type of organizational culture.
Conclusion
Our findings showed that organizational culture in NICUs varies depending on occupational group and team size. Group and Hierarchical cultures predominate among physicians, while Hierarchical culture is dominant among nurses. Units with strong cohesion and a participatory environment seem to achieve greater work engagement among nurses. Assessing organizational culture will provide insights into quality improvement strategies in healthcare.
Authors’ contributions
H.S. administered the survey, acquired the data, performed the statistical analysis and prepared the draft. N.Y. provided supervision of the study design, the data analysis and interpretation. R.M. supervised the design of the study. T.Ni. and S.K. managed the whole research processes. T.Na. supervised the data analysis and critically revised the manuscript for important intellectual content. All authors were involved in critical commentary and approved the final version of the manuscript.
Acknowledgments
The authors are deeply appreciative of the methodological supervision provided by Dr. Frans M. van Eijnatten (Eindhoven University of Technology, Netherlands). In addition to thanking all physicians and nurses who generously participated in this study, we would like to acknowledge the contribution of the research head office, Dr. Atsushi Uchiyama and Dr. Hideko Mitsuhashi (Tokyo Women's Medical University, Japan). We would also like to thank Dr. Julian Tang and Ms. Emma Barber of the Department of Education for Clinical Research, National Center for Child Health and Development, for proofreading and editing this manuscript.
Funding
This study was supported by Health and Labour Sciences Research Grants in FY2012 (H23-Iryo · Shitei-008) funded by the Ministry of Health, Labour and Welfare, Japan. The funder had no role in the study design, data collection and analysis, decision to publish, or preparation of the manuscript.
References
Improvement of NICU Practice and Team Approach Cluster randomized controlled trial (INTACT) (in Japanese): http://www.nicu-intact.org/about-research.html (10 September 2015, date last accessed).
