


Abstract
Limited studies have examined the effect of prenatal exposure to particulate matter with diameter of <2.5 µm (PM2.5) and <1 μm (PM1) on fetal growth using ultrasound measurements with inconsistent results. No study has evaluated the joint effect of the indoor air pollution index and ambient particulate matter on fetal growth.
We conducted a prospective birth cohort study in Beijing, China in 2018, including 4319 pregnant women. We estimated prenatal PM2.5 and PM1 exposure using a machine-learning method and calculated the indoor air pollution index based on individual interviews. Gender- and gestational age-adjusted Z-score of the abdominal circumference (AC), head circumference (HC), femur length (FL) and estimated fetal weight (EFW) was calculated and then undergrowth was defined. A generalized estimating equation was used to evaluate the individual and joint effect of indoor air pollution index, PM2.5 and PM1 on fetal Z-score and undergrowth parameters.
One unit increase in the indoor air pollution index was associated with −0.044 (95% CI: −0.087, −0.001) and −0.050 (95% CI: −0.094, −0.006) decrease in the AC and HC Z-scores, respectively. PM1 and PM2.5 were associated with decreased AC, HC, FL and EFW Z-scores, and higher risk of undergrowth. Compared with exposure to lower PM1 (≤ median) and no indoor air pollution, those exposed to higher PM1 (> median) and indoor air pollution had decreased EFW Z-scores (β = −0.152, 95% CI: −0.230, −0.073) and higher risk of EFW undergrowth (RR = 1.651, 95% CI: 1.106, 2.464). Indoor air pollution and ambient PM2.5 exposure had a similar joint effect on the Z-scores and undergrowth parameters of fetal growth.
This study suggested that indoor air pollution and ambient PM exposure had individual and joint negative effects on fetal growth.
We first studied the joint effect of indoor and ambient air pollution on fetal growth.
Indoor and ambient air pollution had individual negative effects on fetal growth.
Indoor and ambient air pollution had joint negative effects on fetal growth.
Introduction
Fetal growth is an important indicator of perinatal and post-natal health.1 Poor fetal growth is associated with higher risk of obesity and respiratory and cardiovascular diseases not only in childhood but also in adulthood.2–4 Therefore, identifying modifiable risk factors of fetal growth could improve lifelong health.
More and more studies have found that air pollution exposure such as fine particulate matter (PM2.5) could result in low birthweight (LBW) and being small for gestational age (SGA).5,6 However, fetal growth is a continuous and dynamic process, and direct methods of assessment such as ultrasound measurement instead of birth outcome could provide better insight into the effect of air pollution on fetal growth.7
To our knowledge, only six studies have investigated the association between PM2.5 and ultrasound-measured fetal growth, having inconsistent results. Some studies have found that PM2.5 could significantly reduce fetal growth parameters [i.e. crown-lump length (CRL), abdominal circumference (AC), femur length (FL), biparietal diameter (BPD) and estimated fetal weight (EFW)] whereas others reported non-significant results.8–14 These studies were limited by only one measurement,8 small sample size,9,10 retrospective cohort design11 and not considering important confounders, such as physical activity behaviour and dietary intake.8,9,11–14 They were also hampered by exposure assessment using inverse distance weighting and the land use regression method,11,12 based on the centroid of the residence postcode instead of actual residential address13 and calendar year emissions rather than concentrations during actual pregnancy.13
Moreover, PM is a complex compound and a smaller diameter may exert a larger effect on human health.15 Previously we have found that PM1 could increase the risk of pre-term birth16 and further influence childhood growth, resulting in overweight and obesity at the age of 1 year.17 However, our previous study investigated the effect of PM1 on ultrasound-measured fetal growth without considering some important covariates such as physical activity and dietary intake, due to lacking relevant information in the retrospective cohort.18 It is of vital importance to investigate the association of PM1 and fetal growth after adjustment for important confounders.
Additionally, the evidence for the association between indoor air pollution and ultrasound-measured fetal growth is limited. Pregnant women spent longer at home and thus indoor air pollution may also be an important risk factor.19 A systematic review has shown that compared with using cleaner fuels like gas and liquid petroleum gas, using solid fuel and kerosene, which means increasing indoor air pollution, was associated with higher risk of pre-term birth (PTB), LBW, SGA, stillbirth and neonatal mortality.20 However, to our knowledge, only one study has investigated the effect of interventions lowering indoor air pollution on ultrasound-measured fetal growth and could not find significant associations.21 No studies have investigated the joint effect of indoor and ambient air pollution on fetal growth.
To fill in these research gaps, we conducted a prospective birth cohort study in Beijing, China with indoor air pollution index and particulate matter (PM2.5 and PM1, proxies of ambient air pollution) based on pregnant women’s residential addresses, to investigate the individual and joint effects of indoor and ambient air pollution exposure on ultrasound-measured fetal growth.
Methods
Study design and population
This study was embedded in the Peking University Birth Cohort in Tongzhou (PKUBC-T), which was a prospective birth cohort. From June 2018, PKUBC-T was conducted in Tongzhou, Beijing and aimed to investigate the short-term and long-term effect of pre-pregnant and prenatal exposure on mothers and their children in the first 6 years. This cohort was registered in ClinicalTrials.gov (NCT03814395). As shown in Supplementary Figure S1 (available as Supplementary data at IJE online), we included eligible pregnant women according to the following criteria: gestational age at enrolment was <14 weeks; maternal age ranged from 18 to 45 years; pregnant women planned to have antennal care and delivery in Tongzhou Maternal and Child Health Care Hospital of Beijing. The following pregnant women were excluded: pregnant women who were diagnosed with diabetes, hypertension, chronic hepatitis, heart diseases or kidney diseases before pregnancy (n = 100); pregnant women without complete information of resident address (n = 255); delivery outside Beijing (n = 356); loss to follow-up (n = 21); gemellary pregnancy (n = 43); pregnancy that ended in abortion or induced labour (n = 137); pregnancy that ended in stillbirth or birth defect (n = 86); gestational age at delivery of ≥43 weeks (n = 68); with birthweight Z-score of >6 (n = 13); ultrasound measurements were missing or Z-score was >6 (n = 28). Finally, 4319 women were included in data analyses. The map of the study area and the locations of residence addresses are shown in Supplementary Figure S2 (available as Supplementary data at IJE online), This study was approved by the institutional review boards at Peking University and all the participants have given informed consent (IRB00001052-18003).
Outcome measurements
The trained medical staff measured fetal AC, HC and FL in the routine ultrasound examinations during the second and third trimesters. Of the participants, 57.7% and 37.4% had three and two ultrasound examinations, and only 4.9% had one measurement. We used the Hadlock’s formula to calculate EFW: log10(EFW) = 1.326 – 0.00326*AC*FL + 0.0107*HC + 0.0438*AC + 0.158*FL.22 The gestational age when pregnant women had ultrasound examinations was calculated by using the measurement date minus the last menstrual period (LMP). Generalized Additive Models for Location, Scale and Shape were used to calculate the gender- and gestational age-adjusted fetal growth Z-score,23 which was described in detail previously.11 Undergrowth was defined when the fetal growth Z-score was less than –1.88 (<3rd percentile).24
Exposure assessments
Ambient air pollution
Daily PM1 and PM2.5 concentrations were predicted at a 0.01° × 0.01° spatial resolution (1 × 1 km) using the spatial statistical model with a machine-learning method, which was detailed in previous published studies.25,26 The details of the machine-learning method are shown in the Supplementary File (available as Supplementary data at IJE online). Briefly, the model was built based on satellite remote sensing data (daily satellite-observed aerosol optical depth from the MODIS satellite), meteorology data (e.g. temperature, relative humidity, barometric pressure and wind speed), land use data (percentage of urban cover and greenness) and other predictors. To evaluate the validity of our predictions, we performed a 10-fold cross-validation (CV) with ground measurements of PM1 and PM2.5 in Tongzhou district during 2018–2019 by randomly selecting four (11% of the total) stations as the validation set and the rest of the stations as the training set. We repeated this process 200 times and then calculated the overall adjusted R2 and root mean square error (RMSE). The results of 10-fold CV showed the R2 for the estimated daily PM1 and PM2.5 concentrations were 60% and 85%, respectively. The RMSE for daily PM1 and PM2.5 concentrations were 16.2 and 16.3 μg/m3, respectively. Each pregnant woman’s home address was geocoded into longitude and latitude, and then matched to the predicted daily PM1 and PM2.5 concentration grids. We calculated the average PM1 and PM2.5 concentration during the first trimester (from LMP to 13 weeks of gestation), the second trimester (from 14 weeks of gestation to ultrasound measurement date for ultrasound measurement in the second trimester and from 14 to 27 weeks of gestation for ultrasound measurement in the third trimester), the third trimester (from 28 weeks of gestation to ultrasound measurement date) and the whole pregnancy (from LMP to ultrasound measurement date).
Indoor air pollution
We used the method developed by Wang et al.27 to calculate the indoor air pollution index related to smoking, cooking and heating with slight modifications. The information on pregnant women’s active smoking, passive smoking, cooking and heating behaviours was collected by face-to-face interviews at enrolment. Pregnant women answered the following questions: Do you smoke in the past three months? (response options: Never; Used to smoke but quit currently; Smoking currently); Do you exposed to second-hand smoke in the past three months? (response options: Never; Less than 1 h/day; Between 1 and 2 h/day; More than 2 h/day); How many days do you cook at home? What is the main fuel for cooking at home? (response options: Natural gas; Liquefied petroleum gas; Electricity; Coal; Wood/straw); What is the way for heating at home? (response options: Collective heating; Individual heating with gas; Individual heating with electricity; Individual heating with coal; Individual heating with wood/straw); How frequently do you ventilate your house during the heating season? (response options: Always; Sometimes; Never). The indoor air pollution index due to smoking, cooking and heating were defined as follows. (1) Active smoking exposure: if pregnant women never smoked in the past 3 months, the active smoking exposure value was recorded as 0; if pregnant women used to smoke in the past 3 months while they did not smoke currently, the active smoking exposure value was recorded as 1; if pregnant women smoked currently, it was recorded as 2. (2) Passive smoking exposure: if pregnant women were never exposed to second-hand smoke in the past 3 months, the passive smoking exposure value was recorded as 0; otherwise, it was recorded as 1. (3) Cooking exposure: when the main fuel for cooking at home was coal or wood/straw, the cooking exposure value was recorded as 2 if pregnant women cooked at home for >5 days or recorded as 1 if for 3 or 4 days; otherwise, it was recorded as 0. (4) Heating pollution exposure: when the way for heating at home was individual heating with coal or individual heating with wood/straw, the heating exposure value was recorded as 2 if the house was never ventilated or recorded as 1 if it was sometimes ventilated; otherwise, it was recorded as 0. The indoor air pollution index was calculated by the sum of active smoking exposure, passive smoking exposure, cooking exposure and heating pollution exposure. If the indoor air pollution index was 0, indoor air pollution exposure was defined as No; otherwise, it was defined as Yes. Even though the indoor air pollution index was not validated, the previous study has demonstrated that each direct indicator of exposure (i.e. smoking, cooking and heating) had consistent health effects with each other and with the total exposure index.28 This supported the credibility of the indoor air pollution index. Future studies are needed to validate the indoor air pollution index.
Covariate assessments
Covariates were selected based on prior literature.8–14 The trained nurses measured and recorded pregnant women’s heights and weights at enrolment. Pre-pregnancy body mass index (BMI) was calculated as self-reported pre-pregnancy weight divided by the square of measured height (kg/m2). A face-to-face interview was conducted to collect participants’ information at recruitment, including maternal age (years), ethnicity (Han/Minority), employment status (employed/unemployed), maternal education level (low: uneducated, primary, secondary and high school/middle: junior college/high: university and above), parity (primipara/multipara), physical activity (low/middle/high) and dietary intake (kcal). Physical activity was assessed by the short form of the International Physical Activity Questionnaire.29 Dietary intake was calculated according to 24 h/day recall for two non-consecutive days.30 Pregnancy complications (i.e. gestational hypertension, gestational diabetes mellitus) and birth characteristics (i.e. gender and birth date of children) were collected from medical records. Daily temperature data were obtained from the National Oceanic and Atmospheric Administration (https://www.ncdc.noaa.gov/cdo-web/).
Statistical analyses
A generalized estimating equation (GEE), with a first-order autoregressive correlation structure (AR1), was used to analyse the individual and joint effects of ambient PM1, PM2.5 during the whole pregnancy and indoor air pollution index on fetal Z-score parameters (using identity as the link function) and fetal undergrowth parameters (using logit as the link function). First, a crude model was built without adjustment and then all the covariates mentioned above were adjusted in the adjusted model. We used a natural cubic spline with 4 degrees of freedom to adjust for ambient temperature based on the lower quasi-likelihood under the independence model criterion (QIC). The individual effect was expressed for an interquartile range (IQR) in PM1 (0.67 μg/m3) and PM2.5 (1.96 μg/m3) and for one unit in the indoor air pollution index. We evaluated the joint effect of ambient PM1, PM2.5 and the indoor air pollution index on both a multiplicative scale and an additive scale. Multiplicative interaction was tested by including the cross-product term between the indoor air pollution index and PM2.5 (or PM1). Additive interaction was tested by calculating the relative excess risk due to interaction (RERI), using the methods described by Knol and colleagues.31 Interaction was present when the cross-product term was statistically significant or the 95% CI of the RERI did not include 0.
We also analysed the trimester-specific effect of exposure on fetal growth in the second and third trimesters. For the fetal growth in the second trimester, we used generalized linear and logistic regression to analyse the effect of first-trimester exposure (from LMP to 13 weeks of gestation) and second-trimester exposure (from 14 weeks of gestation to ultrasound examination date) on the fetal growth Z-score and undergrowth (one measurement in the second trimester: from 20 to 24 weeks of gestation). For the fetal growth in the third trimester, we used the GEE to analyse the effect of first-trimester exposure (from LMP to 13 weeks of gestation), second-trimester exposure (from 14 to 27 weeks of gestation) and third-trimester exposure (from 28 weeks of gestation to ultrasound examination date) on the fetal growth Z-score and undergrowth (two measurements in the third trimester: from 29 to 32 weeks of gestation and from 37 to 41 weeks of gestation). Because of the consistent effect of PM1 and PM2.5 in the first trimester, we further analysed the joint effect of indoor air pollution and PM1 and PM2.5 in the first trimester on the fetal growth in the second and third trimesters, with generalized linear and logistic regression and the GEE, respectively.
All statistical analyses were performed with the statistical software R 4.0.2 (R Core Team 2020). A two-sided P-value of <0.05 was considered as statistically significant.
Results
Characteristics of study participants
The characteristics of the study population are shown in Table 1. The average maternal age was 29.17 ± 3.77 years and 44.2% were at a high education level. Most pregnant women were Han ethnicity (94.2%), primipara (60.3%) and employed (90.4%). About 7.6% and 31.7% of pregnant women were diagnosed as having gestational hypertension and gestational diabetes mellitus, respectively. The mean pre-pregnancy BMI was 22.47 ± 3.40 kg/m2. The newborns had a mean birthweight of 3364.94 ± 465.33 grams and a mean gestational age of 39.00 ± 1.52 weeks. A total of 48.8% of newborns were girls.
Characteristics of participants in the birth cohort
| Mean (SD)/number (percentage) | |
|---|---|
| Maternal characteristics | |
| Maternal age | 29.17 (3.77) |
| Maternal ethnicity (missing = 2) | |
| Han | 4066 (94.2%) |
| Minority | 251 (5.8%) |
| Maternal education level (missing = 4) | |
| Low (uneducated, primary, secondary and high school) | 873 (20.2%) |
| Middle (junior college) | 1536 (35.6%) |
| High (university and above) | 1906 (44.2%) |
| Employment status (missing = 4) | |
| Employed | 3900 (90.4%) |
| Unemployed | 415 (9.6%) |
| Parity | |
| Primipara | 2605 (60.3%) |
| Multipara | 1714 (39.7%) |
| Gestational hypertension | |
| Yes | 330 (7.6%) |
| No | 3989 (92.4%) |
| Gestational diabetes mellitus | |
| Yes | 1370 (31.7%) |
| No | 2949 (68.3%) |
| Pre-pregnancy BMI (missing = 2) | 22.47 (3.40) |
| Birth characteristics | |
| Gestational age (week) | 39.00 (1.52) |
| Birthweight (grams) | 3364.94 (465.33) |
| Gender of newborns | |
| Boy | 2211 (51.2%) |
| Girl | 2108 (48.8%) |
SD, standard deviation; BMI, body mass index.
Fetal growth parameters
Supplementary Table S1 (available as Supplementary data at IJE online) shows the fetal growth parameters at different gestational weeks. The Z-scores of AC were 0.02 ± 1.06, –0.07 ± 1.01 and –0.10 ± 1.01 at the gestational age of 23.22, 30.12 and 37.87 weeks, and the prevalence of AC undergrowth was 3.5%, 3.0% and 4.2%, respectively. The Z-scores of HC were 0.14 ± 1.05, 0.04 ± 1.02 and –0.03 ± 1.01, and the prevalence of HC undergrowth was 2.5%, 3.1% and 3.7%, respectively. The Z-scores of FL were 0.16 ± 1.05, 0.00 ± 1.02 and –0.13 ± 1.04, and the prevalence of FL undergrowth was 2.0%, 2.4% and 4.9%, respectively. The Z-scores of EFW were 0.10 ± 1.08, –0.04 ± 1.01 and –0.11 ± 1.01, and the prevalence of EFW undergrowth was 2.9%, 3.0% and 4.1%, respectively.
Exposure to air pollutants
As shown in Supplementary Tables S2 and Table S3 (available as Supplementary data at IJE online), the mean indoor air pollution index was 0.54 ± 0.67. The mean concentrations of PM1 and PM2.5 were 31.80 ± 0.67 and 50.80 ± 1.70 μg/m3, respectively. The mean temperature was 11.12 ± 2.36°C.
Individual effect of indoor air pollution index and ambient PM exposure on fetal growth parameters
Table 2 shows the individual effect of the indoor air pollution index or ambient PM during the whole pregnancy on fetal growth including Z-scores and undergrowth parameters. In the adjusted model, one unit increase in the indoor air pollution index was associated with −0.044 (95% CI: −0.087, −0.001) and −0.050 (95% CI: −0.094, −0.006) decrease in the AC Z-score and HC Z-score, respectively. An IQR (0.67 μg/m3) increase in PM1 was associated with a −0.023 (95% CI: –0.032, –0.014), −0.034 (95% CI: –0.043, –0.025), −0.037 (95% CI: –0.046, –0.028) and −0.035 (95% CI: –0.044, –0.026) decrease in AC, HC, FL and EFW Z-score, respectively, with 1.072 (95% CI: 1.027, 1.120), 1.070 (95% CI: 1.021, 1.121), 1.054 (95% CI: 1.009, 1.101) and 1.082 (95% CI: 1.035, 1.131) times higher risk of AC, HC, FL and EFW undergrowth, respectively. PM2.5 had similar significant effects on all Z-scores and undergrowth parameters. Supplementary Table S4 (available as Supplementary data at IJE online) shows the effect of a 10-μg/m3 increase in PM1 and PM2.5 on fetal growth Z-scores and undergrowth parameters. The effect of PM1 was a little larger than that of PM2.5. For example, a 10-μg/m3 increase in PM1 and PM2.5 was associated with a −0.484 (95% CI: −0.581, −0.386) and −0.207 (95% CI: −0.247, −0.167) decrease in EFW Z-scores, respectively. A 10-μg/m3 increase in PM1 and PM2.5 was associated with a 1.984 (95% CI: 1.218, 3.232) and 1.345 (95% CI: 1.103, 1.640) times higher risk of EFW undergrowth, respectively.
Individual effect of indoor air pollution index and ambient particulate matter exposure on fetal growth parameters
| Crude | Adjusteda | |||
|---|---|---|---|---|
| β/RR (95% CI) | P-value | β/RR (95% CI) | P-value | |
| Indoor air pollution index per 1 | ||||
| AC | ||||
| Z-score | –0.043 (–0.082, –0.004) | 0.031 | –0.044 (–0.087, –0.001) | 0.046 |
| Undergrowth | 1.089 (0.924, 1.283) | 0.308 | 1.090 (0.902, 1.316) | 0.373 |
| HC | ||||
| Z-score | –0.053 (–0.092, –0.014) | 0.008 | –0.050 (–0.094, –0.006) | 0.026 |
| Undergrowth | 1.106 (0.929, 1.317) | 0.257 | 1.151 (0.953, 1.391) | 0.145 |
| FL | ||||
| Z-score | –0.030 (–0.071, 0.011) | 0.149 | –0.020 (–0.066, 0.026) | 0.402 |
| Undergrowth | 1.105 (0.920, 1.328) | 0.285 | 1.116 (0.907, 1.372) | 0.298 |
| EFW | ||||
| Z-score | –0.048 (–0.090, –0.007) | 0.021 | –0.044 (–0.090, 0.002) | 0.059 |
| Undergrowth | 1.159 (0.965, 1.393) | 0.114 | 1.157 (0.947, 1.414) | 0.154 |
| PM2.5 per IQR (1.96 µg/m3) | ||||
| AC | ||||
| Z-score | –0.030 (–0.038, –0.022) | <0.001 | –0.032 (–0.042, –0.021) | <0.001 |
| Undergrowth | 1.071 (1.032, 1.110) | <0.001 | 1.102 (1.048, 1.158) | <0.001 |
| HC | ||||
| Z-score | –0.034 (–0.042, –0.026) | <0.001 | –0.041 (–0.052, –0.031) | <0.001 |
| Undergrowth | 1.059 (1.019, 1.099) | 0.003 | 1.081 (1.023, 1.142) | 0.006 |
| FL | ||||
| Z-score | –0.037 (–0.045, –0.029) | <0.001 | –0.046 (–0.056, –0.035) | <0.001 |
| Undergrowth | 1.033 (0.995, 1.072) | 0.094 | 1.061 (1.006, 1.119) | 0.030 |
| EFW | ||||
| Z-score | –0.040 (–0.048, –0.033) | <0.001 | –0.045 (–0.056, –0.035) | <0.001 |
| Undergrowth | 1.060 (1.019, 1.101) | 0.003 | 1.106 (1.050, 1.165) | <0.001 |
| PM1 per IQR (0.67 µg/m3) | ||||
| AC | ||||
| Z-score | –0.023 (–0.030, –0.017) | <0.001 | –0.023 (–0.032, –0.014) | <0.001 |
| Undergrowth | 1.053 (1.021, 1.086) | 0.001 | 1.072 (1.027, 1.120) | 0.002 |
| HC | ||||
| Z-score | –0.028 (–0.035, –0.022) | <0.001 | –0.034 (–0.043, –0.025) | <0.001 |
| Undergrowth | 1.049 (1.017, 1.083) | 0.003 | 1.070 (1.021, 1.121) | 0.005 |
| FL | ||||
| Z-score | –0.031 (–0.037, –0.024) | <0.001 | –0.037 (–0.046, –0.028) | <0.001 |
| Undergrowth | 1.031 (0.999, 1.063) | 0.056 | 1.054 (1.009, 1.101) | 0.018 |
| EFW | ||||
| Z-score | –0.032 (–0.039, –0.026) | <0.001 | –0.035 (–0.044, –0.026) | <0.001 |
| Undergrowth | 1.047 (1.013, 1.081) | 0.006 | 1.082 (1.035, 1.131) | 0.001 |
Adjusted for maternal age, ethnicity, employment status, maternal educational level, parity, pre-pregnancy overweight or obesity, gestational hypertension, gestational diabetes mellitus, alcohol drinking, physical activity, dietary calorie and ambient temperature. AC, abdominal circumference; HC, head circumference; FL, femur length; EFW, estimated fetal weight; IQR, interquartile range; PM2.5, particulate matter with diameter of <2.5 μm; PM1, particulate matter with diameter of <1 μm.
As shown in Supplementary Table S5 (available as Supplementary data at IJE online), PM1 and PM2.5 exposure in the first and second trimesters and the indoor air pollution index were associated with decreased fetal Z-scores and higher risk of fetal undergrowth in the second trimester, which was consistent with the effect of exposure during the whole pregnancy, whereas some estimates were not significant due to the limited sample size. For example, an IQR increase in PM1 in the first trimester and the second trimester was associated with a −0.358 (95% CI: –0.484, –0.232) and −0.610 (95% CI: –0.771, –0.450) decrease in the EFW Z-scores in the second trimester, respectively, with a 1.616 (95% CI: 0.777, 3.362) and 5.231 (95% CI: 2.072, 13.210) times higher risk of EFW undergrowth, respectively. As shown in Supplementary Table S6, PM1 and PM2.5 exposure in the first trimester and the indoor air pollution index were associated with decreased fetal Z-score in the third trimester and PM1 exposure in the second trimester was associated with higher risk of fetal AC and HC undergrowth in the third trimester. For example, one IQR increase in PM1 and PM2.5 in the first trimester and one unit increase in the indoor air pollution index were associated with a −0.167 (95% CI: –0.271, –0.064), −0.201 (95% CI: –0.324, –0.078) and −0.049 (95% CI: –0.098, –0.000) decrease in the EFW Z-scores in the third trimester, respectively. One IQR increase in PM1 in the second trimester was associated with a 4.211 (95% CI: 1.668, 10.630) and 2.456 (95% CI: 1.014, 5.944) times higher risk of AC and HC undergrowth in the third trimester, respectively.
Joint effect of indoor air pollution index and ambient PM exposure on fetal growth parameters
The joint effect of the indoor air pollution index and ambient PM1 exposure on fetal Z-score parameters is shown in Figure 1. Although there was no significant interaction, exposure to indoor air pollution and higher PM1 (> median) was significantly associated with lower fetal Z-scores. For example, compared with exposure to lower PM1 (≤ median) and no indoor air pollution (the indoor air pollution index was 0), the EFW Z-score was decreased in those exposed to lower PM1 (≤ median) and indoor air pollution (the indoor air pollution index was >0) with β of −0.075 (95% CI: −0.151, 0.001), those exposed to higher PM1 (> median) and no indoor air pollution with β of −0.130 (95% CI: −0.195, −0.065) and those exposed to higher PM1 (> median) and indoor air pollution with β of −0.152 (95% CI: −0.230, −0.073), respectively. Indoor air pollution and ambient PM2.5 exposure had a similar joint effect on fetal Z-score parameters (Figure2).
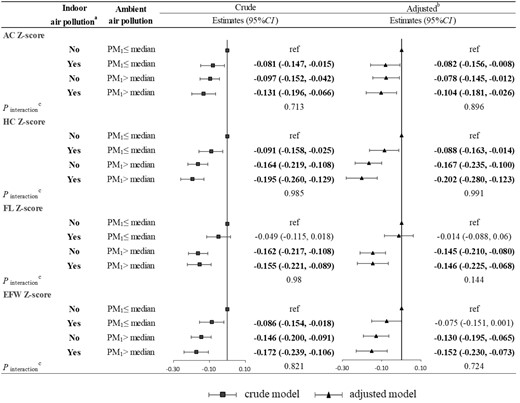
Joint effect of the indoor air pollution index and ambient PM1 on fetal Z-score parameters. (a) Indoor air pollution exposure was defined as No if the indoor air pollution index was 0; otherwise, it was defined as Yes. (b) Adjusted for maternal age, ethnicity, employment status, maternal educational level, parity, pre-pregnancy overweight or obesity, gestational hypertension, gestational diabetes mellitus, alcohol drinking, physical activity, dietary calorie and ambient temperature. (c) A Wald test was performed on the interaction terms to evaluate the interaction between the indoor air pollution index and ambient PM1. AC, abdominal circumference; HC, head circumference; FL, femur length; EFW, estimated fetal weight; PM1, particulate matter with diameter of <1 μm (PM1).
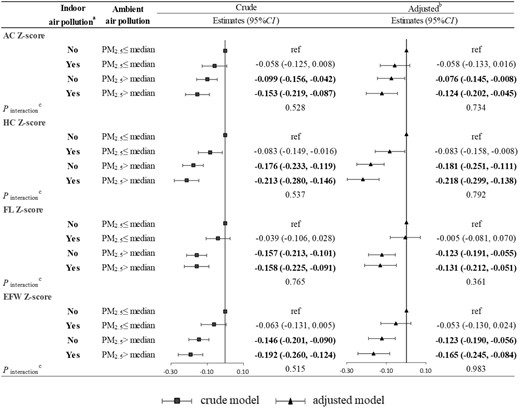
Joint effect of the indoor air pollution index and ambient PM2.5 on fetal Z-score parameters. (a) Indoor air pollution exposure was defined as No if the indoor air pollution index was 0; otherwise, it was defined as Yes. (b) Adjusted for maternal age, ethnicity, employment status, maternal educational level, parity, pre-pregnancy overweight or obesity, gestational hypertension, gestational diabetes mellitus, alcohol drinking, physical activity, dietary calorie and ambient temperature. (c) A Wald test was performed on the interaction terms to evaluate the interaction between the indoor air pollution index and ambient PM2.5. AC, abdominal circumference; HC, head circumference; FL, femur length; EFW, estimated fetal weight; PM2.5, particulate matter with diameter of <2.5 μm (PM2.5).
Figure 3 shows the joint effect of the indoor air pollution index and ambient PM1 exposure on fetal undergrowth. Exposure to indoor air pollution and higher PM1 (> median) was significantly associated with higher risk of undergrowth, but both multiplicative interaction and additive interaction were not statistically significant. For example, compared with exposure to lower PM1 (≤ median) and no indoor air pollution, risk ratios of EFW undergrowth were 1.256 (95% CI: 0.854, 1.848), 1.610 (95% CI: 1.096, 2.364) and 1.651 (95% CI: 1.106, 2.464) in those exposed to lower PM1 (≤ median) and indoor air pollution, those exposed to higher PM1 (> median) and no indoor air pollution, and those exposed to higher PM1 (> median) and indoor air pollution, respectively. Indoor air pollution and ambient PM2.5 exposure had a similar joint effect on fetal undergrowth (Figure 4).
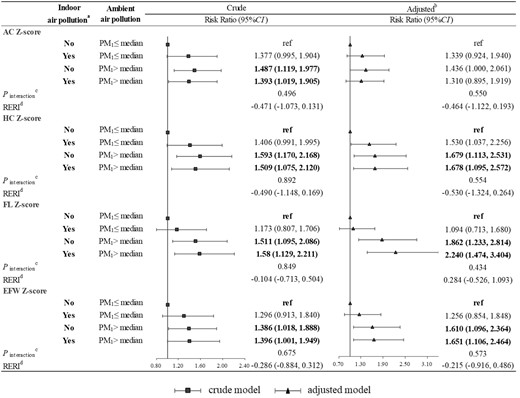
Joint effect of the indoor air pollution index and ambient PM1 on fetal undergrowth. (a) Indoor air pollution exposure was defined as No if the indoor air pollution index was 0; otherwise, it was defined as Yes. (b) Adjusted for maternal age, ethnicity, employment status, maternal educational level, parity, pre-pregnancy overweight or obesity, gestational hypertension, gestational diabetes mellitus, alcohol drinking, physical activity, dietary calorie and ambient temperature. (c) A Wald test was performed on the interaction terms to evaluate the interaction between the indoor air pollution index and ambient PM1. (d) Relative excess risk of fetal undergrowth due to interaction using the method of variance estimates recovery (MOVER) method. AC, abdominal circumference; HC, head circumference; FL, femur length; EFW, estimated fetal weight; RERI, relative excess risk due to interaction; PM1, particulate matter with diameter of <1 μm (PM1).
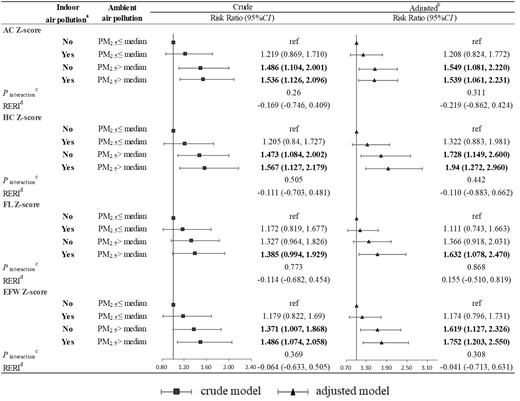
Joint effect of the indoor air pollution index and ambient PM2.5 on fetal undergrowth. (a) Indoor air pollution exposure was defined as No if the indoor air pollution index was 0; otherwise, it was defined as Yes. (b) Adjusted for maternal age, ethnicity, employment status, maternal educational level, parity, pre-pregnancy overweight or obesity, gestational hypertension, gestational diabetes mellitus, alcohol drinking, physical activity, dietary calorie and ambient temperature. (c) A Wald test was performed on the interaction terms to evaluate the interaction between the indoor air pollution index and ambient PM2.5. (d) Relative excess risk of fetal undergrowth due to interaction using the method of variance estimates recovery (MOVER) method. AC, abdominal circumference; HC, head circumference; FL, femur length; EFW, estimated fetal weight; RERI, relative excess risk due to interaction; PM2.5, particulate matter with diameter of <2.5 μm (PM2.5)
As shown in Supplementary Figures S3 and S4 (available as Supplementary data at IJE online), exposure to indoor air pollution and higher PM1 (or PM2.5) in the first trimester was significantly associated with lower fetal Z-scores in the second and third trimesters, whereas there was no significant interaction effect. For example, compared with exposure to lower PM1 and no indoor air pollution, EFW Z-scores in the second and third trimesters decreased in those exposed to lower PM1 and indoor air pollution with β of –0.098 (95% CI: –0.202, 0.007) and –0.103 (95% CI: –0.194, –0.013), those exposed to higher PM1 and no indoor air pollution with β of −0.241 (95% CI: −0.356, −0.126) and –0.119 (95% CI: –0.219, –0.019), and those exposed to higher PM1 and indoor air pollution with β of −0.228 (95% CI: −0.351, −0.104) and –0.122 (95% CI: –0.230, –0.014), respectively. As shown in Supplementary Figures S5 and S6 (available as Supplementary data at IJE online), we could not find a significant joint effect of PM1 (or PM2.5) in the first trimester and indoor air pollution on the risk of fetal undergrowth in the second and third trimesters.
Discussion
To our knowledge, the study was the first to simultaneously investigate the individual and joint effect of the indoor air pollution index and ambient PM exposure on fetal growth, based on longitudinal ultrasound measurements in a prospective birth cohort. We found that the indoor air pollution index was associated with lower AC, HC and EFW Z-scores and higher risk of AC undergrowth and HC undergrowth. Both PM1 and PM2.5 were associated with lower fetal growth, including Z-score parameters and undergrowth parameters. We also found that the indoor air pollution index and ambient PM exposure had a joint effect on fetal growth.
We found that PM2.5 exposure levels were inversely associated with fetal AC, HC, FL and EFW Z-scores in both the second and third trimesters. This finding was consistent with several previous epidemiological studies in China,11,12,14 although two other studies only observed significant associations between PM2.5 exposure and fetal growth in the second trimester9,10 and one found non-significant associations in all trimesters.13 Different ambient PM2.5 exposure levels as well as differences in the compositions of PM2.5 among these studies may partly explain the inconsistent findings. More importantly, variations in the sample size and exposure assessment methods indicated that some studies were underpowered. For example, Zhao et al. investigated 287 pregnancies in Shanghai, China and failed to find a significant effect of PM2.5 exposure on AC, HC and FL in the third trimester.10 Similarly, another study based on two cohorts with 678 and 227 participants also reported a non-significant association between PM2.5 and AC at 36 gestational weeks.9 Besides, a study in north-east Scotland was hampered by its exposure assessment methods in which PM2.5 was estimated by the centroid of participants’ address postcodes instead of the actual address and averaged yearly rather than during the actual pregnancy period.13 In addition, our study found that PM2.5 exposure levels could increase the risk of fetal undergrowth, which has not been reported before. The new finding may be partially attributed to the relatively high prenatal PM2.5 exposure level in our study population. What is more, our study was powered by its prospective cohort design with collecting data of many important confounders such as physical activity and dietary intake, which were commonly lacking in previous studies.9–14
The study was the first to explore the effect of PM1 on ultrasound-measured fetal growth in a prospective birth cohort. We found that PM1 was associated with both decreased fetal Z-scores and increased risk of fetal undergrowth. Similarly, previous studies have indicated that PM1 has an adverse effect on human health, including pre-term birth,16 respiratory health32 and cardiovascular disease.33 The reason why PM1 has deleterious health effects may be as follows. First, PM1 can penetrate deeper into the respiratory tract and access the gas-exchange region of lungs. Second, PM1 contains a large proportion of organic carbon that serves as a carrier of toxins and thus has higher concentrations of toxins.34 Therefore, the adverse effect of PM1 should be paid attention to and further studies are needed to elucidate the mechanism.
Although pregnant women spend most of their time indoors, particularly during the end period of pregnancy,19 there were very few studies investigating whether indoor air pollution exposure affected fetal growth in utero.21 Only one study in Nigeria randomized 324 women to the control group cooking with firewood/kerosene and the intervention group receiving a CleanCook stove and ethanol fuel. The study found that an intervention on indoor air pollution had no effect on fetal growth trajectories in utero.21 In this study, we observed a significant reduction in AC and HC in association with increasing the indoor air pollution index. More interestingly, we found the joint effect of indoor air pollution index and ambient PM exposure on fetal growth in utero. Pregnant women experience physiological changes, such as an increasing alveolar ventilation rate, which may make them more susceptible to air pollution exposures including indoor air pollution and ambient air pollution.35 Air pollutants could impair placental function by activating intrauterine oxidative stress and inflammation.36,37 Consequently, oxygen and nutrient transport through the placenta from mothers to fetuses decreases and further impairs fetal growth in utero.36
Our study finding is clinically important because fetal growth in utero could affect post-natal health. The lower AC and FL in the second and third trimesters were associated with higher blood pressure in children.38 Lower HC and EFW in the second and third trimesters were also reported to be associated with the motor behaviour development of children.39 In the context of the omnipresent nature of air pollution, especially considering the severe air pollution in China, it is crucial to control air pollution including indoor air pollution and ambient PM exposure.
There are some strengths to the study. It was the first study to evaluate the individual and joint effect of the indoor air pollution index and ambient PM exposure on fetal ultrasound-measured growth in utero. The well-conducted prospective birth cohort facilitated us to examine the effect of temporal exposure to indoor and ambient air pollution during pregnancy on fetal growth with adjustment for potentially important covariates. However, several limitations of the study should be noted. First, it is possible that there were residual confounders that were not accounted for. Second, we estimated the ambient PM exposure based on the pregnant woman’s residential address and did not consider the address of her workplace. However, pregnant women in the birth cohort usually live not far from the workplace because, as a suburb region of Beijing, the mean time to commute in Tongzhou district was <30 min.40 Therefore, the possibility of exposure misclassification may be small. Third, we did not measure the concentrations of indoor air pollution, although we did use a common way to assess the indoor air pollution index. Further studies are needed to measure the actual indoor air pollution concentrations and identify the effect of indoor air pollution on fetal growth.
Conclusion
In conclusion, the prospective cohort study suggested that indoor air pollution and ambient PM exposure had individual and joint negative effects on fetal growth. The findings provided evidence to develop public health policy to control both indoor and ambient air pollution to promote fetal growth.
Ethics approval
This study was approved by the institutional review boards at Peking University and all the participants have given informed consent (IRB00001052-18003).
Data availability
The data underlying this article will be shared on reasonable request to the corresponding author.
Supplementary data
Supplementary data are available at IJE online.
Author contributions
Shuang Zhou: Conceptualization, Methodology, Writing—original draft, Formal analysis. Yuming Guo: Methodology, Software, Writing—review &editing. Tao Su: Investigation, Resources, Writing—review & editing. Gongbo Chen: Methodology, Software, Writing—review & editing. Hui Liu: Methodology, Software, Writing—review & editing. Qin Li: Methodology, Software, Writing—review & editing. Heling Bao: Investigation, Resources, Writing—review & editing. Yuelong Ji: Resources, Writing—review & editing. Shusheng Luo: Investigation, Resources, Writing—review & editing. Zheng Liu: Investigation, Resources, Writing—review & editing. Hui Wang: Resources, Writing—review & editing. Jue Liu: Investigation, Resources, Writing—review & editing. Na Han: Investigation, Resources, Writing—review & editing. Haijun Wang: Supervision, Conceptualization, Project administration, Funding acquisition, Writing—review &editing.
Funding
The work was supported by the National Natural Science Foundation of China (grant no. 81973053). S.Z. was supported by the China Scholarship Council at the Erasmus University Medical Centre, Rotterdam, Netherlands (202106010220) as well as the Innovation Fund for Outstanding PhD Candidates of Peking University Health Science Centre.
Conflict of interest
None declared.

