


The Ontario Health Study (OHS) is a resource for investigating the ways in which lifestyle, the environment and genetics affect people’s health. It is one of the regional cohorts that collectively form the Canadian Partnership for Tomorrow’s Health (CanPath)—a pan-Canadian cohort with >330 000 participants. The linking of Canada’s rich collection of administrative health data with the cohort’s data represents a powerful means to disseminate high-quality, timely data.
From 2009 to 2017, the OHS recruited participants from the general population of Ontario through targeted recruitment strategies. Adult residents of Ontario aged ≥18 years were eligible for inclusion; the mean age at recruitment was 46 years (range: 18–97 years). A total of 225 620 people (137 918 female, 87 702 male) comprise the OHS baseline cohort.
At study entry, cohort members completed a questionnaire that collected information on socio-demographics, family history, health status, behavioural factors, lifestyle factors and self-reported anthropometry. A subset of participants provided blood samples and physical measures. A follow-up questionnaire was administered from 2016 to 2019, a work-history questionnaire in 2019, and COVID-19 questionnaires and dried blood spots were collected from 2020 to 2022. Biologic samples have supported genotyping and whole-genome sequencing, and repeat blood spots have supported COVID-19 serology studies. Participants are followed actively through questionnaires and passively via linked environmental and administrative health data.
Data and biosamples are available to researchers through a data and sample access process (e-mail: [email protected]).
Why was the cohort set up?
The prevalences of many chronic diseases—including cancer, cardiovascular disease, asthma and type 2 diabetes—have increased in Canada and many other countries over the past 30 years.1–4 In 2020, cancer and heart disease were the leading causes of death for Canadians, accounting for 48% of all deaths.5 About 37% of seniors (aged ≥65 years) have at least two common chronic diseases, with almost 50% of seniors aged ≥85 years suffering from multimorbidity.6 Chronic diseases are associated with high healthcare costs,7 rising complexity of care, long-term morbidity and mortality,8 and as such are major public health problems both in Canada and the rest of the world. A better understanding of their natural histories and complex and interrelated causes is needed to bring about the promise of disease prevention and early detection.
Established to facilitate prospective observational health research, the Ontario Health Study (OHS; OntarioHealthStudy.ca) is a longitudinal population-based regional cohort study, designed to assess an extensive range of exposures and a wide range of health-related outcomes over a long period of time. It serves as an integrated platform for investigating the interplay of environment, lifestyle and ‘-omic’ (such as genomics, metabolomics, transcriptomics, proteomics) factors that increase individual and community risk of developing cancer and other common adult diseases. The intent is to engage participants in ongoing data collection over their lifespan, to follow them over time both actively and passively, and to make genomic, environmental, lifestyle and electronic health-related data available to the scientific research community. Derived variables, including data generated from biologic samples, are returned to the cohort to further enrich the data holdings.
The OHS is a major contributing cohort within the national Canadian Partnership for Tomorrow’s Health (CanPath; CanPath.ca),9 a pan-Canadian cohort with >330 000 participants, that includes seven regional cohorts spanning all 10 provinces: BC Generations Project,10 Alberta's Tomorrow Project,11 Healthy Future Sask (Saskatchewan), Manitoba Tomorrow Project, CARTaGENE (Quebec)12 and the Atlantic Partnership for Tomorrow’s Health.13
Mandated recruitment goals were surpassed, and both the OHS and CanPath are the largest volunteer cohort studies ever conducted in Canada. The collection of baseline data, core biologic samples and physical measures was harmonized across CanPath.14 Close collaboration between cohorts provides a coordinated infrastructure, large scope and concomitant statistical power to address important scientific questions and capitalize on rapidly evolving high-throughput technologies. The provision of re-contact enables the cohort to be adaptive in supporting ongoing and future activities, including responses to emerging public health priorities such as the COVID-19 pandemic and the impact of climate change on health.
Who is in the cohort?
Adult residents of Ontario aged ≥18 years were eligible to participate in the OHS. Eligible participants had to be sufficiently proficient in English or French to provide informed consent and have access to the internet to complete the baseline questionnaire.
Participants were recruited primarily through invitation e-mails and letters (based on purchased and commercial mailing lists), e-mail invitations to employees at large organizations, advertising (i.e. newspaper ads, public transit ads, local media and social media, e.g. Twitter and Facebook), community events (e.g. farmer’s markers), through targeted recruitment initiatives in partnership with primary care providers (e.g. family medicine practices, Family Health Teams, community health centres) and other stakeholders (e.g. the YMCA, large companies, charities, disease advocacy groups, unions, and government agencies), incentive programmes (i.e. Air Miles, gift cards) and through friend and family referrals. The OHS partnered with the Canadian Alliance for Healthy Hearts and Minds Study to jointly recruit participants of African, Chinese and South Asian ethnicities using ethnically targeted recruitment strategies.15–17 Potential participants registered to participate in the OHS through the study’s website.
Participants provided informed consent to participate in the study; completed the baseline questionnaire; consented to share these data with other researchers; to link these data with regional, provincial, and national administrative and health-related databases; and to be re-contacted in the future for multiple study-related purposes.
The OHS also developed temporary, community-based study centres to collect biospecimens and physical measurements from new and existing OHS participants, to broaden the outreach of the OHS to under-represented portions of Ontario and allow the study to engage participants in regions with a substantial participant base. A local media campaign was conducted ∼2 weeks prior to the deployment of a community-based assessment centre to encourage participation from both current and potential new participants.
After a pilot phase, recruitment into the main phase of the OHS ran from September 2010 to March 2017 with 225 620 participants enrolled [137 918 (61%) female and 87 702 (39%) male]. The mean (SD) age at enrolment was 46 (15) years (Table 1), ranging from 18 to 97 years. At baseline, 40 034 participants (18%) provided a blood sample, 12 818 (6%) underwent a series of physical measurements and 12 600 (6%) provided urine samples. From 2020 to 2021, 9956 blood spots were collected, including 3164 from participants who did not provide a previous sample, increasing the total number of participants who have provided a biological sample to 43 198 (19%). Compared to the Ontario population aged ≥18 years, the study population is overrepresented for women (61% vs. 51%), overrepresented for adults with a university degree (77% vs. 55%) and under-represented for minority populations (20% vs. 33%), including immigrants (21% vs. 33%) (Table 1). The OHS is geographically diverse, with proportional representation from urban and rural areas across each of Ontario’s public health units (Figure 1).18 Less than 5% of OHS participants have asked not to be re-contacted; the majority of these participants indicated that the data and samples they have provided may continue to be used for research purposes.
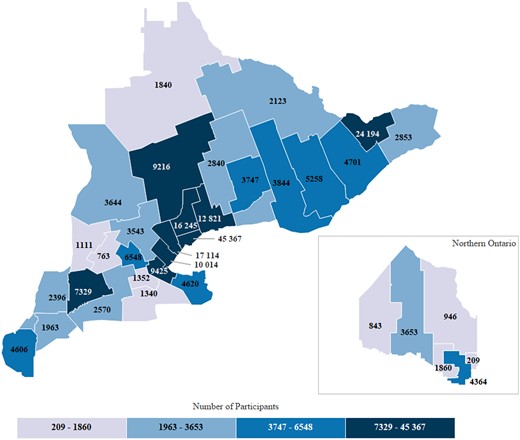
Geographical distribution of participants by Ontario public health unit, based on self-reported postal code at enrolment. The Ontario Health Study (OHS) has representation across each of Ontario’s public health units, with enrolment greatest in catchment areas for the City of Toronto Health Unit (n = 45 367), followed by the City of Ottawa Health Unit (n = 24 194) and Peel Regional Health (n = 17 114). Enrolment is roughly proportional to the size of the populations served
Socio-demographic characteristics in the Ontario Health Study (OHS) and the general population of Ontario, mean (SD) or %
| Characteristic | OHS | General population |
|---|---|---|
| (N = 225 620) | (N = 13 242 160)a | |
| Sex | ||
| Female | 61 | 51 |
| Male | 39 | 49 |
| Age (years) | 46 (15) | 41 |
| Country of birth | ||
| Canada | 72 | 68 |
| Other | 21 | 31 |
| Unknown | 7 | 2 |
| First language learned | ||
| English only | 83 | 67 |
| French only | 3 | 4 |
| Other | 14 | 29 |
| Education | ||
| < High school | 2 | 18 |
| High school | 22 | 27 |
| College | 30 | 27 |
| University | 32 | 20 |
| Graduate degree | 15 | 9 |
| Marital status | ||
| Married, living with a partner | 66 | 57 |
| Single, never married | 20 | 28 |
| Divorced/separated | 11 | 9 |
| Widowed | 3 | 6 |
| Anuual household income | ||
| <$25 000 | 12 | 13 |
| $25 000–$49 999 | 17 | 19 |
| $50 000–$74 999 | 20 | 21 |
| $75 000–$149 999 | 37 | 30 |
| ≥$150 000 | 15 | 16 |
| Ethnicityb | ||
| Not a visible minority | 80 | 67 |
| East Asian/Filipino/Asian | 11 | 20 |
| Indigenous | 3 | 4 |
| Black | 2 | 5 |
| Latin American | 1 | 1 |
| Arab | 1 | 2 |
| Multiple visible minorities | 1 | 1 |
| Other | 2 | 1 |
2016 Ontario census profile; restricted to include data for people aged ≥18 years.
Visible minorities: persons, other than Indigenous peoples, who are non-Caucasian in race or non-white in colour; multiple visible minorities: respondents who reported more than one visible minority group.
How often have they been followed up?
Participants are followed both actively and passively via linked administrative health data for their entire lifespan and have the option of selecting the communications they would like to receive through their participant home page. The first follow-up questionnaire was administered between November 2016 and April 2018, and was completed by 47 772 participants (21%). The work-history questionnaire was administered from March 2019 to December 2019 and was completed by 33 782 participants (15%). The COVID-19 questionnaire was made available online from May 2020 to November 2020 and was completed by 42 145 participants (23%), the first dried blood spots were collected from March 2021 to June 2021 from 9956 participants, and second dried blood spots were collected from October 2021 to July 2022, with third blood spots and corresponding questionnaires being collected presently.
Ontario has universal, publicly funded coverage for necessary physician and hospital services, and those aged ≥65 years have universal prescription drug coverage. ICES, a not-for profit provincial research institute (ices.on.ca), houses the electronic data repository consisting of record-level, routinely collected health data that is coded and linkable. Included are derived chronic condition cohorts developed at ICES using linked data algorithms applied to physician billing claims, hospitalization records, emergency department visits, outpatient procedures, day surgeries, prescription drug dispensation records from outpatient pharmacies and laboratory data sets. These sources include dates of service and diagnosis codes, where applicable. Hospitalization records, for example, include ≤25 diagnoses codes recorded using ICD-10-CA (i.e. enhanced Canadian revision) for each hospital stay. Emergency department visit records also include the chief complaint.
Linkage with administrative and health-related databases,37 including the Ontario Cancer Registry (OCR)38 and the ICES-derived cohorts of chronic conditions,39–47 allows passive follow-up of participants for future disease endpoints, as well the capture of a rich array of clinical data to support health services research (Box 1). The provision of a participant’s Ontario Health Insurance Plan (OHIP) number enables deterministic data linkage, and probabilistic linkage is carried out to link data sources for those who chose not to provide their OHIP number; 188 351 participants (83%) consented to administrative linkages and were successfully linked. Deaths are confirmed through linkage with the all-causes mortality file from the Ontario Registrar General. The OCR uses the collaborative staging method consistent with the tumour, node, metastasis staging system48 to capture cancer stage data elements which can be integrated with treatment data, and cancer histotype is coded using International Classification of Diseases for Oncology codes.49
Questionnaire data, physical measurements, biological samples and linked environmental and health data
Core questionnaire (n = 225 620)
Physical measurements (n = 12 818)
Follow-up questionnaires (n = 47 772)
Biological samples
| Lab values (n = 32 684)
Ecologic environmental measurements (n = 225 620)
Administrative health data (n = 188 351)
COVID-19 data (n = 42 145)
Genotyping/sequencing (n = 9600; ongoing activity) |
Prevalence and incidence rates of cancer, and of select chronic diseases and measures of health services utilization, are described in Tables 3 and 4, respectively, for the full cohort and for the subset who provided blood samples. Proportions of participants having a common chronic condition at baseline—for example stroke (2.5%), hypertension (23.8%) and asthma (15.1%) (Table 4)—were comparable to estimates of these conditions among Canadian adults (2.8%, 25.6% and 11.3%, respectively)50 and support cross-sectional analyses. Over an average 9-year period of follow-up, many incident cancers have been ascertained, including 1870 breast, 1699 prostate, 1049 lung and 969 colorectal cancer cases (Table 3). We have also ascertained 5496 incident strokes, 6773 incident type 2 diabetes cases and 3867 cases of asthma (Table 4). Sample sizes such as these enable a wide range of analyses and linkages are updated annually. Given the prospective blood collection, and the variability in time from blood collection to diagnosis (Supplementary Table S1, available as Supplementary data at IJE online), the study provides a unique opportunity to study a range of biomarkers related to disease aetiology and natural history. Polymerase chain reaction (PCR)-confirmed SARS-CoV-2 infections and reverse transcription–polymerase chain reaction (RT-PCR)-based COVID-19 test numbers were ascertained through linkage with the Ontario Laboratory Information Systems (Supplementary Figure S1, available as Supplementary data at IJE online), which will facilitate ongoing COVID-19 studies and those of the long-term effects of SARS-CoV-2 infection.
Prevalence and incidence of cancer in the Ontario Health Study, overall and among those who provided a blood samplea
| Cancer type | Total (N = 188 351)a | Provided blood (N = 38 799)a | ||||
|---|---|---|---|---|---|---|
| Prevalenceb | Incidencec,d | Prevalenceb | Incidencec | |||
| n | n | Per 100 000 person-years | n | n | Per 100 000 person-years | |
| Anal | 45 | 67 | 4.0 | 15 | 13 | 4.7 |
| Bladder | 321 | 580 | 34.7 | 97 | 126 | 46.0 |
| Bone and joint | 47 | 37 | 2.2 | 12 | 11 | 4.0 |
| Brain, spine and nervous systems | 146 | 208 | 12.4 | 22 | 50 | 18.2 |
| Breast (female) | 2535 | 1870 | 190.2 | 926 | 415 | 263.3 |
| Breast (male) | 13 | 19 | 2.9 | <5 | <5 | 1.8 |
| Cervical | 232 | 99 | 9.8 | 62 | 17 | 60.0 |
| Colorectal | 960 | 969 | 58.2 | 275 | 167 | 61.2 |
| Gastrointestinal | 160 | 378 | 22.6 | 49 | 68 | 24.7 |
| Heart and other intrathoracic | 31 | 41 | 2.4 | 9 | 11 | 4.0 |
| Haematobiliary | 42 | 232 | 13.8 | 13 | 48 | 17.5 |
| Haematologic | 469 | 956 | 57.2 | 139 | 217 | 79.3 |
| Lung | 280 | 1049 | 62.7 | 80 | 200 | 72.9 |
| Lymph node | 653 | 335 | 20.1 | 191 | 77 | 28.1 |
| Nasal cavity and sinuses | 17 | 22 | 1.3 | 6 | 6 | 2.2 |
| Ocular | 44 | 42 | 2.5 | 10 | 12 | 4.4 |
| Oral | 240 | 258 | 15.4 | 68 | 45 | 16.4 |
| Other urinary | 39 | 69 | 4.1 | 8 | 16 | 5.8 |
| Ovarian | 196 | 213 | 21.1 | 59 | 43 | 26.1 |
| Pancreatic | 44 | 281 | 16.8 | 14 | 74 | 26.9 |
| Prostate | 2194 | 1699 | 266.3 | 683 | 456 | 441.9 |
| Renal | 312 | 357 | 21.3 | 104 | 73 | 26.6 |
| Skin (melanoma) | 972 | 834 | 50.1 | 315 | 204 | 74.9 |
| Throat | 75 | 65 | 3.9 | 16 | 14 | 5.1 |
| Thyroid and other endocrinal | 829 | 522 | 31.3 | 285 | 93 | 34.1 |
| Tissues and abdominal cavity | 115 | 121 | 7.2 | 34 | 30 | 10.9 |
| Uterine | 468 | 540 | 53.6 | 176 | 134 | 81.8 |
| Other female genital | 74 | 77 | 7.6 | 28 | 14 | 8.5 |
| Other male genital | 180 | 73 | 11.0 | 41 | 11 | 10.1 |
Includes participants who consented to administrative linkages; mean (SD) age in years is 47 (15) overall and 57 (10) among those who provided a blood sample.
Ascertained through linkage with the Ontario Cancer Registry from 1 January 1964 through to date of enrolment; self-reported cancer history is also available.
Ascertained through linkage with the Ontario Cancer Registry covering the period from baseline to 31 March 2021.
Average follow-up time is 8.7 years; 1 634 839 total person-years of observation.
Prevalence and incidence of select chronic diseases and health services utilization in the Ontario Health Study, overall and among those who provided a blood samplea
| Chronic disease or health service | Total (N = 188 351) | Provided blood (N = 38 799) | ||||
|---|---|---|---|---|---|---|
| Prevalence | Incidenceb | Prevalence | Incidenceb | |||
| n | n | Per 100 000 person-years | n | n | Per 100 000 person-years | |
| Chronic diseases | ||||||
| Coronary artery disease | 26 599 | 13 639 | 983.6 | 7591 | 2752 | 1297.6 |
| Stroke | 4652 | 5496 | 339.7 | 1219 | 1139 | 432.2 |
| Ischaemic stroke | 4484 | 5344 | 329.9 | 1174 | 1116 | 422.9 |
| Hypertension | 44 827 | 16 775 | 1394.5 | 12 322 | 3109 | 1780.7 |
| Diabetes type 1 | 1271 | 1074 | 68.8 | 200 | 164 | 64.4 |
| Diabetes type 2 | 9404 | 6773 | 433.6 | 2188 | 1227 | 481.8 |
| Asthma | 28 472 | 3867 | 275.6 | 5454 | 627 | 267.1 |
| COPD | 11 159 | 7208 | 465.7 | 2883 | 1225 | 489.7 |
| Colitis | 3188 | 1800 | 109.7 | 864 | 305 | 113.7 |
| Crohn's | 3486 | 1202 | 73.3 | 862 | 184 | 68.5 |
| Dementia | 372 | 1764 | 105.8 | 119 | 296 | 108.3 |
| Congestive heart failure | 1932 | 2777 | 168.2 | 500 | 442 | 163.6 |
| Rheumatoid arthritis | 2133 | 1330 | 80.5 | 718 | 255 | 94.7 |
| HIV | 529 | 133 | 8.0 | 112 | 16 | 5.8 |
| Sepsis | 731 | 2680 | 161.0 | 186 | 429 | 157.1 |
| Pneumonia | 6551 | 7786 | 489.0 | 1445 | 1183 | 451.7 |
| Health services utilization | ||||||
| Hospitalizations | 105 829 | 61 434 | 3664 | 22 507 | 10 218 | 3712.9 |
| Mental health hospitalizations | 2566 | 2552 | 152.2 | 520 | 295 | 107.2 |
| Emergency department visits | 135 986 | 128 617 | 7670.8 | 29 123 | 24 960 | 9069.7 |
| Number of MRIs | ||||||
| 1 | 30 210 | 36 123 | 2360 | 2154 | 7697 | 2796.8 |
| 2 | 10 993 | 15 391 | 956.7 | 918 | 3285 | 1193.7 |
| 3 | 4682 | 7463 | 457.4 | 445 | 1486 | 540 |
| ≥4 | 5308 | 10 369 | 584.9 | 618 | 2149 | 780.9 |
Includes participants who consented to administrative linkages and were successfully linked; outcomes were ascertained through linkage to the validated disease registries developed by ICES; mean (SD) age in years is 47 (15) overall and 57 (10) among those who provided a blood sample.
Ascertained through linkage with the various disease cohorts/data sets covering the period from baseline to 31 March 2020 with the exception of congestive heart failure, which was ascertained through to 31 March 2019.
COPD, chronic obstructive pulmonary disease; HIV, human immunodeficiency virus; MRI, magnetic resonance imaging.
What has been measured?
A catalogue of the data collected, or available through linkages, can be found in Box 1. All questionnaires are available at OntarioHealthStudy.ca/for-researchers/whats-available.
Baseline and follow-up questionnaire data are collected using a web-based platform. Baseline data include personal and family health history; socio-demographic information; personal exposures to tobacco, alcohol and medications; and detailed information on ethnicity and country of origin (Box 1 and Table 2). The first follow-up questionnaire included an update on personal medical history and key exposures of interest, along with new questions, including those on e-cigarette and marijuana use, over-the-counter-medication use and mental health. A work-history questionnaire collected data on previous jobs, including type of job worked, physical demands of the job, exposure to hazardous materials (e.g. asbestos, arsenic, pesticides), commuting characteristics and the psychosocial environment of the workplace.
Baseline characteristics in the Ontario Health Study, overall and by sex, mean (SD) or %
| Characteristic | Male | Female | Total |
|---|---|---|---|
| (n = 87 702) | (n = 137 918) | (n = 225 620) | |
| Age group (years) | |||
| <25 | 7 | 9 | 9 |
| 25–34 | 14 | 18 | 17 |
| 35–44 | 17 | 20 | 19 |
| 45–54 | 22 | 24 | 23 |
| 55–64 | 23 | 20 | 21 |
| ≥65 | 17 | 9 | 12 |
| Body mass index (kg/m2) | 27.7 (4.4) | 26.7 (5.5) | 27.1 (5.1) |
| Smoking | |||
| Current | 13 | 14 | 13 |
| Former | 32 | 28 | 29 |
| Never | 55 | 58 | 57 |
| Marijuana use, evera | 52 | 55 | 51 |
| E-Cigarette use, evera | 5 | 6 | 5 |
| Physical activity (IPAQ short) | |||
| Low | 29 | 32 | 31 |
| Moderate | 30 | 34 | 32 |
| High | 40 | 35 | 37 |
| Fruit, vegetable and juice intake (servings/week) | 36 (20) | 40 (19) | 39 (20) |
| Alcohol intake (grams/day) | 19 (14) | 14 (11) | 16 (12) |
| Cancer screening, ever | |||
| FOBT | 47 | 37 | 41 |
| Colonoscopy | 37 | 30 | 32 |
| Sigmoidoscopy | 40 | 32 | 35 |
| PSA | 55 | NA | NA |
| Mammogram | NA | 55 | NA |
| PAP smear | NA | 94 | NA |
| Oral contraceptive use, ever | NA | 80 | NA |
| Post-menopausal | NA | 36 | NA |
| Sleep (hours/night) | 7.5 (1.5) | 7.0 (1.5) | 7.3 (1.5) |
| Physical measuresb | |||
| Waist-to-hip ratio | 0.9 (0.1) | 0.9 (0.1) | 0.9 (0.1) |
| Fat percentage (%) | 25 (6) | 35 (8) | 31 (9) |
| Height, standing (cm) | 176 (7) | 163 (6) | 169 (9) |
| Systolic blood pressure (mmHg) | 126 (15) | 118 (16) | 122 (16) |
| Diastolic blood pressure (mm Hg) | 78 (9) | 74 (10) | 76 (10) |
| Heart rate (bpm) | 68 (11) | 70 (10) | 69 (11) |
Restricted to the 21% of the study population who completed the first follow-up questionnaire.
Restricted to the 6% of the study population who provided physical measures.
NA, not applicable; IPAQ, International Physical Activity Questionnaire; FOBT, Fecal Occult Blood Test; PSA, Prostate Specific Antigen Test; PAP smear, Papanicolaou test.
Blood, urine and physical measures (Table 2) were collected from subsets of participants during recruitment (Box 1). Participants aged 30–74 years were eligible for the provision of a blood sample through one of the community-based assessment centres or through LifeLabs, a private medical laboratory. Willing participants provided 35 mL of blood; the type and time of the last caloric intake (meals and drinks other than water) were documented. Blood was fractionated into aliquots of serum, plasma, red blood cells and buffy coat, to support DNA extraction and omics analysis or testing for biomarkers. These aliquots are cryogenically stored at a biorepository for future analyses. A portion of the blood samples underwent immediate analysis to measure complete blood count and glycated haemoglobin (HbA1c). Samples from >9600 participants have been genotyped on the UK Biobank Axiom® array and low-pass whole-genome sequencing on Illumina platforms is ongoing, with 800 whole-genome sequences already completed and plans to sequence the remainder of participants who provided a blood sample.
The OHS has partnered with Statistics Canada’s Social Data Linkage Environment (SDLE) programme19 and the Canadian Urban Environmental Health Research Consortium (CANUE)20 to collect environmental data. CANUE has built a database of environmental factors (e.g. local air quality, amount of nearby traffic, access to green spaces, walkability, social deprivation, climate and weather) dating back to the 1980s for each postal code in Canada. The SDLE expands the potential of data integration across multiple domains (e.g. health, education, income) by creating linked analytical files without the need to collect additional information from participants. OHS participants’ previous residences have been identified through a residence reconstruction initiative using data from federal documents held at Statistics Canada. CANUE provides the environmental exposure data for each postal code to the SDLE; these data files are linked and the OHS is provided with the environmental exposure data (Box 1) (not the residential history itself) for each location of residence. Since an individual’s exposures to different environmental factors will change depending on his/her residential location, this methodology can considerably improve the accuracy of exposure estimates. Environmental exposure data will be updated over the course of follow-up. CANUE exposures are indexed to Canadian six-digit postal codes, which vary in size between urban (small postal code area) and rural (larger postal code) zones. More than 80% of the Canadian population live in densely populated urban areas, where postal codes typically cover one side of a city block.21 Residential exposures to ozone,22–26 air pollutants,23,27 night-time light23,28,29 and green spaces23,29–33 are highly variable across the study sample, yielding opportunities for environmental health-related research (Figure 2).34
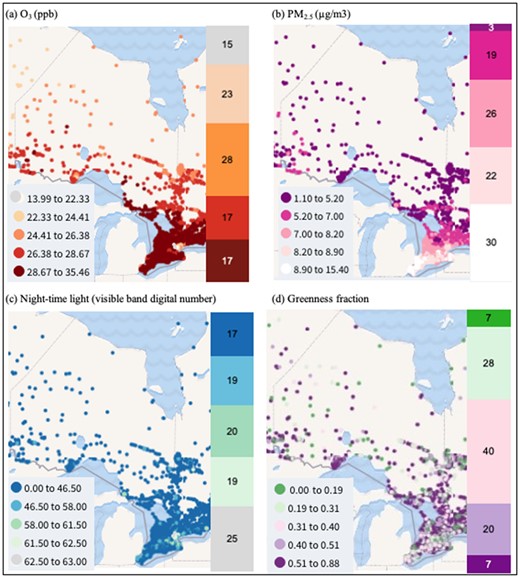
Distribution of the measures of O3, PM2.5, night-time light and greenness. From (a) to (d) are ozone (O3), fine particulate matter (PM2.5), night-time light and greenness, respectively. The left panel for each subfigure is the annual average concentrations for all of Canada (source: canuedata.ca/map.php), in which the filled circles in different colours are quintiles of the distribution. The right panel for each subfigure is the frequency distribution (%) in the Ontario Health Study (OHS)
In 2020, in response to the COVID-19 pandemic, an online questionnaire was launched (harmonized across CanPath) to collect data on: COVID-19 test results/suspected infection, symptoms experienced (if any), hospitalization or received medical care, current health status and risk factors, anthropometrics, potential source of exposure, impact of pandemic on job status and impact of pandemic on mental, emotional, social and financial well-being. In addition, serial dried blood spot cards were collected from almost 10 000 OHS participants and tested for antibodies to SARS-CoV-2 [anti-spike IgG, anti-receptor binding domain of spike (RBD) IgG and anti-nucleocapsid (N) IgG] using a set of standardized, high-throughput serological assays.35 Individuals participating in the serologic study also provided updated data on COVID-19 exposures and outcomes, along with new data on select occupations with highest risk of exposure to COVID-19, vaccination willingness, vaccine product(s) received and dates of vaccination.
A number of ancillary studies have been completed or are underway including one targeting ∼4000 OHS participants that will collect data on sleep and circadian function36 and a second among ∼3100 OHS participants that captured magnetic resonance imaging (MRI) scans of the brain, neck vessels, heart and abdomen, and collected data on cardiovascular risk factors.16
What has it found?
The OHS has supported a variety of research projects, across many disciplines, that sought to better understand the landscape of health and disease. A list of scientific publications can be found at OntarioHealthStudy.ca/for-researchers/research-findings.
A sampling of the research findings to date include the following.
In a study of the risk factors for early-onset breast cancer, low body mass index, lower parity and familial history of breast cancer were associated with increased risk of breast cancer diagnosed before age 50 years.51
Cross-sectional studies, investigating a diverse array of health outcomes showed that: diabetes was associated with MRI-identified vascular brain injury and cognitive impairment, implicating small vessel disease in particular as an important pathophysiological link between diabetes and cerebrovascular disease;52 atopic dermatitis was not associated with hypertension, type 2 diabetes, myocardial infarction or stroke, suggesting that it is not likely a major risk factor for cardiovascular disease;53 increased total physical activity, vigorous-intensity activity and walking were associated with decreased prevalence of obstructive sleep apnoea;54 ethnocultural minorities were more likely to report suffering from mental health issues but less likely to access treatment;55 and people who live in neighbourhoods with a higher density of trees on their streets report significantly higher health perception and significantly fewer cardiometabolic conditions.56
Several studies demonstrated the genomic utility of the programme. In a global biobank meta-analysis that included the OHS, polygenic risk scores (PRSs) calculated across cohorts consistently predicted endpoints better than a PRS derived from a single cohort alone.57
In another study, investigators identified discriminatory methylation signatures indicative of cancer in fragments of DNA shed by tumours and circulating in the bloodstream (ctDNA) up to 7 years prior to diagnosis by conventional techniques.58 Machine learning tools were applied not only to identify the presence of cancer, but also to pinpoint its source; the findings represent a remarkably promising step towards early cancer detection.58
In research related to the healthy aging of blood cells, study investigators developed a blood health phenotype risk score (derived from six complete blood count variables) and found that those with ‘healthy’ blood were less likely to be diagnosed with cardiovascular and cardiometabolic diseases, and with certain cancers.59 Further, transcriptomics of circulating immune cells revealed activation signatures in healthy and unhealthy blood phenotypes, and differential gene expression analyses indicated that upregulation of inflammatory genes was associated with unhealthy blood phenotypes.59 This work demonstrates the potential to uncover mechanisms related to the adverse effects of aging.
Another study was aimed at understanding how the age-associated acquisition of point mutations and somatic structural variants (SSVs) in blood—termed Age Related Clonal Hematopoiesis (ARCH)—affects health outcomes, including risk of haematological cancer.60 Researchers found that that ARCH attributed to SSVs is twice as frequent as previously reported with up to 1 in 10 individuals harbouring a large SSV and that selection affects the size and frequency of SSVs in the blood.60 This work advances our understanding of how the accumulation of somatic mutations in blood contributes to cancer risk.
Our COVID-19-related findings showed that: seropositivity was suboptimal after a single vaccine dose; the strongest antibody responses were elicited by full vaccination with Moderna (mRNA-1273), followed by Pfizer-BioNTech (BNT162b2), followed by AstraZeneca (ChAdOx1). Antibody levels were inversely associated with time since second vaccine dose, increasing age, history of cancer (particularly haematological malignancies), male sex; and individuals with previous SARS-CoV-2 infection elicited stronger antibody responses compared to those without, after adjusting for vaccination status.61
What are the main strengths and weaknesses?
The OHS has several defining characteristics that, taken together, make the study a unique and powerful international research resource: it is large in scale and comprises a diverse and inclusive sample of the Ontario population; is a longitudinal, comprehensive platform for investigator-initiated health research; has been online from the outset, enabling efficient data collection; and is closely integrated with core partners in Ontario who are conducting world-leading medical research.
The study has recruited ∼2% of the adult population of Ontario, including ethnically and geographically and age-diverse participants. In particular, the study has been successful in recruiting the younger age demographic (18- to 34-year-olds)—a group that has proven difficult to engage in many other large cohort studies. The study is inclusive and was open to participants regardless of illness or health, unlike general disease or clinical cohorts. The cohort comprises volunteers who were motivated to and interested in participating in a research study and there are demographic differences between the study sample and the general population. Nevertheless, much valuable, unbiased and generalizable research has come from cohort studies conducted within defined populations, particularly when there is sufficient heterogeneity in exposures of interest. Within our study population, we do, for example, capture variation in education, socio-economic status, ethnicity, geography and underlying health conditions, and will be able to both assess the association between these variables and outcomes of interest and statistically adjust for these variables, as necessary.
A weakness of one of our recruitment strategies, an incentive based on gift cards or Air Miles, is that while the incentive increased enrolment in the cohort, participants who were recruited using this strategy were less likely to contribute to follow-up studies or provision of biologic samples. We do, however, have a contingent of cohort members who are particularly engaged across study activities: of those who completed the follow-up questionnaire, 55% previously provided a blood sample and of those who completed the work-history questionnaire, 62% previously provided a blood sample. While this may mean that the OHS alone is not adequately powered for certain biospecimen-based research projects due to the relatively lower number of participants who provided biospecimens, issues regarding statistical power will be mitigated by the fact that the OHS is part of a much larger pan-Canadian population cohort that has >150 000 baseline biospecimens (with the OHS being the largest contributing cohort to CanPath’s biobank). The OHS and the other member cohorts of CanPath are committed to leveraging activities both across Canada and internationally. The OHS has, for example, made valuable contributions to meta-analysis activities across a number of biobanks to power genetic discovery.57,62
Participants are followed both actively and passively via linked administrative health data for their entire lifespan. Together with ICES, the OHS is providing comprehensive linked administrative clinical data from ICES’ rich data holdings of 13 million Ontarians (who together comprise 38% of the Canadian population) and offers an incomparably complete resource for epidemiological and outcomes research.37 Similar partnerships with Cancer Care Ontario have enabled annual updates on cancer incidence from the OCR.38 The OCR has a high level of data quality resulting from the fact that each Canadian province and territory has a legislated responsibility for cancer collection and control; overall, 1.7% of cases are diagnosed based on a death certificate only and 90.9% are microscopically confirmed.63 Stage capture rates have reached 90% for breast, prostate, colorectal, lung and cervical cancers.63
Assuming a sustainable funding model, the OHS is designed to run for many decades, with opportunities to augment the data with follow-up questionnaires, ancillary studies and additional measurements. Specifically, the OHS anticipates contacting participants for comprehensive dietary data collection, the absence of which limits both the questions that can be answered using the resource and the ability to adjust for the potential confounding effects of dietary intake.
Finally, as Ontario is recognized as a major world centre for medical research and is home to several universities and medical research institutes, key strategic partnerships have been formed that enhance the OHS. The OHS is housed at and funded, in part, by the Ontario Institute for Cancer Research, which also hosts the Global Alliance for Genomics & Health,64 the Genome Canada Technology Platform—the Canadian Data Integration Centre65—and is represented in the International Cancer Genomics Consortium.66 These partnerships are critical to supporting study priorities including the development of novel resources and genomic data sharing, genome informatics and participation in international cohort consortia. CanPath’s National Coordinating Centre is housed at the University of Toronto, which supports the growth of the cohort, and promotes the use of its data, on the national and international stage.
How can I get hold of the data? Where can I find out more?
Interested researchers should visit the OHS website (OntarioHealthStudy.ca) to view an up-to-date list of currently approved projects and read instructions for submitting a data and/or biosample access request.
Briefly, to request access, the researcher must fill out an access application form and submit it along with contact information, an ethics-approved research protocol, evidence of funding (if applicable), evidence of scientific peer-review (if available) and a brief CV of the Principal Applicant; this material is circulated for review by the data access committee. Applicants needing a letter of support for a grant or ethics submission should begin by submitting a preliminary access application. For studies requesting biological samples, priority will be given to those that are novel and exhibit scientific excellence as determined by the committee. Upon approval (and payment of relevant fees), access to data and/or biosamples will be granted for the length of time set out in the approved application. Finally, a data-use agreement will be executed between the researcher's institution and the OHS. Visit the OHS website for details related to OHS leadership and policies. Enquiries can also be submitted to [email protected].
The OHS does not hold administrative health data or cancer registry data. These data can be linked to OHS data through ICES (ices.on.ca/DAS) or Ontario Health (ccohealth.ca/en/access-data) and require separate access requests. Certain descriptive statistics, updated annually, can be provided to researchers to inform prospective projects. Researchers interested in access to data and samples from multiple regional cohort studies participating in CanPath should visit the website CanPath.ca.
Ethics approval
The OHS protocol is approved annually by the University of Toronto Health Sciences Research Ethics Board (Protocol #25450).
Data availability
The data underlying this article will be shared following OHS access request guidelines that can be found at ontariohealthstudy.ca/for-researchers/data-access-process/. This process includes approval of a research proposal by the data access committee, set up of a data-use agreement between the requestor’s institution and the OHS, and approval by the appropriate institutional review board.
Supplementary data
Supplementary data are available at IJE online.
Author contributions
All authors have contributed to the concept and design of the study; K.M., N.K., J.L., K.M., J.M., S.M., L.P., V.G., M.P. and P.A. contributed to implementing the cohort. V.K. conducted or directed the analysis of the data and took the lead in writing the manuscript with support from P.A., K.M. and K.S. All authors provided critical feedback and helped shape the research, analysis and manuscript.
Funding
The Ontario Health Study is supported by five government-funded organizations: the Ontario Institute for Cancer Research, which is funded by the Ontario Ministry of Training, Colleges and Universities; Ontario Health, which is funded by the Ontario Ministry of Health and Long-Term Care; Genome Canada, which is funded by the Federal Ministry of Innovation Science Exploration and Development, Public Health Ontario, which is funded by the Ministry of Health and Long-Term Care; and the Canadian Partnership Against Cancer, which is funded by Health Canada. The COVID-19 Initiative was funded by the Canadian Institutes for Health Research (grant 172762) and the COVID-19 Immunity Task Force (grant 2021-HQ-000095). CanPath is hosted by the University of Toronto’s Dalla Lana School of Public Health with national funding from the Canadian Partnership Against Cancer.
Acknowledgements
This study contracted ICES Data & Analytic Services and used de-identified data from the ICES Data Repository, which is managed by ICES with support from its funders and partners: Canada’s Strategy for Patient-Oriented Research (SPOR), the Ontario SPOR Support Unit, the Canadian Institutes of Health Research and the Government of Ontario. The opinions, results and conclusions reported are those of the authors. No endorsement by ICES or any of its funders or partners is intended or should be inferred. Parts of this material are based on data and information provided by Ontario Health (through its business division, Cancer Care Ontario); however, the analysis, conclusions, opinions and statements expressed herein are those of the author(s) and not necessarily those of Ontario Health. Calculated ozone, PM2.5, DMSP-OLS and NDVI metrics, indexed to DMTI Spatial Inc. postal codes, were provided by CANUE (Canadian Urban Environmental Health Research Consortium). The authors thank the participants who generously donated their time, information and biological samples, and the staff of the OHS for their important contributions.
Conflict of interest
None declared.
References
Statistics Canada. Census Profile, 2016: Health regions: public health units.
[dataset],
[dataset],
[dataset],
[dataset], USGS/Google,
[dataset], USGS/Google, 1984 to 2011; Data from: USGS Landsat 5 TM TOA Reflectance (Orthorectified), Dataset. https://explorer.earthengine.google.com/#detail/LANDSAT%2FLT5_L1T_TOA (8 July 2022, date last accessed).
[dataset], USGS/Google, 2013 to 2017; Data from: USGS Landsat 8 TOA Reflectance (Orthorectified), Dataset. https://explorer.earthengine.google.com/#detail/LANDSAT%2FLC8_L1T_TOA (8 July 2022, date last accessed).
[dataset], USGS/Google, 1984 to 2012; Data from: Landsat 5 TM Annual Greenest-Pixel TOA Reflectance Composite, Dataset. https://developers.google.com/earth-engine/datasets/catalog/LANDSAT_LT05_C01_T1_ANNUAL_GREENEST_TOA?hl=en (8 July 2022, date last accessed).
[dataset], USGS/Google, 2013 to 2015; Data from: Landsat 8 Annual Greenest-Pixel TOA Reflectance Composite, Dataset, https://developers.google.com/earth-engine/datasets/catalog/LANDSAT_LC08_C02_T1_TOA?hl=en (8 July 2022, date last accessed).

