


Abstract
Longitudinal assessment of the determinants of obesogenic growth trajectories in childhood can suggest appropriate developmental windows for intervention.
Latent class growth mixture modelling was used to identify body mass index (BMI) z-score trajectories from birth to age 6 years in 994 children from a prospective mother–offspring cohort (Chinese, Indian and Malay ethnicities) based in Singapore. We evaluated the early-life determinants of the trajectories as well as their associations with cardiometabolic risk markers at age 6 years.
Five BMI z-score trajectory patterns were identified, three within the healthy weight range, alongside early-acceleration and late-acceleration obesogenic trajectories. The early-acceleration pattern was characterized by elevated fetal abdominal circumference growth velocity, BMI acceleration immediately after birth and crossing of the obesity threshold by age 2 years. The late-acceleration pattern had normal fetal growth and BMI acceleration after infancy, and approached the obesity threshold by age 6 years. Abdominal fat, liver fat, insulin resistance and odds of pre-hypertension/hypertension were elevated in both groups. Indian ethnicity, high pre-pregnancy BMI, high polygenic risk scores for obesity and shorter breastfeeding duration were common risk factors for both groups. Malay ethnicity and low maternal educational attainment were uniquely associated with early BMI acceleration, whereas nulliparity and obesogenic eating behaviours in early childhood were uniquely associated with late BMI acceleration.
BMI acceleration starting immediately after birth or after infancy were both linked to early cardiometabolic alterations. The determinants of these trajectories may be useful for developing early risk stratification and intervention approaches to counteract metabolic adversities linked to childhood obesity.
In an Asian multi-ethnic prospective mother–offspring cohort (Indian, Chinese and Malay ethnicities), we identified two distinct obesogenic body mass index (BMI) z-score trajectory patterns in early childhood, which were both linked to early cardiometabolic alterations.
The early-acceleration trajectory pattern showed evidence of high fetal abdominal circumference growth velocity, growth acceleration immediately after birth and crossed the obesity threshold by age 2 years, whereas the late-acceleration trajectory pattern showed growth acceleration after infancy and approached the obesity threshold by age 6 years.
Indian ethnicity, high pre-pregnancy BMI, high polygenic risk scores for obesity and shorter breastfeeding duration were common risk factors for both groups.
Malay ethnicity and low maternal educational attainment were uniquely associated with early acceleration, whereas nulliparity and obesogenic eating behaviours in early childhood were uniquely associated with late acceleration.
The determinants of the obesogenic trajectory patterns may be useful for developing early risk stratification and intervention approaches to counteract metabolic adversities linked to childhood obesity.
Introduction
Accelerated growth in infancy and early childhood have been linked to obesity and impaired cardiometabolic health in adulthood.1–4 Nearly 90% of children who are overweight/obese in early childhood continue to be overweight/obese in adolescence.4 Unlike the risk for diabetes, the risk for coronary disease linked to adolescent obesity is not attenuated even if normal weight is achieved by adulthood, highlighting the importance of tracking childhood growth patterns.5 Given the rising rates of childhood obesity in Asia,6 a better understanding of the heterogeneity of obesogenic growth patterns in Asian populations, and of the prenatal and post-natal factors that drive them, can bring precision to international guidelines and preventive strategies being developed to tackle childhood obesity.7
In the Growing Up in Singapore Towards healthy Outcomes (GUSTO) prospective mother–offspring cohort,8 latent class growth mixture modelling (LCGMM) was used to identify group-based heterogeneous body mass index (BMI) trajectory patterns between birth and age 6 years. LCGMM allows group-based classification of developmental trajectories based on shared growth patterns, while allowing for within-class heterogeneity. We evaluated the associations of growth patterns with prenatal and post-natal risk factors, fetal growth, genetic risk of obesity, obesogenic eating behaviours, abdominal and ectopic fat (liver fat and intra-myocellular lipids) depots and cardiometabolic risk markers in early childhood.
Methods
Study population
The GUSTO cohort recruited 1450 (≥18 years of age) Chinese, Indian and Malay women with homogenous parental ethnicities in the first trimester from two major public maternity hospitals in Singapore.8 Exclusion criteria for the current analysis were pre-term birth (<37 weeks), multiple pregnancies or absence of at least one BMI assessment between birth and age 6 years. The final study sample consisted of 994 children. Owing to differential consent for imaging, cardiometabolic and behavioural assessments, these data were available in subsets of children as indicated in Supplementary Figure S1 (available as Supplementary data at IJE online).
Maternal and intrauterine measurements
We obtained information regarding ethnicity, parity, education, pre-pregnancy weight and age from questionnaires administered upon study enrolment in the first trimester. Pre-pregnancy BMI (ppBMI) was computed from maternal height measured during the 26th–28th weeks of pregnancy and self-reported pre-pregnancy weight. At the 26th–28th weeks, gestational diabetes mellitus (GDM) status was assessed using a 2-h 75-g oral glucose tolerance test9 based on the World Health Organization (WHO) 1999 guideline.10 Information about hypertensive disorders of pregnancy (pregnancy-induced hypertension, pre-eclampsia or eclampsia) were obtained from medical records. Serial weight measurements during pregnancy were used to calculate the linear rate of gestational weight gain (GWG) between 15 and 35 weeks of gestation.11 This was used to classify women into insufficient, normal or excessive rate of gestation weight gain categories based on the Institute of Medicine (IOM) 2009 guidelines.12 Fetal abdominal circumference (FAC) was measured from ultrasound scans in the second (Weeks 19–21) and third (Weeks 32–34) trimesters on standard views at the level of the stomach, where the umbilical vein enters the portal sinus. FAC velocity (FACV) was defined as the rate of change of FAC between second and third trimester in millimetres per week.
Polygenic risk scores for obesity
Umbilical cord DNA samples from the children were genotyped using the Illumina OmniExpress + exome array covering ∼1 million SNPs. The genotype data were used to derive polygenic risk scores (PRS) for obesity as described earlier.13
Breastfeeding and eating behaviours assessments
Breastfeeding duration data14 was recorded as a dichotomous variable: <3 vs ≥3 months of any (exclusive, predominant or partial) breastfeeding. Objectively measured child eating behaviours [eating rate (g/min), chewing (cycles/g), oral exposure time (s), energy intake (kcals) and eating in absence of hunger] were measured during an ad libitum laboratory lunchtime meal at age 4.5 years as described previously.15
Cardiometabolic assessments
Fasting blood collected at age 6 years was used to measure plasma glucose using the enzymatic hexokinase method and serum insulin using a sandwich immunoassay. Fasting glucose and insulin were used to calculate the homeostatic model assessment of insulin resistance (HOMA-IR).16 At age 6 years, having either pre-hypertension or hypertension was diagnosed using the simplified paediatric blood pressure threshold of 110/70 mmHg, which has been shown to perform as well as age, sex and height-standardized thresholds for predicting adulthood cardiovascular risk.17
Imaging of body fat depots
Subcutaneous adipose tissue (SAT) and intra-abdominal adipose tissue (IAT) volumes in children were assessed using magnetic resonance imaging (MRI) during the first 2 weeks after birth and at age 6 years.18,19 Magnetic resonance spectroscopy (MRS) was performed to measure intra-myocellular lipids (IMCL) in soleus muscle and liver fat in the children at the age of 6 years (detailed MRS protocols are provided in the Supplementary material, available as Supplementary data at IJE online).
Modelling of BMI z-score trajectories
Serial BMI measurements (birth, 3 weeks, 3, 6, 9, 12, 15, 18, 24, 36, 48, 54, 60, 66 and 72 months) were converted to age and sex standardized z-scores based on the 2006 WHO Child Growth Standards using the WHO Anthro macro for SPSS (v3.2.2, Jan 2011).20 LCGMM was used to derive heterogeneous groups of BMI z-score trajectories using Mplus Version 821 (detailed protocols for anthropometric assessments and LCGMM analysis are provided in the Supplementary material, available as Supplementary data at IJE online).
Statistical analysis
Statistical analyses were performed using IBM SPSS Statistics v23. Multiple imputation by fully conditional specification was used to handle missing values in exposures and covariates. The imputation model included all exposures, covariates and post-natal cardiometabolic assessments as predictors. Multinomial logistic regression was used to study the association of maternal antenatal exposures with the post-natal trajectory classification in a mutually adjusted model. Two additional multinomial logistic regression models were constructed to study the associations of breastfeeding duration (adjusted for ethnicity, maternal education, maternal ppBMI and GDM) and PRS for obesity (adjusted for ethnicity and sex) with the trajectory classification. Analysis of covariance was used to evaluate differences in continuous cardiometabolic outcomes and body fat depots at age 6 years and eating behaviours at age 4.5 years between the trajectory classes (adjusted for sex, parity, ethnicity, maternal education, ppBMI, GDM and GWG rate category). Binary logistic regression was used for dichotomous outcomes. The trajectory class with the largest number of participants was used as the reference group in all the above models. Complete case analyses (samples without missing covariates) for the above models are shown in the Supplementary Tables S2–S4 (available as Supplementary data at IJE online).
Results
Growth trajectories from birth to 6 years of age
Five growth trajectory patterns were identified (Figure 1). Three trajectory patterns were within the WHO BMI threshold for healthy BMI (–2 < BMI z-score < 1)20 and formed ∼86% of the cohort. Since these three growth trajectory patterns remained stable and only differed in their levels, we classified them as Stable Normal Low (SNL, 13.18%), Stable Normal (SN, 48.08%) and Stable Normal High (SNH, 26.56%). The remaining two trajectory patterns were characterized by BMI acceleration and a mean BMI at age 6 years above the ‘healthy range’. The early-acceleration (EA, 5.84%) trajectory showed BMI acceleration from birth, crossing the overweight threshold by age 1 year and the obesity threshold (+2SD) by age 2 years. The late-acceleration (LA, 8.35%) trajectory was close to the SN trajectory in the first year of life but subsequently showed BMI acceleration. This trajectory crossed the overweight threshold at 3 years of age and approached the obesity threshold by age 6 years. SNH and EA children had higher birthweights whereas SNL children had lower birthweights compared with SN children (Figure 1b). EA and SNH children had higher FACV than SN children whereas the FACV of LA children were similar to that of SN and SNL children (Figure 1c). Concordantly with their higher FACV, EA children also had elevated abdominal fat volumes at birth (Supplementary Table S5, available as Supplementary data at IJE online). The LCGMM analysis using cases without missing longitudinal BMI data also yielded a five-class solution with similar trajectory patterns (Supplementary Figure S3, available as Supplementary data at IJE online). The demographic and prenatal characteristics corresponding to the trajectory patterns are detailed in Table 1.
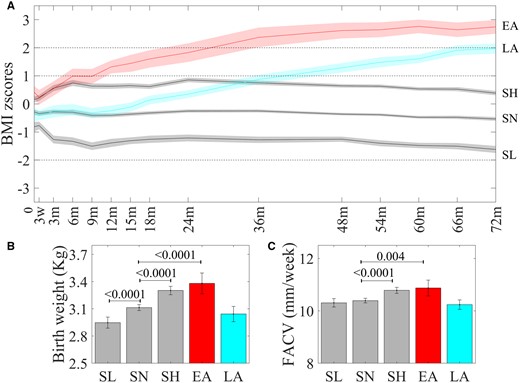
(a) Post-natal BMI trajectory classes. Differences in (b) birthweight and (c) fetal abdominal circumference velocity (FACV) across BMI trajectory classes.
Trajectory modelling revealed five distinct trajectory classes (N = 994). The three stable trajectories, Stable Normal Low (SNL), N = 131 (13.2%), Stable Normal (SN), N = 458 (46.1%), Stable Normal High (SNH), N = 264 (26.6%), stayed within the normal range of BMI [broken lines depict WHO thresholds for overweight (1SD), obesity (2SD) and thinness (–2SD) at age 6 years]. The early-acceleration [EA, N = 58 (5.8%)] trajectory showed BMI acceleration immediately after birth and crossed obesity threshold after 2 years of age. The late-acceleration [LA, N = 83 (8.4%)] trajectory was close the SN trajectory in the first year, started accelerating after age 1 year and was close to the obesity threshold by age 6 years. Mean birthweights (kg, N = 994) of SNH and EA children were higher and those of SNL children were lower than those of SN children. FACV (mm/week, N = 927) between second and third trimesters was higher in EA and SNH classes as compared with SN whereas LA and SNL classes have similar FACV to the SN class. Bonferroni corrected P-values are indicated.
Maternal, pregnancy, offspring and post-natal characteristics across the trajectory classes
| N | SNL | SN | SNH | EA | LA | |
|---|---|---|---|---|---|---|
| Maternal characteristics | ||||||
| Ethnicity | 994 | |||||
| Chinese | 68 (51.9) | 295 (64.4) | 149 (56.4) | 16 (27.6) | 35 (42.2) | |
| Malay | 24 (18.3) | 98 (21.4) | 81 (30.7) | 28 (48.3) | 18 (21.7) | |
| Indian | 39 (29.9) | 65 (14.2) | 34 (12.9) | 14 (24.1) | 30 (36.1) | |
| Maternal education | 981 | |||||
| Below secondary | 41 (31.8) | 122 (27.0) | 74 (28.5) | 26 (44.8) | 23 (28.0) | |
| Post-secondary | 42 (32.6) | 154 (34.1) | 95 (36.5) | 22 (37.9) | 29 (35.4) | |
| University | 46 (35.7) | 176 (38.9) | 91 (35.0) | 10 (17.2) | 30 (36.6) | |
| Household income per month (S$) | 925 | |||||
| ≤1999 | 15 (12.3) | 57 (13.4) | 31 (12.8) | 10 (17.9) | 14 (17.9) | |
| 2000–5999 | 79 (64.9) | 217 (50.9) | 133 (54.7) | 40 (71.4) | 42 (53.8) | |
| ≥6000 | 28 (23.0) | 152 (35.7) | 79 (32.5) | 6 (10.7) | 22 (28.2) | |
| Maternal age (at recruitment) (years) | 994 | 30.59 ± 5.20 | 31.00 ± 4.95 | 30.60 ± 5.21 | 30.77 ± 4.92 | 30.25 ± 5.07 |
| Pre-pregnancy BMI | 910 | 22.21 ± 4.64 | 21.95 ± 3.83 | 23.17 ± 4.50 | 25.53 ± 4.97 | 24.17 ± 4.97 |
| Maternal height (cm) | 975 | 156.84 ± 5.44 | 158.84 ± 5.54 | 158.16 ± 5.54 | 158.90±.5.85 | 158.00 ± 6.05 |
| Paternal BMI | 669 | 25.3 ± 4.6 | 25.2 ± 4.2 | 26.2 ± 4.3 | 27.7 ± 3.8 | 26.9 ± 4.8 |
| Parity | 994 | |||||
| Nulliparous | 47 (35.9) | 208 (45.4) | 125 (47.3) | 25 (43.1) | 46 (55.4) | |
| Parous | 84 (64.1) | 250 (54.6) | 139 (52.7) | 33 (56.9) | 37 (44.6) | |
| Pregnancy characteristics | ||||||
| OGTT 26th week | ||||||
| Fasting glucose (mmol/L) | 950 | 4.30 ± 0.39 | 4.30 ± 0.44 | 4.37 ± 0.42 | 4.48 ± 0.63 | 4.45 ± 0.72 |
| 2-h Glucose (mmol/L) | 6.47 ± 1.52 | 6.48 ± 1.39 | 6.47 ± 1.46 | 6.84 ± 1.46 | 6.64 ± 1.92 | |
| Gestational diabetes mellitus | 950 | |||||
| No | 102 (80.3) | 361 (83.0) | 210 (83.0) | 46 (80.7) | 60 (76.9) | |
| Yes | 25 (19.7) | 74 (17.0) | 43 (17.0) | 11 (19.3) | 18 (23.1) | |
| Rate of gestational weight gaina | 877 | |||||
| Inadequate | 17 (14.8) | 59 (14.4) | 28 (12.2) | 4 (7.8) | 11 (15.1) | |
| Adequate | 55 (47.8) | 165 (40.3) | 68 (29.7) | 14 (27.5) | 19 (26.0) | |
| Excessive | 43 (37.4) | 185 (45.2) | 133 (58.1) | 33 (64.7) | 43 (58.9) | |
| Smoking (during) | 982 | |||||
| No | 127 (97.7) | 443 (97.8) | 255 (97.3) | 56 (96.6) | 80 (100) | |
| Yes | 3 (2.3) | 10 (2.2) | 7 (2.7) | 2 (3.4) | 0 (0) | |
| Hypertensive disorders of pregnancy | 993 | |||||
| No | 123 (94.6) | 430 (93.9) | 253 (95.8) | 56 (96.6) | 76 (91.6) | |
| Yes | 7 (5.4) | 28 (6.1) | 11 (4.2) | 2 (3.4) | 7 (8.4) | |
| Gestational age (weeks) | 994 | 38.90 ± 0.99 | 39.03 ± 0.96 | 39.10 ± 1.03 | 38.84 ± 1.00 | 38.86 ± 1.07 |
| Offspring characteristics | ||||||
| Sex (% males) | 994 | 54.2 | 50.4 | 51.9 | 60.3 | 57.8 |
| Size for gestational age | 994 | |||||
| Appropriate for GA | 99 (75.6) | 347 (75.8) | 187 (70.8) | 40 (69.0) | 61 (73.5) | |
| Small for GA | 25 (19.1) | 52 (11.4) | 9 (3.4) | 0 (0.00) | 14 (16.9) | |
| Large for GA | 7 (5.3) | 59 (12.9) | 68 (25.8) | 18 (31.0) | 8 (9.6) | |
| Polygenic risk score (obesity) | 939 | –0.17 ± 0.50 | –0.04 ± 0.51 | 0.03 ± 0.49 | 0.25 ± 0.53 | 0.11 ± 0.42 |
| Post-natal nutrition | ||||||
| Duration of breastfeeding (months) | 994 | |||||
| <3 | 55 (42.0) | 174 (38.0) | 106 (40.2) | 36 (62.1) | 39 (47.0) | |
| ≥3 | 76 (58.0) | 284 (62.0) | 158 (59.8) | 22 (37.9) | 44 (53.0) | |
Categorical variables are presented as number (percentage) in each category and the continuous variables are represented by mean (standard deviation). SNL, Stable Normal Low; SN, Stable Normal; SNH, Stable Normal High; EA, early acceleration; LA, late acceleration; GA, gestational age; BMI, body mass index; OGTT, oral glucose tolerance test.
Calculated between 15 and 35 weeks.
Association of early-life exposures with childhood growth trajectories
The mutually adjusted multinomial logistic regression analysis (Table 2) indicated ethnic differences in the growth trajectories. Whereas Indian ethnicity was associated with both EA and LA trajectory classes, Malay ethnicity was uniquely associated only with the EA trajectory classes. High maternal ppBMI and shorter breastfeeding durations were common risk factors linked to both EA and LA trajectory classes. Nulliparity was uniquely linked to increased odds of having late BMI acceleration whereas lower maternal educational attainment was uniquely linked to early BMI acceleration. Among maternal pregnancy complications, GDM and hypertensive disorders of pregnancy were not associated with any of the trajectories. However, excessive GWG was linked to increased odds of being in the SNH trajectory class. Shorter breastfeeding duration also increased the odds of being in the EA and LA trajectory classes.
Multinomial logistic regression models for evaluating the odds of being classified in a specific trajectory class due to early-life predictors
| Exposures | Trajectory classification | |||
|---|---|---|---|---|
| SNL vs SN | SNH vs SN | EA vs SN | LA vs SN | |
| Model 1: Influence of maternal antenatal factors (mutually adjusted) | ||||
| Ethnicity | ||||
| Malay vs Chinese | 0.85 (0.48, 1.52) 0.592 | 1.27 (0.84, 1.93) 0.256 | 3.22 (1.49, 6.93) 0.003 | 1.07 (0.53, 2.18) 0.845 |
| Indian vs Chinese | 2.30 (1.37, 3.87) 0.002 | 0.84 (0.51, 1.37) 0.480 | 3.36 (1.47, 7.69) 0.004 | 3.10 (1.68, 5.74) <0.0001 |
| Maternal education | ||||
| Secondary vs university | 1.32 (0.78, 2.25) 0.306 | 0.95 (0.62, 1.46) 0.818 | 2.70 (1.13, 6.44) 0.025 | 1.22 (0.63, 2.38) 0.553 |
| Post-secondary vs university | 1.13 (0.78, 2.25) 0.646 | 0.98 (0.66, 1.44) 0.903 | 1.80 (0.77, 4.19) 0.172 | 1.03 (0.56, 1.89) 0.929 |
| Parity | ||||
| Nulliparous vs parous | 0.72 (0.46, 1.13) 0.152 | 1.13 (0.81, 1.59) 0.480 | 1.46 (0.78, 2.75) 0.241 | 1.85 (1.09, 3.16) 0.023 |
| Maternal age (years) | 0.98 (0.94, 1.02) 0.318 | 0.99 (0.96, 1.03) 0.576 | 1.03 (0.97, 1.09) 0.332 | 0.99 (0.94, 1.05) 0.748 |
| ppBMI (kg/m2) | 1.00 (0.94, 1.06) 0.966 | 1.06 (1.01, 1.11) 0.012 | 1.12 (1.05, 1.20) 0.001 | 1.10 (1.03, 1.17) 0.005 |
| Maternal height (cm) | 0.95 (0.91, 0.98) 0.003 | 0.98 (0.95, 1.01) 0.157 | 1.03 (0.98, 1.09) 0.247 | 0.98 (0.94, 1.03) 0.408 |
| Gestational diabetes mellitus | ||||
| Yes vs no | 1.19 (0.69, 2.06) 0.535 | 1.08 (0.69, 1.69) 0.741 | 1.35 (0.61, 2.98) 0.458 | 1.33 (0.69, 2.55) 0.396 |
| Hypertensive disorders of pregnancy | ||||
| Yes vs no | 0.99 (0.41, 2.40) 0.978 | 0.50 (0.24, 1.05) 0.066 | 0.27 (0.06, 1.28) 0.100 | 0.93 (0.37, 2.35) 0.879 |
| Rate of gestational weight gain | ||||
| Inadequate vs adequate | 0.75 (0.39, 1.43) 0.379 | 1.16 (0.66, 2.01) 0.610 | 0.68 (0.20, 2.26) 0.530 | 1.54 (0.67, 3.53) 0.308 |
| Excessive vs adequate | 0.72 (0.44, 1.18) 0.187 | 1.52 (1.03, 2.25) 0.036 | 1.24 (0.60, 2.53) 0.561 | 1.50 (0.78, 2.73) 0.239 |
| Model 2: Influence of offspring polygenic risk score for obesity (adjusted for ethnicity and sex) | ||||
| Polygenic risk scores (obesity) | 0.60 (0.40, 0.91) 0.015 | 1.34 (0.98, 1.83) 0.069 | 3.49 (1.90, 6.40) <0.0001 | 1.88 (1.13, 3.14) 0.015 |
| Model 3: Influence of breastfeeding duration (adjusted for ethnicity, ppBMI, education and gestational diabetes) | ||||
| Breastfeeding duration <3 vs ≥3 months | 1.05 (0.68, 1.63) 0.825 | 1.00 (0.70, 1.39) 0.945 | 1.74 (0.94, 3.22) 0.079 | 1.30 (0.76, 2.20) 0.36 |
Odds ratio (95% CI) with respect to the reference trajectory (Stable Normal) are presented. P-values are indicated after each reported odds ratio. P-values <0.05 are highlighted in bold. SNL, Stable Normal Low; SN, Stable Normal; SNH, Stable Normal High; EA, early acceleration; LA, late acceleration; BMI, body mass index; ppBMI, pre-pregnancy body mass index.
Association of genetic risk of obesity with childhood growth trajectories
After adjusting for ethnicity and sex, higher offspring PRS for obesity were found to be associated with increased odds of being in the EA (∼3-fold higher) and LA (∼2-fold higher) trajectory classes and lower odds of being in the SNL (∼2-fold lower) trajectory class relative to the SN trajectory class.
Association of childhood growth trajectories with eating behaviours at 4.5 years
Comparison of the objectively measured eating behavioural traits from an ad libitum meal at age 4.5 years across the trajectory classes indicated that LA children had an elevated eating rate, with fewer chews per gram consumed, as well as higher energy intake (both solids and total intake) when compared with SN children (Table 3; unadjusted mean ± SD shown in Supplementary Table S6, available as Supplementary data at IJE online; complete case analysis shown in Supplementary Table S3, available as Supplementary data at IJE online). The elevation in energy intake in EA children relative to SN children was comparable to that of LA children, despite EA children not exhibiting any altered eating behaviour traits.
Adjusted mean differences [β (95% CI)] in eating behaviours measured at age 4.5 years across the trajectory classes
| Behavioural assessments | SNL vs SN | SNH vs SN | EA vs SN | LA vs SN |
|---|---|---|---|---|
| Eating behaviour at age 4.5 years | ||||
| Eating rate (g/min) | –0.78 (–1.93, 0.37) 0.184 | 0.54 (–0.37, 1.45) 0.241 | 0.59 (–1.07, 2.26) 0.483 | 1.37 (–0.12, 2.86) 0.072 |
| Chews per g | 0.68 (–1.80, 3.16) 0.592 | –0.62 (–2.58, 1.34) 0.538 | –0.42 (–4.00, 3.16) 0.818 | –4.15 (–7.36, –0.93) 0.011 |
| Oral exposure per bite (s) | 1.44 (–2.73, 5.61) 0.498 | 1.35 (–1.95, 4.65) 0.423 | –1.91 (–7.93, 4.11) 0.534 | 2.19 (–3.21, 7.60) 0.427 |
| Bite size (g/bite) | –0.13 (–0.57, 0.31) 0.551 | 0.19 (–0.15, 0.54) 0.273 | –0.05 (–0.68, 0.59) 0.879 | 0.52 (–0.05, 1.09) 0.073 |
| Energy intake, solids (kcal) | –21.01 (–67.65, 25.64) 0.377 | 13.77 (–23.14, 50.68) 0.465 | 55.61 (–11.87, 123.09) 0.106 | 59.16 (–1.38, 119.70) 0.055 |
| Energy intake, total (kcal) | –35.32 (–87.69, 17.05) 0.186 | 20.40 (–21.05, 61.86) 0.335 | 62.72 (–13.06, 138.50) 0.105 | 67.73 (–0.25, 135.70) 0.051 |
| Eating in absence of hunger (kcal) | 9.62 (–6.34, 25.57) 0.238 | 6.61 (–5.62, 18.85) 0.290 | –5.01 (–27.18, 17.17) 0.658 | 11.58 (–8.78, 31.93) 0.265 |
Models were adjusted for ethnicity, pre-pregnancy body mass index, sex, maternal education, rate of gestational weight gain, gestational diabetes and parity. The Stable Normal trajectory pattern was used as the reference group for all models. Each row represents a separate model. P-values are reported after each effect size measure. P-values <0.05 are highlighted in bold. SNL, Stable Normal Low; SN, Stable Normal; SNH, Stable Normal High; EA, early acceleration; LA, late acceleration.
Association of childhood growth trajectories with cardiometabolic measures, ectopic fat and abdominal fat compartments
Associations of the trajectories with fat depots and cardiometabolic outcomes are shown in Table 4. Both EA and LA patterns were linked to increased odds of pre-hypertension/hypertension, elevated fasting insulin and elevated HOMA-IR. However, fasting glucose was elevated only in LA children. SAT volumes were higher in EA, LA and SNH children and lower in SNL children. IAT volumes and liver fat were higher in EA and LA children, whereas IMCL did not vary across the trajectory classes. Similar findings were observed when complete case analyses were performed (Supplementary Table S4, available as Supplementary data at IJE online).
Adjusted mean differences [β (95% CI)] in body fat depots and cardiometabolic assessments at age 6 years across the trajectory classes [adjusted odds ratio (95% CI) shown for dichotomous outcomes]
| Cardiometabolic assessments | SNL vs SN | SNH vs SN | EA vs SN | LA vs SN |
|---|---|---|---|---|
| Fat depots at age 6 years | ||||
| SAT (cm3) | –214.82 (–341.16, –88.48) | 132.37 (42.64, 222.10) | 1690.10 (1534.06, 1846.13) | 1076.32 (931.33, 1221.32) |
| 0.001 | 0.004 | <0.0001 | <0.0001 | |
| VAT (cm3) | –3.24 (–28.14, 21.66) | 10.58 (–7.12, 28.28) | 246.49 (215.71, 277.27) | 158.39 (129.79, 187.00) |
| 0.799 | 0.241 | <0.0001 | <0.0001 | |
| Liver fat | 0.07 (–0.28, 0.40) | 0.07 (–0.17, 0.31) | 1.30 (0.88, 1.73) | 0.74 (0.36, 1.12) |
| (% weight) | 0.733 | 0.566 | <0.0001 | <0.0001 |
| IMCL | –0.02 (–0.26, 0.21) | –0.01 (–0.17, 0.15) | 0.09 (–0.19, 0.37) | –0.02 (–0.27, 0.24) |
| (% water signal) | 0.850 | 0.904 | 0.535 | 0.899 |
| Cardiometabolic outcome at age 6 | ||||
| Pre-hypertension | 0.52 (0.22, 1.22) | 1.37 (0.82, 2.31) | 2.29 (0.99, 5.30) | 2.15 (1.07, 4.31) |
| Hypertensiona | 0.133 | 0.231 | 0.052 | 0.031 |
| Fasting glucose (mmol/L) | –0.07 (–0.17, 0.02) | 0.05 (–0.03, 0.13) | 0.05 (–0.10, 0.20) | 0.15 (0.03, 0.27) |
| 0.140 | 0.206 | 0.520 | 0.017 | |
| Fasting insulin (mU/L) | –0.81 (–1.66, 0.05) | –0.02 (–0.71, 0.67) | 4.10 (2.80, 5.40) | 3.08 (1.98, 4.18) |
| 0.065 | 0.958 | <0.0001 | <0.0001 | |
| HOMA-IR | –0.17 (–0.35, 0.03) | 0.04 (–0.11, 0.20) | 1.09 (0.80, 1.38) | 0.63 (0.38, 0.88) |
| 0.088 | 0.590 | <0.0001 | <0.0001 | |
All models were adjusted for ethnicity, pre-pregnancy body mass index, sex, maternal education, rate of gestational weight gain, gestational diabetes and parity. The Stable Normal trajectory pattern was used as the reference group for all models. Each row represents a separate model. P-values are reported below each effect size measure. P-values <0.05 are highlighted in bold. SNL, Stable Normal Low; SN, Stable Normal; SNH, Stable Normal High; EA, early acceleration; LA, late acceleration; SAT, subcutaneous adipose tissue; IAT, intra-abdominal adipose tissue; IMCL, intra-myocellular lipids; HOMA-IR, homeostatic model assessment for insulin resistance.
Values indicate odds ratio from binary logistic regression due to dichotomous outcome.
Comparison the determinant of SNH and LA trajectories
The SNH trajectory pattern was characterized by elevated BMI, which was stable between 0 and 6 years. The LA trajectory pattern had SN BMI in infancy but growth acceleration after infancy. To understand the determinants of the shift in growth trajectory patterns, we also compared the associations of the LA trajectory relative to the SNH trajectory with intrauterine growth (Supplementary Table S7, available as Supplementary data at IJE online), early-life determinants (Supplementary Table S8, available as Supplementary data at IJE online) and eating behaviours (Supplementary Table S9, available as Supplementary data at IJE online). LA children had lower FACV and birthweight than SNH children, despite having a higher genetic risk of obesity, which was suggestive of intrauterine growth constraints. Indian ethnicity and nulliparity were linked to nearly 4-fold higher and 2-fold higher odds, respectively, of being in the LA trajectory. LA children also had reduced chews/g relative to SNH children.
Discussion
The current study adds to a growing body of work using LCGMM to identify heterogeneous growth patterns in different populations.22–25 In a multi-ethnic Asian cohort, we identified five BMI z-score trajectory patterns in the first 6 years of life. Three trajectories remained stable within the healthy BMI range whereas the remaining two showed BMI acceleration (∼14% of the cohort). The EA trajectory showed BMI acceleration immediately after birth, crossing the obesity threshold as early as 2 years, whereas the LA trajectory showed acceleration only after infancy and approached the obesity threshold by age 6 years. In utero, EA children had the highest FACV whereas that of LA children had the lowest FACV. Of note, although the current study was conducted in an Asian cohort in the setting of a developed, high-income country, LCGMM has uncovered similar stable and accelerating BMI trajectory patterns in other contemporary cohorts with very different racial/ethnic and socio-economic profiles.23–25
Children in the EA and LA trajectory classes showed evidence of early cardiometabolic alterations concordant with LCGMM-derived accelerating BMI trajectories in earlier studies.22,25 Liver fat, subcutaneous and IAT, odds of pre-hypertension/hypertension and HOMA-IR were elevated in both groups. Whereas fasting insulin and HOMA-IR were highest in EA children, only LA children had elevated fasting glucose levels. The elevation of fasting glucose in LA children could be a result of multiple factors: increased resistance to action of insulin, inadequate beta cell function/mass, increased substrate availability for gluconeogenesis, increased glycogenolysis and/or increased glucagon secretion. The precise underlying mechanisms are outside the scope of the present study. Abdominal and liver fat accumulation have been previously linked to increased cardiometabolic risk in pre-pubertal children.26,27 Thus, tracking of these cardiometabolic and body fat partitioning phenotypes to adolescence and adulthood may be a potential mechanism through which BMI acceleration in infancy and early childhood influences long-term cardiometabolic health.
Retrospective analyses of growth trajectories in adults with coronary heart disease or type 2 diabetes have shown that these individuals were born with lower birthweights and had poor growth in infancy and BMI acceleration in early childhood.1–3 Whereas this trajectory pattern resembles the LA trajectory pattern, there is one major difference: BMI acceleration was linked to lower birthweight in these retrospective studies. In the current study, birthweights and FACV of the LA group were not different from the SN group, whereas the prevalence of SGA was slightly higher (16.9% vs 11.4%). Potential explanations for this could be that some of the older developmental cohorts experienced periods of nutritional stress before or during pregnancy, included many women of low BMI or were located in developing countries.1–3,28 We also found that the EA group had elevated FACV, birthweights and neonatal abdominal fat volumes when compared with SN children. Thus, the early growth acceleration in EA children does not seem to be a compensatory catch-up response to constrained intrauterine growth.29 The obesogenic trajectory patterns we identified may be reflective of children growing up in contemporary well-nourished populations. Similar trends have been observed with prospective LCGMM analysis in other populations. For instance, in an American cohort, early BMI acceleration was associated with higher birthweights whereas children showing late BMI acceleration had comparable birthweights to those of children having a normal trajectory.23 In an Ethiopian cohort, children with early or late BMI acceleration had mean birthweights that were comparable to those of children in the stable trajectories.25
Indian ethnicity was a common risk factor for both EA and LA trajectory patterns, whereas Malay ethnicity was uniquely linked to the EA trajectory pattern. The associations of the minority ethnic groups (Indians and Malay) with obesogenic growth trends during early childhood were noteworthy given the fact that the prevalence of adulthood obesity, type 2 diabetes as well as coronary heart disease-related morbidity and mortality is higher in Indians and Malays relative to Chinese in this population.30–32 Independently of ethnicity, lower maternal educational attainment was uniquely linked to the EA trajectory pattern. Minority ethnicity and low maternal educational attainment may be proxies for several unmeasured vulnerabilities. These may include both socio-structural vulnerabilities such as unequal access to education, network inequalities, access to social capital, social mobility and socio-structural barriers to healthy/active living,33,34 as well as psychosocial vulnerabilities such as chronic stress and cognitive adaptations secondary to bias or discrimination and affective states linked to lower subjective socio-economic status.35–37 Modifying the social and environmental contexts that give rise to such vulnerabilities may require interventions at the level of social and governmental policies.38,39 It is notable that Indian ethnicity was associated with both EA and LA trajectory patterns. Indian infants have been reported to have lower birthweight compared with infants from other ethnicities (nearly 280–350 g lower than Caucasian infants40). Within the GUSTO cohort, the differences in birthweight between Indian infants and Chinese/Malay infants were less pronounced [66 g lower than Malay infants (P = 0.096) and 75 g lower than Chinese infants (P = 0.028)]. Whereas it has been speculated that poor nutrition and infection load before and during pregnancy may contribute to this phenomenon, lower birthweight has been found to persist even in second-generation Indian infants born in developed countries.41 Interestingly, we observed that the situation was reversed by age 6 years, when Indian children were 1.36 kg heavier than Malay children (P = 0.014) and 1.84 kg heavier than Chinese children (P < 0.001). These findings suggest that they experienced higher growth acceleration between ages 0 and 6 years, and are consistent with the associations of Indian ethnicity with the EA and LA trajectory patterns. The nature of the underlying factors constraining intrauterine growth and causing accelerated growth in infancy/childhood in Indians remain to be fully elucidated.
Obesity PRS was a common non-modifiable risk factor for both EA and LA trajectory patterns. The risk of the EA trajectory pattern linked to obesity PRS was nearly double that of the LA trajectory pattern, suggesting a higher genetic contribution to the EA trajectory pattern. EA children had the highest FACV, which was concordant with their high obesity PRS. Despite having an elevated obesity PRS, LA children had the lowest FACV among all the trajectory classes. It is plausible that LA children experienced an intrauterine growth constraint that does not allow them to grow to their true genetic growth potential. Interestingly, nulliparity at study recruitment was another non-modifiable risk factor uniquely linked with the LA trajectory pattern. Nulliparity has been postulated to present a maternal physiological constraint that can limit fetal growth to levels below its genetic growth potential, possibly due to inadequate remodelling of the spiral artery to increase utero-placental blood flow or because of a smaller uterus size.42 The absence of such a constraint in post-natal life may create a discordant post-natal growth pattern when children with a genetic predisposition for obesity are born to nulliparous mothers.
High ppBMI was the only antenatal risk factor linked to both EA and LA trajectory patterns. Concordantly with the known protective effects of breastfeeding against increased weight gain in infancy,43 we found shorter duration of breastfeeding to be linked to both EA and LA trajectory patterns. Both high maternal ppBMI and shorter breastfeeding duration have also been identified as risk factors for accelerating BMI trajectory patterns in other populations.23,24
We found LA children to have elevated energy intake in an ad libitum meal. LA also displayed an obesogenic eating style with a faster eating rate and reduced chews per gram. These traits have been previously linked with childhood adiposity.15,44 Given that the models included parity as a covariate, these associations seem to be independent of the faster eating rates linked to first-born children.45 These traits are modifiable through better parental feeding practices, parental awareness of child appetite and food-cue responsiveness, and through changes to the child’s early food environment.46–48
In the additional analysis we carried out comparing LA children to SNH children, we found Indian ethnicity and nulliparity to increase the odds of having a LA trajectory pattern (relative to SNH pattern). LA children also had lower chews/g than SNH children. These factors may contribute to the intrauterine and post-natal growth patterns observed in LA children (lowest FACV despite having an elevated obesity PRS and growth acceleration after infancy).
A key strength of the current study is that we could leverage data from a deeply phenotyped prospective Asian mother–offspring cohort to identify obesogenic growth patterns linked with metabolic alterations during childhood and identify the related risk factors (a conceptual schematic showing the unique and shared risk factors linked to these patterns is shown in Figure 2). In particular, the data on antenatal risk factors, ultrasound-based FACV, obesity PRS, objectively measured eating behaviours and imaging-based body abdominal and ectopic fat assessments have not been commonly simultaneously available in earlier studies on growth trajectory modelling. The ethnic groups included in the study are representative of nearly half of the global population who live in regions where the economic and social burden of obesity-related co-morbidities is high.
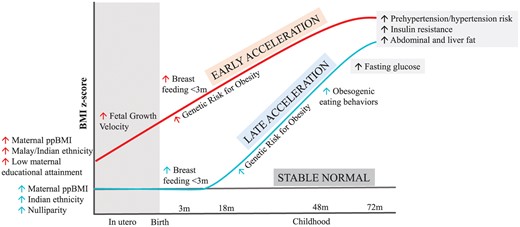
Schematic diagram showing pre- and post-natal risk factors and post-natal behavioural and cardiometabolic assessments associated with early-acceleration and late-acceleration trajectory patterns. Up arrow indicates an increase in risk of being classified into a trajectory class linked to risk factor or an elevated outcome relative to the Stable Normal trajectory pattern.
Several study limitations should be noted. A limitation of LCGMM is that membership of a trajectory class can only be assigned retrospectively.49 Despite this limitation, the determinants of the obesogenic trajectory patterns provide opportunities for prospective identification of high-risk children. The EA trajectory group had a relatively small sample size (<6%), hence the reported associations should be interpreted with caution. Replication studies in larger cohorts is warranted. We might be underpowered to detect associations with some of the weaker (but biologically important) determinants. Group-based trajectory modelling masks individual growth milestones like timing of infancy BMI peak or adiposity rebound, which have also been linked to increased cardiometabolic risk.49 Cardiometabolic, imaging and eating behaviour assessments were available only in subsets of the cohort, which could have induced selection bias and limited the power to detect differences across the classes. Maternal pre-pregnancy weights were self-reported, which could have resulted in an under-reporting of their weights. Fetal biometry assessments using ultrasound are highly operator dependent. We were not able to account for paternal influences on the growth patterns in the current work.
In conclusion, our analysis of the BMI z-scores of a multi-ethnic Asian cohort from a developed nation identified temporal heterogeneity in the onset of obesogenic growth patterns, with one already apparent in utero and the one becoming apparent after infancy. Both these patterns were linked to early alterations in cardiometabolic risk markers and were associated with both shared as well as unique risk factors. These risk factors are relevant for early risk stratification and focusing on appropriate developmental windows for effective intervention. The underlying factors driving obesogenic growth patterns may vary among populations that inhabit different socio-demographic and economic settings and warrant an in-depth understanding for the development of new approaches in early life to mitigate risk of obesity. Population-centric analysis of these growth patterns can inform the design of localized prospective studies for testing out specific interventions and building precision into the global efforts to minimize the burden of obesity and related co-morbidities.
Ethics approval
This study was approved by both the National Healthcare Group Domain Specific Review Board (D/2009/021 and B/2014/00411) and the SingHealth Centralized Institutional Review Board (2018/2767 and 2019/2406) and has been performed in accordance with the ethical standards laid down in the 1964 Declaration of Helsinki and its later amendments. Written informed consent was obtained from all children and their parents.
Data availability
The data used in the manuscript are available on request, on approval by the GUSTO executive committee.
Supplementary data
Supplementary data are available at IJE online.
Author contributions
Y.S.L., I.M.A., N.M., V.G., J.G.E. and N.K. contributed to the study conception and design. N.K. directed the study implementation. J.H. and I.M.A. provided statistical advice. J.G.E., Y.S.C., P.G., J.K.Y.C., Y.S.L., L.P.C.S., K.H.T. and F.Y. provided administrative and material support. N.M., V.G., A.F., J.H., L.C., S.A.S., Y.Y.O., I.M.A., W.W.P., W.L.Y., S.L.Y. and M.T.T. contributed to the data acquisition and preparation. N.M., V.G., A.F., C.G.F., J.G.E., K.G. and N.K. contributed to the data interpretation. N.M. and V.G. performed the data analysis and wrote the initial version of the manuscript. All authors contributed to critical revision of the manuscript for important intellectual content. N.M. and V.G. had full access to all of the data in the study and take responsibility for the integrity of the data and the accuracy of the data analysis. N.M., V.G. and N.K. are the guarantors of the paper.
Funding
The study is supported by the National Medical Research Council, Singapore (NMRC) (NMRC/TCR/004-NUS/2008, NMRC/TCR/012-NUHS/2014, OFLCG19May-0033) and Singapore Institute for Clinical Sciences (SICS), Agency for Science Technology and Research, Singapore (A*STAR). N.K. is supported by A*STAR- National Health and Medical Research Council, Australia (NHMRC) joint call funding (1711624031). K.M.G. is supported by the UK Medical Research Council (UK MRC) (MC_UU_12011/4), National Institute for Health Research (NF-SI-0515–10042 and IS-BRC-1215–20004), European Union (Erasmus+ Programme ImpENSA 598488-EPP-1–2018-1-DE-EPPKA2-CBHE-JP), British Heart Foundation (RG/15/17/3174) and US National Institutes of Health’s National Institute On Aging (award no. U24AG047867). For the purpose of Open Access, K.M.G. has applied a Creative Commons Attribution (CC BY) licence to any Author Accepted Manuscript version arising from this submission. The funding agencies had no role in the study’s design, conduct and reporting.
Acknowledgements
We thank all GUSTO study participants as well as the GUSTO study group. We would also like to acknowledge the support we received from Ms Kashthuri Thirumurugan and Mr Tan Kwan Ann in processing the MRI and MRS data, respectively.
Conflict of interest
K.M.G. and Y.S.C. have received reimbursement for speaking at conferences sponsored by companies selling nutritional products. Y.S.C., K.M.G., S.Y.C. and N.K. and are part of an academic consortium that has received research funding from Abbott Nutrition, Nestec, BenevolentAI Bio Ltd and Danone. The remaining authors have no conflicts of interest to declare.
References
Author notes
Joint first authors.
Joint last authors.

