


Why was the cohort set up?
Japan, a country facing challenges associated with managing the health care of a rapidly ageing society, has gained the attention of policy makers, economists and health care providers worldwide.1–4 The country has a high life expectancy (80.75 and 86.99 years for men and women, respectively, in 2015)5 and a high agieng rate (26.6% and 12.8% of the total population was aged ≥65 years and ≥75 years, respectively, in 2015), particularly among older age groups (31.7% and 40.7% increase in people aged ≥65 and ≥75 years, respectively, from 2005 to 2015).6 Japan, particularly in the provinces, has become a ‘super-aged’ society as based on the World Health Organization’s criterion of more than 21% of the population being aged ≥65 years. Therefore, both elderly individuals and the communities supporting them are beginning to grapple with various problems that need immediate attention, such as frailty and cognitive impairment, because of their negative impact on quality of life (QOL) and increased medical and long-term care costs.
However, these problems have not been fully investigated in the large population-based cohort studies conducted in Japan thus far, since most of these were designed to target young to middle-aged individuals.7–13 Cohort studies targeting older adults should be aimed not only at preventing multi-morbidities but also at evaluating the symptoms associated with ageing, health-related QOL and patient-reported outcomes (PROs).14 These aspects reflect subjective health status and its influence on daily living, and identifying the factors that contribute to their improvement is extremely important for enjoying the later stages of life. In addition, identifying individual-level factors that predict a need for nursing and specific medical care, and quantifying the influence of these factors on the costs of nursing and medical care, are also of great concern from a societal perspective given the limited budget available to local governments to cover a population’s health care.
Fukushima Prefecture has been hit particularly hard by the realities of supporting a rapidly ageing society, as the proportion of the population aged ≥65 years is higher than the Japanese average.15 Sukagawa City, located in the central area of Fukushima Prefecture, is facing problems similar to those described above and has begun to collaborate with academics in an effort to address these issues. In 2014, Sukagawa City entered into a contract with Fukushima Medical University (FMU) to establish a population-based cohort named the ‘Sukagawa Healthy Longevity Project’ among Sukagawa citizens (the Sukagawa Study). Sukagawa City is a ‘super-aged’ society as well; 25.4% of the population was ≥65 years and 12.8% was ≥75 years, based on the 2015 population census.6 It has a similar age distribution to Japan overall, so we consider Sukagawa City to be representative of the provincial cities in Japan. Therefore, we established a super-elderly population-based cohort in Sukagawa City in March 2017. Using data obtained from this cohort, we can explore the actual conditions of health-related QOL, PROs, physical and psychological disabilities, usage of medical and nursing care resources, and their associated factors in a super-aged society. The findings will hopefully serve as an evidence base for other cities and countries.
Who is in the cohort?
This cohort received ethical approval from the Ethics Committee of FMU (registered approval number: 2975) and Iwase General Hospital (a core general hospital located in Sukagawa City and the main institution of this survey). We obtained written informed consent from all participants.
In this cohort, our target population was individuals aged ≥75 years, defined as the ‘super elderly’,16 who were living in Sukagawa City and were relatively independent. In 2015, Sukagawa City had a population of 78 033 (38 411 men and 39 622 women), and 9895 (12.7%) were ≥75 years old.6 People aged ≥75 years living in Japan have to enrol in the Late Elders’ Health Insurance of the medical care association in each prefecture, irrespective of their employment or dependence status, except those receiving welfare.17 Therefore, most of the individuals in this cohort were covered by the Late Elders’ Health Insurance, and a small number of participants received welfare, their health care costs being covered by the public assistance system. To evaluate independence in participants, long-term care insurance (LTCI) data were used. The LTCI is a mandatory social insurance system managed by the local municipalities to provide long-term care for the frail elderly. It categorizes people into seven levels of needs as defined by the Ministry of Health, Labour and Welfare, based on the estimated time required for comprehensive care covering physical, mental and cognitive functions for each individual: from support levels 1 (lowest) and 2 to care levels 1 to 5 (highest).18 We defined relative independence as a care level of 2 or lower in this study, and thus included those who did not require care and were certified as support levels 1 and 2,and care levels 1 and 2 at the baseline. In general, people with a care level of 2 or lower are able to perform some daily activities independently and need only partial care; thus, they are considered to have minimal or no physical, mental and cognitive disabilities. A simple comparison of the two insurance systems associated with this cohort is shown in Supplementary Table S1, available as Supplementary data at IJE online. We also excluded citizens who had been hospitalized for longer than 6 months.
The structure of the cohort is shown in a simplified manner in Figure 1. From 2015 to 2016, we conducted a pilot study of 1799 cohort participants in the central district of Sukagawa City. In 2017, we established our cohort with residents of Sukagawa City aged ≥75 years. In 2017–18, we sent the baseline self-administered questionnaire along with a consent form to the 9550 eligible residents, and 6890 returned the signed forms and responded to the questionnaire (response rate: 72.1%). Following that, we sent invitations to all questionnaire respondents to participate in the additional health survey; 1129 voluntarily did so. The health survey was conducted at Iwase General Hospital and the public health centres, and those who took the health survey at Iwase General Hospital underwent further examinations. The participants could choose the venue themselves; 702 of them took the survey at the hospital.
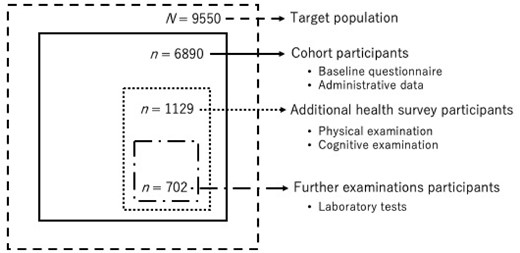
Structure of the cohort. Dashed line indicates the target population (≥75 years old and relatively independent); solid line indicates cohort participants (those who responded to the baseline questionnaire); dotted line indicates additional health survey participants (those who joined the additional health survey); dash-dotted line indicates further examination participants (those who joined the health survey at Iwase General Hospital)
Of 6890 participants, 5615 (81.5%) were not certified for LTCI care levels, and the numbers of those who were classified as support levels 1 and 2 and care levels 1 and 2 were 214 (3.1%), 310 (4.5%), 417 (6.1%) and 334 (4.9%), respectively.
How often have they been followed up?
The questionnaire survey and additional health survey are conducted annually, and data on death and emigration from Sukagawa municipality are obtained periodically. Once the eligible residents decide to participate in our project, all administrative data are collected until the date of death, emigration from Sukagawa City or withdrawal of consent to participate in the study, whichever occurs first, regardless of whether or not they respond to the annual follow-up questionnaire. During the first year of follow-up, no participants had withdrawn from the study. Among 6890 baseline participants, 5320 responded to the questionnaire and 456 completed the additional health survey at the 1-year follow-up. Given Sukagawa City’s assurance of continued funding, follow-up is scheduled to continue until at least 2024.
What has been measured?
Our survey comprised a self-administered questionnaire, as well as physical and cognitive examinations. Variables collected in this cohort are summarised in Box 1. The baseline questionnaire was distributed from 2017 to 2018 and included questions on demographics, general health conditions, functional status, health-related behaviours, social capital and socioeconomic status. Scales to measure specific symptoms or functions associated with ageing, such as lower urinary tract symptoms (e.g. Overactive Bladder Symptoms Score: OABSS),19 visual function (National Eye Institute 11-item Visual Function Questionnaire: NEI VFQ-11),20 dental status, quality of sleep and sarcopenia (Japanese version of the SARC-F questionnaire)21 were included in the questionnaires. We used the SF-8TM,22 a validated generic measure of physical and mental health status, to assess health-related QOL.
The additional health survey consisted of physical and cognitive examinations, such as body mass index (BMI), blood pressure, grip strength and Mini Cog©.23 The cohort members who took the health survey at Iwase General Hospital underwent further examinations such as those for muscle mass (bioimpedance analysis), gait speed (10 Metre Walk Test), cognitive function (Mini-Mental State Examination: MMSE)24 and accumulation of advanced glycation end products in the skin.25 Every year, the study committee and municipality fully discuss and revise the questions and examinations based on the previous results and new research requirements. In 2019 and 2020, some factors that could be important for the participants were added to the questionnaire, such as chronic symptoms related to ageing, sensory disturbances, physical activities and advance care planning discussions. The examinations were not changed.
The linkable administrative health data are also obtained annually, including LTCI data, health insurance claims data, data from public health check-ups (which are conducted to screen for lifestyle-related diseases and prevent the need for care at the municipality level and are thus independent of our health surveys) and data on mortality and emigration from Sukagawa municipality. In addition, inpatient medical payment (diagnosis procedure combination per-diem payment system: DPC/PDPS)26 and laboratory (blood and urine) test data of both inpatients and outpatients from Iwase General Hospital are also being gathered. A brief summary of the collected administrative data is shown in Supplementary Table S2, available as Supplementary data at IJE online.
What has it found?
The baseline characteristics of the cohort are summarised in Tables 1-3. The characteristics of cohort members obtained via the baseline questionnaire are shown in Table 1. Among the 6890 participants who responded to the questionnaire, 3265 (47.4%), 1951 (28.1%), 1169 (17.0%) and 505 (7.3%) were aged 75–79, 80–84, 85–89 and ≥90 years, respectively. The proportion of male participants was 41.3%. Regarding health-related QOL, the mean scores on the SF-8™ decreased with increasing age categories. The mean scores on the Physical Component Summary ranged from 39.3 to 48.0 and those on the Mental Component Summary ranged from 47.9 to 50.5 among age categories. The number of cohort members who had a history of hypertension and diabetes was 3852 (55.9%) and 960 (13.9%), respectively; these prevalences were lower than those reported in Japan in 2014.27 In addition, the prevalence of a history of acute coronary syndrome and stroke was 11.3% and 3.5%, respectively. About 9% of the participants reported being ‘partly disabled’ or ‘totally disabled’ in at least one of the five basic activities of daily living (ADLs): bathing, dressing, transferring, toileting and eating. Moreover, about one-third of the cohort members reported being ‘partly disabled’ or ‘totally disabled’ in at least one of the five instrumental ADLs: public transportation, shopping, food preparation, paying bills and accounting.28 The proportions of participants who had difficulty in performing basic and instrumental ADLs increased with increasing age categories, from 3.0% to 35.2% and 14.0% to 75.6% respectively. The proportions of current smokers and heavy alcohol drinkers were relatively low.29 Regarding socioeconomic factors, about 14% of the participants were living alone, and more than 15% of them were experiencing financial stress (those who answered ‘somewhat’ or ‘seriously’) across all age categories.
Characteristics of the participants obtained from the baseline questionnaire in 2017–18
| Total | Age Categories | ||||
|---|---|---|---|---|---|
| Variables | 75–79 | 80–84 | 85–89 | 90+ | |
| n = 6890 | 3265 (47.4) | 1951 (28.3) | 1169 (17.0) | 505 (7.3) | |
| Gender | |||||
| Men | 2848 (41.3) | 1479 (45.3) | 795 (40.7) | 429 (36.7) | 145 (28.7) |
| Women | 4042 (58.7) | 1786 (54.7) | 1156 (59.3) | 740 (63.3) | 360 (71.3) |
| General health condition | |||||
| Health-related quality of life (SF-8™),a mean (SD) | |||||
| Physical Component Summary (PCS) | 45.5 (9.0) | 48.0 (7.4) | 44.6 (9.1) | 42.3 (9.7) | 39.3 (9.8) |
| Mental Component Summary (MCS) | 49.7 (6.9) | 50.5 (6.2) | 49.3 (7.3) | 49.0 (7.5) | 47.9 (7.5) |
| Physical Functioning (PF) | 45.6 (9.9) | 48.4 (7.7) | 44.6 (10.1) | 42.2 (11.2) | 38.2 (12.2) |
| Role-Physical (RP) | 46.2 (9.8) | 48.9 (7.9) | 45.3 (9.9) | 42.9 (10.6) | 39.1 (11.7) |
| Bodily Pain (BP) | 49.0 (9.1) | 50.6 (8.5) | 48.3 (9.4) | 47.3 (9.3) | 45.8 (9.5) |
| General Health perception (GH) | 49.6 (7.4) | 50.8 (7.3) | 49.1 (7.5) | 48.1 (7.1) | 47.5 (6.8) |
| Vitality (VT) | 49.3 (7.3) | 50.8 (6.8) | 48.8 (7.6) | 47.5 (7.4) | 46.0 (7.4) |
| Social Functioning (SF) | 48.0 (9.2) | 50.0 (8.1) | 47.1 (9.6) | 46.0 (9.8) | 43.5 (10.1) |
| Role-Emotional (RE) | 48.2 (8.2) | 49.8 (6.7) | 47.5 (8.4) | 46.4 (9.1) | 43.9 (10.9) |
| Mental Health (MH) | 50.2 (7.1) | 51.2 (6.5) | 49.6 (7.6) | 49.2 (7.4) | 47.8 (7.7) |
| Medical history | |||||
| Cancer | 901 (13.1) | 444 (13.6) | 254 (13.0) | 157 (13.4) | 46 (9.1) |
| Stroke | 238 (3.5) | 83 (2.5) | 76 (3.9) | 58 (5.0) | 21 (4.2) |
| Acute coronary syndrome | 780 (11.3) | 286 (8.8) | 249 (12.8) | 169 (14.5) | 76 (15.0) |
| Hypertension | 3852 (55.9) | 1760 (53.9) | 1101 (56.4) | 686 (58.7) | 305 (60.4) |
| Diabetes | 960 (13.9) | 484 (14.8) | 266 (13.6) | 155 (13.3) | 55 (10.9) |
| Depression | 139 (2.0) | 59 (1.8) | 45 (2.3) | 25 (2.1) | 10 (2.0) |
| Functional status | |||||
| Low basic ADLb | 628 (9.1) | 99 (3.0) | 165 (8.5) | 186 (15.9) | 178 (35.2) |
| Low instrumental ADLb | 2059 (29.9) | 458 (14.0) | 636 (32.6) | 583 (49.9) | 382 (75.6) |
| Health-related behaviours | |||||
| Current smoker | 460 (6.7) | 274 (8.4) | 124 (6.4) | 47 (4.0) | 15 (3.0) |
| Heavy alcohol drinkerc | 1387 (20.1) | 841 (25.8) | 355 (18.2) | 154 (13.2) | 37 (7.3) |
| Socioeconomic factors | |||||
| Living alone | 991 (14.4) | 438 (13.4) | 289 (14.8) | 192 (16.4) | 72 (14.3) |
| Financial stressd | 1161 (16.9) | 519 (15.9) | 382 (19.6) | 176 (15.1) | 84 (16.6) |
All values except those for health-related quality of life (SF-8™) are expressed as numbers (%).
SD, standard deviation; ADL, activities of daily living.
Standardized score calculated using a Japanese standard scoring algorithm.
Answered ‘partly disabled’ or ‘totally disabled’.
Alcohol 20 g for 3 or more days per week.
Answered ‘somewhat’ or ‘seriously’.
Results from the subset of participants who underwent examinations at the hospital/public health centres in 2017–2018
| Total | Age categories | ||||
|---|---|---|---|---|---|
| Variables | 75–79 | 80–84 | 85–89 | 90+ | |
| n = 1129 | 694 (61.5) | 273 (24.2) | 131 (11.6) | 31 (2.7) | |
| Gender | |||||
| Men | 520 (46.1) | 325 (46.8) | 127 (46.5) | 53 (40.5) | 15 (48.4) |
| Women | 609 (53.9) | 369 (53.2) | 146 (53.5) | 78 (59.5) | 16 (51.6) |
| Physical examination | |||||
| Body mass index | |||||
| <18.5 kg/m2 | 67 (5.9) | 36 (5.2) | 17 (6.2) | 11 (8.4) | 3 (9.7) |
| 18.5 to <25 kg/m2 | 760 (67.3) | 466 (67.1) | 186 (68.1) | 85 (64.9) | 23 (74.2) |
| ≥25 kg/m2 | 302 (26.7) | 192 (27.7) | 70 (25.6) | 35 (26.7) | 5 (16.1) |
| Blood pressure | |||||
| Systolic pressure ≥140 mmHg or | |||||
| Diastolic pressure ≥90 mmHg | 482 (42.7) | 288 (41.5) | 108 (39.6) | 69 (52.7) | 17 (54.8) |
| Grip strength | |||||
| Men: <26 kg | |||||
| Women: <18 kg | 177 (15.7) | 61 (8.8) | 65 (23.8) | 34 (26.0) | 17 (54.8) |
| Cognitive examination | |||||
| Mini-Cog© | |||||
| ≤2 points | 110 (9.7) | 34 (4.9) | 40 (14.7) | 27 (20.6) | 9 (29.0) |
All values are expressed as numbers (%).
Results from the subset of participants who underwent further examinations at the hospital in 2017–18
| Total | Age categories | ||||
|---|---|---|---|---|---|
| Variables | 75–79 | 80–84 | 85–89 | 90+ | |
| n = 702 | 465 (66.2) | 159 (22.7) | 59 (8.4) | 19 (2.7) | |
| Physical examination | |||||
| 10 Metre Walk Test | |||||
| ≤0.8 m/s | 43 (6.1) | 4 (0.9) | 19 (11.9) | 13 (22.0) | 7 (36.8) |
| Muscle mass (bioimpedance analysis) kg/m2, mean (SD) | 16.0 (1.7) | 16.1 (1.7) | 15.9 (1.7) | 15.6 (1.6) | 15.2 (0.9) |
| Men | 17.4 (1.4) | 17.5 (1.3) | 17.3 (1.3) | 16.9 (1.8) | 16.0 (0.5) |
| Women | 14.9 (0.9) | 14.9 (0.9) | 14.8 (1.0) | 14.8 (0.9) | 14.8 (0.8) |
| Cognitive examination | |||||
| Mini-Mental State Examination (MMSE) | |||||
| ≤23 points | 34 (4.8) | 10 (2.2) | 13 (8.2) | 8 (13.6) | 3 (15.8) |
All values except those for muscle mass are expressed as numbers (%).
SD, standard deviation.
The results of the additional health survey are shown in Table 2. Among the 1129 participants who voluntarily participated, the prevalence of obesity (BMI ≥25 kg/m2)30 was more than 15% across all age categories. The examinations associated with sarcopenia31 revealed that the proportions of individuals with weak grip strength (<26 kg in men and <18 kg in women) increased with increasing age categories. The proportion of cohort members with suspected cognitive impairment according to the results of the Mini-Cog© was 9.7% overall and ranged from 4.9% (aged 75–79 years) to 29.0% (aged ≥90 years) by age category.
The results of further examinations are shown in Table 3. Among the 702 participants who completed the survey at the hospital regarding the sarcopenia screening,31 43 (6.1%) had a walking speed of 0.8 m/s or slower and mean muscle mass measured by bioimpedance analysis was 16.0 kg/m2 [standard deviation (SD) 1.7]; 17.4 kg/m2 (SD 1.4) in men and 14.9 kg/m2 (SD 0.9) in women. None were considered to have low muscle mass, which has criteria of <7.0 kg/m2 in men and <5.7 kg/m2 in women. In 34 (4.8%) participants, the MMSE score was ≤23 points.
We have reported several studies based on this cohort. We found a positive association between the accumulation of advanced glycation end products and hearing impairment, suggesting that age-related hearing impairment may be preventable by avoiding advanced glycation end products-rich meals.32 Another study suggested that both higher salt intake levels and weight were associated with higher systolic blood pressure, which provided evidence and a rationale for lifestyle modification not only for hypertension management but also for prevention at the population level.33 We also reported that gait speed was associated with an overactive bladder, including urgency and urgency incontinence, which may provide a new framework for overactive bladder management with respect to functional mobility.34
What are the main strengths and weaknesses?
Several strengths of this cohort warrant mention. First, this is a unique population-based cohort, which consists of super-elderly aged ≥75 years at the baseline. The participants are representative of the healthy elderly population living in the area, since all eligible individuals in the area received the baseline questionnaire, and the response rate was relatively high (72.1%).35 Second, this population is particularly vulnerable to negative health outcomes, such as physical and mental disability, hospitalization, institutionalization and death, which have large impacts on a super-aged society not only from a medical perspective but also from the economic and social viewpoints. Thus, a substantial number of outcomes of interest are likely to occur during the short follow-up period. Third, we can follow most of the cohort participants using administrative data from the municipal government including information regarding death, as these data will continue to be collected unless participants withdraw their consent. Fourth, we collect PROs, such as health-related QOL, subjective health status, lower urinary tract symptoms, visual function, dental status and quality of sleep, which are not collected from routine practice and administrative data but are of great relevance to older adults. Fifth, our health survey includes physical and cognitive function examinations, which are not performed in routine practice. Sixth, this cohort is linked to a variety of administrative data, such as health insurance, LTCI and medical care data from hospitals. Using these data, we can investigate not only multiple health outcomes not captured in our health survey, but also medical and nursing care costs which are important from a societal perspective. These distinctive data may help explore factors affecting healthy ageing and societal burden.
However, several limitations associated with this study must also be mentioned. First, our data, which were derived from a Japanese municipality, may not be generalizable to communities in other countries. Second, some responses to the self-report questionnaires from the cohort members with cognitive impairment may be inaccurate owing to cognitive decline in this population. Nevertheless, we excluded individuals who were certificated as care level 3 or higher in the LTCI, who needed total care in their daily lives. Therefore, persons with major cognitive impairment were not likely to be included in our cohort. Third, as it was optional, participation in the additional survey was low. Accordingly, there may have been participation bias in the additional survey because individuals in good health may have been more likely to participate. Fourth, data on the diagnosis coded in Japanese health insurance claims may not reflect an individual’s actual disease(s). However, some studies have evaluated the validity of diagnosis records in Japanese administrative data and reported high sensitivity, specificity or positive predictive value in general, which support the usefulness of these data.36–38 Finally, despite the advantage of being able to analyse medical and nursing care costs using these data, data on the indirect costs associated with such care are unavailable.
Can I get hold of the data? Where can I find out more?
The data underlying this article will be shared on reasonable request to the corresponding author. The data pertaining to this cohort are held by FMU and Sukagawa City. Copies of the questionnaires are available on request (in Japanese). Potential collaborators should contact the research manager of the Center for Innovative Research for Communities and Clinical Excellence (CiRC2LE), FMU. All proposals are evaluated by the research committee at CiRC2LE, based on their importance, the feasibility of the research questions and the background of the applicants. Applications will be granted only after obtaining approval from the ethics committee of FMU. We welcome new opportunities for collaborative studies. Any enquiries and proposals should be directed to the administrative office of the Sukagawa Study at [[email protected]].
The Sukagawa Study is a population-based cohort that was conducted to evaluate the factors influencing the health-related quality of life, physical and psychological disability, nursing care requirements and costs of medical and nursing care among very old people.
The target population of this cohort was residents of Sukagawa City, Fukushima, Japan, aged ≥75 years who were relatively independent. The baseline questionnaire was sent to all eligible residents.
The Sukagawa Study enrolled 6890 participants in the cohort from 2017 to 2018, with plans for more than 8 years of follow-up.
Data were collected annually through self-administered questionnaires, physical examinations, cognitive examinations, laboratory tests and administrative health data, such as long-term care insurance data, health insurance claims data and mortality data.
We welcome new proposals for collaborative research.
Supplementary Data
Supplementary data are available at IJE online.
Funding
This work was supported by Sukagawa City, and the municipality was involved in the announcement and administration of the project, distribution of questionnaires and data collection, but had no role in the analyses or publication of research articles.
Acknowledgements
We are grateful to the government officers of the Department of Health Care and Welfare, Sukagawa City, who were involved in participant recruitment and organizing and conducting the Sukagawa Healthy Longevity Project, as well as to Naoaki Yamaga for data administration and technical support. We also would like to thank SET Software (Tokyo, Japan) for developing the system and database for this cohort. We sincerely thank Prof. Thomas S. Inui (Department of Health Policy and Management, Johns Hopkins Bloomberg School of Public Health) for his helpful advice concerning our project and this manuscript. We also thank Editage [www.editage.com] for English language editing.
Members of Sukagawa Study Group: Takeshi Hasegawa,a,b,c Nobuyuki Yajima,a,b,d,e Kakuya Niihata,f Hidekazu Iida,f,g Susumu Kobayashi,h Sho Sasaki,e,i Hiroki Nishiwaki,b,c and Ryoji Tominaga.j aCenter for Innovative Research for Communities and Clinical Excellence (CiRC2LE), Fukushima Medical University, Fukushima, Japan; bShowa University Research Administration Center (SURAC), Showa University, Tokyo, Japan; cDivision of Nephrology, Department of Medicine, Showa University Fujigaoka Hospital, Yokohama, Japan; dDivision of Rheumatology, Department of Medicine, Showa University School of Medicine, Tokyo, Japan; eDepartment of Health Care Epidemiology, School of Public Health in the Graduate School of Medicine, Kyoto University, Kyoto, Japan; fDepartment of Clinical Epidemiology, Graduate School of Medicine, Fukushima Medical University, Fukushima, Japan; gYou Home Clinic, Tokyo, Japan; hDepartment of Internal Medicine, Health Co-op. Watari Hospital, Fukushima, Japan; iDepartment of Nephrology/Clinical Research Support Office, Iizuka Hospital, Fukuoka, Japan; jDepartment of Orthopaedic Surgery, Fukushima Medical University, Fukushima, Japan
Author Contributions
T.N. and S.T. contributed equally to the writing of this manuscript. T.T. and N.K. assisted in the preparation of the manuscript. All authors, including the members of the Sukagawa Study Group, contributed to the cohort design and establishment and acquisition and interpretation of data. All authors critically reviewed the manuscript, approved its final version and agree to be accountable for all aspects of the work in ensuring that questions related to the accuracy or integrity of any part of the work are appropriately investigated and resolved.
Conflicts of Interest
None declared.
References
Vital, Health and Social Statistics Office.
Statistics Bureau.
Health Service Division.
Household Statistics Office.
Author notes
Joint first authors.

