


Abstract
Central nervous system (CNS) tumours comprise 20% of childhood cancers worldwide. Whether childhood CNS tumour incidence has increased over time across geographic regions remains to be explored.
We identified CNS cancers in the Cancer in Five Continents (CI5) data and estimated age standardized incidence rates (ASRs; cases/million children) and 95% confidence intervals (95% CI), male-to-female incidence rate ratios (IRR; 95% CI) and average annual percent change in incidence (AAPC; 95% CI) by geographic region for children aged 0–19 years where data were available using Poisson regression and generalized estimating equations (GEE). Cancers included: astrocytic tumours, medulloblastoma, ependymal, oligodendroglial and mixed glioma, glioma of uncertain origin, and other embryonal tumours. Geographic regions were defined using the United Nations geoscheme.
There were 56 468 CNS cancers included in the study. ASRs were highest for astrocytic tumours globally in 2012 (ASR: 5.83; 95% CI: 5.68–5.99). Globally, all cancers exhibited a male excess in incidence. Regionally, only medulloblastoma had a consistently elevated male-to-female IRR at 1.4–2.2. Globally, incidence decreased for astrocytic tumours in GEE models (AAPC: −1.66; 95% CI: −3.04 to −0.26) and increased for medulloblastoma (AAPC 0.66; 95% CI: 0.19–1.14), ependymal tumours (AAPC: 1.49; 95% CI: 1.49; 95%: 0.69–2.30), glioma of uncertain origin (AAPC: 4.76; 95% CI: 1.17–1.14) and other embryonal tumours (AAPC: 3.58; 95% CI: 2.03–5.15). Regional variation in incidence trends was observed. Countries moving from lower to higher Human Development Index (HDI) over time did not appear to drive observed incidence trends.
Epidemiologic and molecular studies on underlying mechanisms for changes in the global incidence of CNS tumours are necessary.
Astrocytic tumours, the most commonly diagnosed paediatric central nervous system (CNS) tumours globally, decreased from 1988 to 2012.
Incidence of other CNS tumour types, including medulloblastoma and ependymal tumours, increased from 1988 to 2012.
Changes in CNS tumour incidence occurred regardless of a country’s human development index (HDI) improvement from 1990 to 2012.
Introduction
Central nervous system (CNS) tumours are the most common solid childhood malignancy, comprising 20–25% of cancers among 0–19-year-olds globally.1,2 Childhood CNS tumours are composed of >100 histologic subtypes, which vary in incidence by geography and age.3 The tremendous histologic heterogeneity4 in CNS tumours hinders aetiologic studies, thereby limiting identification of environmental risk factors, aside from ionizing radiation.5,6
The USA7 and European nations8,9 have the highest incidence of childhood CNS tumours. Incidence of childhood CNS tumours is lower in Central and South America10 and Asia.11,12 There is scant information on childhood CNS tumour incidence in Africa.13 Although we can compare and contrast incidence across studies, drawing firm conclusions around international variation in childhood CNS tumour incidence remains challenging as studies in lower income nations are scarce and studies often include different histologic subtypes and time periods.
CNS tumours afflict thousands of children worldwide and contribute to substantial years of life lost due to premature death.14 Unfortunately, it is not clear whether childhood CNS tumour incidence has increased over time across geographic regions, which would further perpetuate the increased morbidity and mortality experienced by children and adolescents diagnosed with CNS tumours around the globe. Therefore, we used the Cancer in Five Continents (CI5) data15 to estimate incidence rates and changes in incidence as a means to characterize trends in childhood CNS tumours from 1988 to 2012 using various histologic categories available for global regions for children aged 0–19 years at diagnosis.
Methods
Data source
Using the peer-reviewed, publicly available International Agency for Research on Cancer (IARC) CI5 data gathered from cancer registries worldwide, we included 56 468 incident CNS tumours diagnosed in children aged 0–19 years. Available cancer case and population counts were extracted from CI5 registries for Volume VII: 1988–92, Volume VIII 1993–97, Volume IX: 1998–2002, Volume X: 2003–07 and Volume XI: 2008–12 where the same histologies were available.16 Due to sample size limitations, regions comprised of various cancer registries (Supplementary Table S1, available as Supplementary data at IJE online), rather than countries, were used to compare trends in CNS tumour incidence. Regions included were Northern Africa, Sub-Saharan Africa, The Caribbean, Central America, South America, North America, Eastern Asia, Southeastern Asia, Southern Asia, Western Asia, Eastern Europe, Northern Europe, Southern Europe, Western Europe and Oceania (Figure 1). As the data are publicly available, no IRB approval for this study was necessary.

Map of countries included in the analysis for the age-standardized rates for the years 2008–12, Cancer in Five Continents colour coded by region. The number of registries included for each region over all available time periods are as follows: Northern Africa (2), Sub-Saharan Africa (5), The Caribbean (3), Central America (1), South America (27), North America (13), Eastern Asia (46), Southeastern Asia (12), Southern Asia (17), Western Asia (15), Eastern Europe (14), Northern Europe (8), Southern Europe (54), Western Europe (36) and Oceania (3)
Measures of incidence were aggregated over regions defined by the United Nations geoscheme system with some modifications.17 We re-aggregated Africa into two rather than the five United Nations Statistics Division (UNSD)-defined regions due to limited sample size and variation in available registries over the defined time period. Oceania was not divided into UNSD-defined regions because data primarily consisted of New Zealand and Australia, with registries in other areas having inconsistent data across time periods. We excluded Central Asia as it lacked registry data for two or more time periods. To increase the amount of data per region, we did not impose a cutoff for the number of cases needed to include a cancer or registry in the analyses. General inclusion criteria for the CI5 registries have been described in detail elsewhere.16
Cancer classification
CI5-defined CNS tumours were astrocytic tumours, medulloblastoma, ependymal tumours, oligodendroglial and mixed glioma, glioma of uncertain origin, and other embryonal tumours (mostly neuroectodermal and atypical teratoid/rhabdoid tumours). CI5 histology categories are based on International Classification of Disease 10 revision (ICD-10) codes, with additional International Classification of Diseases for Oncology third edition (ICD-O-3) codes that map closest to the International Classification of Childhood Cancer third edition (Supplementary Table S2, available as Supplementary data at IJE online).18 Intracranial germ cell tumours were excluded as data were inconsistently available from 1988 to 2012. Although there are reports of trends in international incidence for CNS tumours among children aged 0–4 years19 and ≥1520 years using the CI5, these analyses miss the most common age period for childhood CNS tumour diagnoses, 6–9 years of age.21 Therefore, we sought to characterize changes in CNS tumour incidence across the full age spectrum of childhood and adolescence for a more complete view of global variation.
Statistical analysis
Age-standardized incidence rates (ASRs) per million children and 95% confidence intervals (95% CI) were calculated for each histology. We obtained case and population counts for each registry and summed these values over the defined regions. Then, direct standardization was performed by weighting five-year age categories for each region using the World Health Organization’s (WHO) average population from 2000 to 2025.22 ASRs were also calculated for each tumour by region and time period. Some analyses were conducted with age at diagnosis stratified into two categories, 0–9 and 10–19 years at diagnosis, and weighting by 10-year age group was used. Incidence rates were not calculated for regions or time periods with <5 cases. Poisson regression was used to calculate trends in incidence by estimating the crude average annual percent change (AAPC).23 Regions with ≤1 ASR available from 1988 to 2012 (CI5 Volumes VII–XI) were excluded from AAPC estimates. The log population size was used as an offset term in the model to account for heterogeneity in population size. To correct for over dispersion in some regions or cancers, robust standard errors were used in all models. AAPC results were nearly identical in sensitivity analyses using the negative binomial model (results not shown). Male-to-female (referent) incidence rate ratios (IRR) and 95% CIs were calculated.24 IRRs were not calculated when there were <10 total cases per region.
We also grouped countries by 2012 Human Development Index (HDI) level as low, medium, high or very high, and change in HDI from 1990 to 2012 was classified as low to medium, low or medium to high, medium to very high, and high to very high.19 ASRs and AAPCs within these categories were calculated using the methods described above. Finally, we used generalized estimating equations (GEE) to produce population averaged estimates and account for clustering of the data by region and country. We specified an exchangeable correlation structure to obtain our GEE estimates. Adjusted GEE AAPC models controlled for age in 5-year categories, sex and 2012 HDI classification. For each tumour, we also obtained relative risks (RRs) and 95% CI using GEE for the variables from the adjusted model. All analyses were conducted using SAS software version 9.4 (Cary, NC). The map was created in ArcGIS Pro 2.4 (Environmental Systems Research Institute, Redlands, CA). Figures were generated in GraphPad Prism v8.0.0 (La Jolla, CA).
Results
Age-standardized incidence rates 2008–12
We identified 24 260 astrocytic tumours (53% male), 12 488 medulloblastomas (63% male), 6075 ependymal tumours (56% male), 2684 oligodendroglial and mixed gliomas (57% male), 6148 gliomas of uncertain origin (52% male) and 4813 other embryonal tumours (55% male). Using the most recent CI5 volume (2008–2012), we calculated the ASR and 95% CI for each CNS tumour overall and by region for children aged 0–19 years (Figure 2A–F, Supplementary Table S3, available as Supplementary data at IJE online). Globally, astrocytic tumours (ASR: 5.83; 95% CI: 5.68–5.99), medulloblastomas (ASR: 3.67; 95% CI: 3.54–3.79) and gliomas of uncertain origin (ASR: 3.09; 95% CI: 2.98–3.20) had the highest 2008–12 incidence rates. There was little variability in incidence rates by region and histology, with the exception of astrocytic tumours, which had the highest 2008–12 ASRs of any histology and these were driven by North American rates (ASR: 12.74, 95% CI: 12.16, 13.31). Sub-Saharan Africa had the lowest rate (ASR: 1.32, 95% CI: 0.75, 1.88).
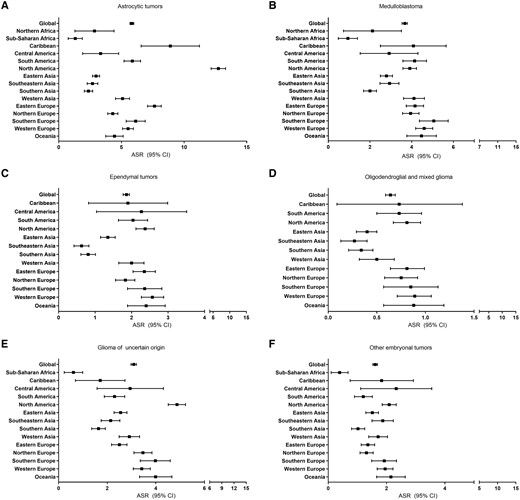
(A–F) ASRs and 95% CIs of CNS tumours by type for each region where 5 or more cases were available, Cancer in Five Continents (2008–12). Regions not listed in a graph did not have sufficient case numbers for inclusion. The number of registries included for each region over all available time periods are the same as shown in Figure 1
Rates were lower for other histologies. For medulloblastoma, ASRs were ∼4 cases/million for most regions except for Asian and African regions where ASRs were ∼2 cases/million. Most regions had rates of ∼1–2 cases/million for ependymal tumours. Oligodendroglial and mixed gliomas were the rarest tumours with ASRs <1 case/million globally. Rates of glioma of uncertain origin were variable. North America had the highest rate (ASR: 4.87, 95% CI: 4.51, 5.22) and Sub-Saharan Africa had the lowest (ASR: 0.61, 95% CI: 0.23, 0.99). For other embryonal tumours, the ASRs were all ∼2 cases/million, with the exception of Sub-Saharan Africa (ASR <0.4 cases/million). Supplementary Figure S1, available as Supplementary data at IJE online, shows regional ASRs over time by tumour type. For astrocytic tumours and oligodendroglial and mixed tumours, most ASRs decreased. Rates generally increased for medulloblastomas, ependymal tumours, gliomas of uncertain origin and other embryonal tumours.
Sex-ratio of CNS tumours 2008–12
To explore regional sex differences in incidence by histology, we calculated the male-to-female IRR for children diagnosed at ages 0–9 and 10–19 years in 2008–12 (Supplementary Figure S2, Supplementary Table S4, available as Supplementary data at IJE online). Trends were similar by five-year age groups (Supplementary Figure S3, available as Supplementary data at IJE online). Time trends for each region and cancer type (Supplementary Figure S4, Supplementary Table S5, available as Supplementary data at IJE online) suggest a consistent male excess for most regions, with the highest male-to-female IRRs seen in medulloblastoma. When considering global estimates, there is a male excess in incidence for astrocytomas and glioma of uncertain origin in the 10–19-year age group, whereas males had an excess for both age groups for all other histologic subtypes. When considering each tumour by region, only medulloblastoma showed a consistently increased male-to-female IRR, ranging from 1.4–2.2, mainly in the 0–9-year age group (Figure 3).
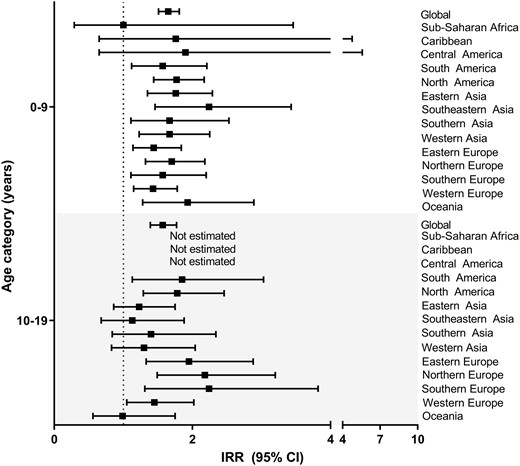
Male-to-female IRRs and 95% CIs for medulloblastoma by age group for regions with at least 10 cases available, Cancer in Five Continents (2008–12). The number of registries included for each region over all available time periods are the same as shown in Figure 1
Estimated AAPC
Next, we calculated the regional AAPC in incidence using all volumes of data (Figure 4, Supplementary Figure S5, Supplementary Table S6, available as Supplementary data at IJE online). There was variation in the AAPC by histology, region and age at diagnosis. Trends were similar when considering 5- (Supplementary Figure S5, available as Supplementary data at IJE online) and 10-year categories for age. Global trends indicate a decrease in astrocytic tumours and oligodendroglial and mixed gliomas in both age groups. Globally, incidence increased for medulloblastomas and ependymomas (0–9 years) and for gliomas of uncertain origin and other embryonal tumours (0–9 and 10–19 years).
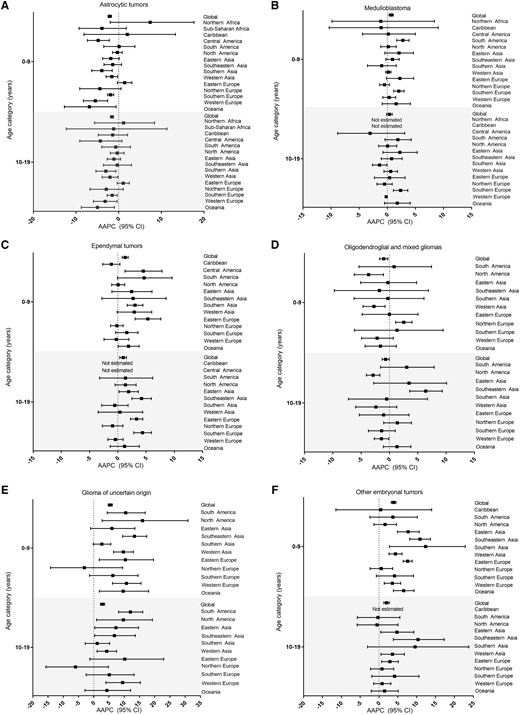
(A–F) Estimated AAPC in incidence and 95% CI by CNS tumour type and age group for regions with at least 5 cases available for three or more time periods, Cancer in Five Continents (1988–2012). The number of registries included for each region over all available time periods are as follows: Northern Africa (11), Sub-Saharan Africa (20), The Caribbean (11), Central America (5), South America (72), North America (21), Eastern Asia (114), Southeastern Asia (44), Southern Asia (52), Western Asia (40), Eastern Europe (47), Northern Europe (63), Southern Europe (202), Western Europe (142) and Oceania (37)
When considering regional trends, astrocytic AAPCs decreased over 1988–2012 in multiple regions across both age groups. Conversely, no decreasing AAPCs were noted among ependymal tumours and many regions displayed increased incidence rates over time for the younger ages (0–9 years). Medulloblastomas displayed some regional increases in incidence among children of all ages. There was variation observed in the AAPCs in incidence for oligodendroglial and mixed gliomas. Incidence decreased in North America, Western Asia and Western Europe and increased in Northern Europe and Southeastern Asia. Compared with other CNS tumours, gliomas of uncertain origin and other embryonal tumours showed the largest AAPCs that often exceeded 10% among both age groups for many regions.
AAPC among countries classified by HDI level
We conducted analyses stratified by HDI level to make inferences about changes in exposures and access to advanced medical care inlcuding the potential introduction and use of neuroimaging technologies, which occurred in the 1980s–90s in the USA and continues to increase in lower-income nations.13,25–27 When considering 2012 HDI levels, we observed increasing incidence over the study period for low and medium HDI among ependymal tumours, glioma of uncertain origin and other embryonal tumours (Supplementary Tables S7 and S8, available as Supplementary data at IJE online). In contrast, medulloblastoma incidence increased exclusively in countries with higher HDI, which also showed increases in glioma of uncertain origin and ependymal tumours.
When we considered AAPCs in incidence by countries changing HDI from lower to higher categories from 1990–2012 (Table 1), we observed increased incidence for medulloblastoma from countries moving from low/medium to high, increases in ependymal tumours and other embryonal tumours in all categories of HDI change, increased incidence in glioma of uncertain origin in tumours moving from lower to very high HDI and increased incidence of other embryonal tumours in all categories of changing HDI. Most increases in incidence were among the 0–9-year age category.
Incidence rates (cases per million children) by time period and age in years (y) at diagnosis and the AAPC and 95% CI in incidence over the time periods with available data for each tumour type by the change in HDI, Cancer in Five Continents (1988–2012)
| Age-standardized incidence ratea,b | |||||||||||||
|---|---|---|---|---|---|---|---|---|---|---|---|---|---|
| 1988–92 | 1993–97 | 1998–2002 | 2003–07 | 2008–12 | AAPC (95% CI)c,d | ||||||||
| Change in HDI | 0–9 y | 10–19 y | 0-9 y | 10–19 y | 0–9 y | 10–19 y | 0–9 y | 10–19 y | 0–9 y | 10–19 y | 0–9 y | 10–19 y | |
| Astrocytic tumours | Low to medium | 3.6 | 4.4 | 4.0 | 5.0 | 3.8 | 5.8 | 2.6 | 3.9 | 1.9 | 2.6 | −3.51 (−5.81, −1.21) | −2.81 (−6.11, 0.51) |
| Low/medium to high | 2.8 | 3.3 | 3.9 | 4.3 | 4.8 | 5.4 | 4.2 | 3.8 | 3.7 | 3.7 | 0.51 (−1.81, 2.81) | −0.61 (−3.01, 1.91) | |
| Medium to very high | 4.7 | 5.7 | 1.7 | 1.0 | 4.2 | 7.6 | 4.5 | 4.9 | 6.6 | 6.7 | 3.21 (−1.41, 8.11) | 2.21 (−5.01, 10.11) | |
| High to very high | 8.2 | 7.4 | 10.3 | 9.4 | 5.2 | 6.0 | 5.3 | 5.5 | 4.9 | 5.3 | −3.57 (−6.51, −0.54) | −2.52 (−4.71, −0.27) | |
| Overall | 7.9 | 7.6 | 8.7 | 8.2 | 6.2 | 6.6 | 5.8 | 6.1 | 5.7 | 5.9 | −2.16 (−3.56, −0.74) | −1.60 (−2.47, −0.72) | |
| Medulloblastoma | Low to medium | 3.3 | 1.6 | 3.0 | 1.8 | 4.2 | 1.7 | 3.7 | 1.6 | 2.3 | 1.3 | −1.01 (−4.21, 2.21) | −1.31 (−2.51, −0.11) |
| Low/medium to high | 2.2 | 1.1 | 3.1 | 1.1 | 3.6 | 2.2 | 3.9 | 2.0 | 4.1 | 1.8 | 2.51 (1.41, 3.61) | 2.01 (−1.41, 5.51) | |
| Medium to very high | 4.9 | 2.6 | 1.9 | 0.8 | 5.6 | 2.5 | 7.5 | 3.5 | 6.5 | 2.5 | 3.21 (−1.41, 8.11) | 2.21 (−3.71, 8.41) | |
| High to very high | 5.4 | 2.5 | 5.2 | 2.1 | 5.2 | 2.3 | 5.5 | 2.3 | 5.8 | 2.5 | 0.49 (−0.02, 1.01) | 0.33 (−0.44, 1.11) | |
| Overall | 4.5 | 2.0 | 4.6 | 2.0 | 4.9 | 2.1 | 5.0 | 2.1 | 5.1 | 2.2 | 0.70 (0.49, 0.90) | 0.38 (0.02, 0.75) | |
| Ependymal tumours | Low to medium | 0.6 | 0.6 | 0.7 | 0.5 | 0.7 | 0.7 | 1.0 | 0.5 | 0.9 | 0.4 | 2.71 (1.21, 4.21) | −1.71 (−4.51, 1.11) |
| Low/medium to high | 0.6 | 0.3 | 0.8 | 0.4 | 2.1 | 1.0 | 1.7 | 0.8 | 1.9 | 0.8 | 4.21 (0.11, 8.51) | 3.11 (−1.91, 8.41) | |
| Medium to very high | – | – | – | – | 1.1 | 0.9 | 2.5 | 1.3 | 3.1 | 1.7 | 14.61 (6.21, 23.61) | 10.51 (6.41, 14.71) | |
| High to very high | 2.3 | 1.1 | 2.3 | 1.2 | 2.6 | 1.1 | 3.0 | 1.4 | 2.7 | 1.2 | 1.05 (0.17, 1.94) | 0.59 (−0.74, 1.94) | |
| Overall | 2.1 | 1.0 | 1.9 | 1.0 | 2.4 | 1.1 | 2.4 | 1.1 | 2.6 | 1.1 | 1.30 (0.42, 2.18) | 0.92 (0.34, 1.51) | |
| Oligodendroglial and mixed glioma | Low to medium | – | 0.3 | 0.2 | 0.8 | 0.2 | 0.2 | 0.3 | 0.5 | 0.2 | 0.5 | 0.51 (−5.01, 6.21) | −0.71 (−6.81, 5.81) |
| Low/medium to high | 0.3 | 0.3 | 0.3 | 0.3 | 0.5 | 0.7 | 0.3 | 0.6 | 0.3 | 0.6 | 0.11 (−2.81, 3.01) | 2.91 (−1.11, 7.11) | |
| Medium to very high | – | – | – | 0.5 | 1.6 | 2.2 | 0.6 | 1.5 | 0.7 | 1.0 | 5.51 (−7.91, 20.81) | 3.21 (−5.91, 13.21) | |
| High to very high | 0.6 | 1.2 | 0.5 | 0.9 | 0.5 | 1.1 | 0.6 | 1.1 | 0.5 | 1.0 | −0.13 (−1.37, 1.13) | −0.18 (−1.70, 1.36) | |
| Overall | 0.5 | 1.0 | 0.5 | 0.9 | 0.6 | 1.1 | 0.5 | 0.9 | 0.4 | 0.8 | −0.99 (−3.14, 1.21) | −0.64 (−2.27, 1.01) | |
| Glioma of uncertain origin | Low to medium | 1.0 | 0.6 | 1.4 | 1.5 | 1.5 | 1.5 | 2.3 | 1.6 | 1.6 | 1.2 | 2.51 (−0.61, 5.61) | 1.11 (−2.81, 5.11) |
| Low/medium to high | 0.4 | – | 0.5 | 0.8 | 1.1 | 0.7 | 1.2 | 0.9 | 2.7 | 2.0 | 10.71 (7.21, 14.41) | 9.51 (4.51, 14.81) | |
| Medium to very high | 0.6 | – | 1.2 | 1.0 | 1.3 | 1.0 | 1.1 | 0.4 | 3.8 | 2.8 | 9.51 (3.11, 16.31) | 9.91 (−2.11, 23.41) | |
| High to very high | 3.1 | 2.1 | 1.4 | 0.9 | 1.1 | 0.8 | 1.5 | 1.0 | 4.3 | 2.3 | 3.95 (−4.13, 12.72) | 2.40 (−4.96, 10.32) | |
| Overall | 2.3 | 1.7 | 1.1 | 0.9 | 1.2 | 0.9 | 1.4 | 0.9 | 4.0 | 2.2 | 5.44 (−2.46, 13.97) | 2.85 (−3.70, 9.85) | |
| Other embryonal tumours | Low to medium | 0.4 | 0.2 | 0.3 | – | 0.2 | 0.1 | 1.3 | 0.5 | 1.4 | 0.5 | 10.71 (3.01, 19.01) | 9.71 (−0.61, 21.01) |
| Low/Medium to High | 0.3 | – | 0.5 | 0.3 | 1.7 | 0.8 | 1.6 | 0.6 | 1.8 | 0.6 | 6.01 (0.91, 11.41) | 4.91 (−1.91, 12.31) | |
| Medium to very high | 1.0 | – | 1.0 | 0.7 | 1.6 | 0.4 | 2.0 | 0.7 | 2.2 | 0.7 | 4.71 (3.31, 6.21) | 2.61 (−0.81, 6.01) | |
| High to very hHigh | 1.4 | 0.4 | 1.2 | 0.5 | 1.8 | 0.7 | 2.2 | 0.8 | 2.6 | 0.8 | 4.09 (2.54, 5.66) | 2.51 (0.51, 4.55) | |
| Overall | 1.3 | 0.4 | 1.2 | 0.5 | 2.2 | 0.8 | 2.4 | 0.7 | 2.5 | 0.7 | 3.89 (1.62, 6.21) | 1.99 (−1.04, 5.12) | |
Rates not calculated for strata with <5 cases are denoted by a dash (-).
Countries/territories (Puerto Rico, Martinique, New Caledonia, La Reunion, French Guiana, French Polynesia) without an assigned HDI were not included.
5 Countries moved from low to medium HDI, 17 countries moved from low or medium to high HDI, 5 countries moved from medium to very high HDI, 31 countries moved from high to very high HDI. AAPCs in bold are statistically significant.
AAPCs were not calculated for categories <5 cases for three or more time-periods.
Population average estimates of global changes in incidence 1988–2012
We used GEEs to account for correlation within countries and regions to estimate the population-averaged effect of time on incidence for CNS tumours globally (Figure 5). We observed that astrocytomas decreased (adjusted AAPC: −1.66; 95% CI: −3.04 to −0.26), oligodendroglial and mixed gliomas did not change (adjusted AAPC: −0.43; 95% CI: −1.70 to 0.87), and incidence increased for ependymal tumours (adjusted AAPC: 1.49; 95% CI: 0.69–2.30), glioma of uncertain origin (adjusted AAPC: 4.76; 95% CI: 1.17–8.47), medulloblastoma (adjusted AAPC: 0.66; 95% CI: 0.19–1.14), and other embryonal tumours (adjusted AAPC: 3.58; 95% CI: 2.03–5.15). Estimates were nearly identical in crude models.
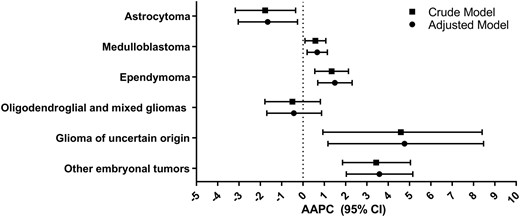
Global estimated AAPC in incidence and 95% CI by CNS tumours from GEE models for a crude and adjusted model (adjusted for age in 5-year categories, sex and 2012 HDI classification), Cancer in Five Continents (1988–2012)
In tumour-specific GEE models (Table 2), the RR for the effect of a 1-year increase in time demonstrates a global decrease in astrocytomas and an increase in ependymomas, glioma of uncertain origin and other embryonal tumours. When considering the GEE RRs for other variables, we observed a male excess in all tumours except glioma of uncertain origin. Compared with the 0–4 year age category, the RRs for ependymoma, glioma of uncertain origin and other embryonal tumours all demonstrate a decrease in incidence by increasing age category. Whereas, oligodendroglial and mixed gliomas increased across each age category. The age incidence patterns for astrocytoma demonstrated higher incidence in 5–9- and 10–14-year age categories. For medulloblastoma, we observed the highest incidence among the 5–9-year age group. We also observed the RRs were <1 for all HDI levels compared with very high HDI, with varying patterns and precision, but it should be noted that the sample sizes in the lower categories are much lower than that for the high and very high HDI levels (Supplementary Table S7).
RRs and 95% CIs from GEEs for each cancer type for a 1-unit increase year, male sex compared to female sex, age category at diagnosis, and 2012 HDI category, Cancer in Five Continents (1988–2012)
| Astrocytoma | Medulloblastoma | Ependymoma | Oligodendroglial and mixed gliomas | Glioma of uncertain origin | Other embryonal | |
|---|---|---|---|---|---|---|
| Variable | RR (95% CI) | RR (95% CI) | RR (95% CI) | RR (95% CI) | RR (95% CI) | RR (95% CI) |
| Per yeara | 0.98 (0.97–1.00) | 1.01 (1.00–1.01) | 1.01 (1.01–1.02) | 1.00 (0.98–1.01) | 1.05 (1.01–1.09) | 1.04 (1.02–1.05) |
| Sex | ||||||
| Female | Referent | Referent | Referent | Referent | Referent | Referent |
| Male | 1.08 (1.04–1.11) | 1.64 (1.57–1.70) | 1.19 (1.14–1.25) | 1.24 (1.15–1.33) | 1.02 (0.96–1.09) | 1.16 (1.08–1.23) |
| Age category (years) | ||||||
| 0–4 | Referent | Referent | Referent | Referent | Referent | Referent |
| 5–9 | 1.10 (1.02–1.18) | 1.19 (1.11–1.27) | 0.49 (0.44–0.54) | 1.17 (1.03–1.34) | 0.85 (0.71–1.01) | 0.35 (0.31–0.39) |
| 10–14 | 1.12 (1.02–1.22) | 0.63 (0.57–0.69) | 0.36 (0.33–0.36) | 1.79 (1.55–2.06) | 0.66 (0.55–0.79) | 0.25 (0.22–0.28) |
| 15–19 | 1.02 (0.90, 1.15) | 0.32 (0.30–0.34) | 0.33 (0.30–0.36) | 2.34 (2.11–2.60) | 0.51 (0.41–0.62) | 0.19 (0.15–0.22) |
| 2012 HDI level | ||||||
| Low | 0.79 (0.57–1.09) | 0.82 (0.52–1.29) | 0.77 (0.47–1.28) | 0.72 (0.38–1.38) | 0.28 (0.19–0.42) | 0.64 (0.39–1.04) |
| Medium | 0.53 (0.41, 0.70) | 0.75 (0.68–0.83) | 0.32 (0.23–0.44) | 0.39 (0.25–0.60) | 0.84 (0.59–1.19) | 0.48 (0.30–0.77) |
| High | 0.73 (0.49, 1.08) | 0.81 (0.63–1.04) | 0.68 (0.54–0.86) | 0.61 (0.45–0.82) | 0.61 (0.50–0.74) | 0.67 (0.47–0.95) |
| Very high | Referent | Referent | Referent | Referent | Referent | Referent |
RR represents a 1-year increase during 1988–2012 and is not an AAPC.
Discussion
In our study using international cancer registry data for children aged 0–19 years diagnosed with incident CNS tumours from 1988–2012, we observed varying incidence rates by histology and increasing incidence for some histologies. Astrocytic tumours had incidence rates 2–4-fold higher than those observed for other tumours, matching previous reports.28 The rate of astrocytic tumours was much higher in North America than elsewhere, suggesting regional variation in risk factors or reporting. As often reported, we observed consistently increased male-to-female IRRs in children with medulloblastoma when stratifying by region and for most CNS tumour types when considering global averages using GEE.10,28,29 When examining changes in incidence from 1988–2012, we observed a decreasing incidence of astrocytic tumours in most regions, whereas incidence increased for ependymal tumours, glioma of uncertain origin and other embryonal tumours across many regions for both the 0–9 and 10–19 age groups. These trends were similar to those observed when we used GEE to account for the underlying correlation by the clustering of data among countries and regions. When we considered changes in incidence across categories of HDI change, we did not observe stark differences in incidence for most tumours among countries moving from lower to higher HDI levels. Rather, the AAPCs in incidence were generally consistent across HDI change categories for each histology. In GEE models, we compared the risk of CNS tumour types between categories of 2012 HDI level and observed most lower HDI categories were associated with lower CNS tumour incidence compared with the very high HDI category, which has the most data available. As expected based on other reports and the biology of CNS tumours by histologic type, we observed variation in the age-incidence patterns among the CNS tumours using GEE, with the risk of medulloblastoma, other embryonal tumours, ependymal tumours and gliomas of uncertain origin higher among younger children whereas older children had a higher risk of developing astrocytomas and oligodendroglia and mixed gliomas.29,30 Collectively, the trends in CNS tumour incidence may represent geographic differences in genetic or environmental risk factors and improvement in histologic classification of tumours, but do not appear to be largely driven by societal advances as measured by change in HDI level.
Although we present a large, international, population-based study of paediatric CNS tumour incidence by tumour type, geographic region and age at diagnosis, there are limitations to our work. Due to small sample sizes, we were unable to stratify the histologic types further, which may be important for astrocytic tumours where non-malignant and malignant histologies are combined; however, non-malignant tumours are still relevant as they require treatment and leave children with treatment-related morbidities affecting quality of life.31 Comparisons of incidence rates between lower- and higher-income nations should be interpreted cautiously as not all population‐based registries collect data comparably,32 registries may be sparse in some regions, and childhood cancer diagnosis is hypothesized to be substantially underdiagnosed in Asian and African regions.33,CI5 data is limited in some regions, leaving us unable to determine whether observed incidence differences are due to regional variation in genetic susceptibility or risk factors, differences in registry reporting, or other factors. Access to neuroimaging, neurosurgery and neuropathology, is critical to CNS tumour diagnosis and is tantamount to having CNS-specialized radiologists in every health centre.26 Therefore, we cannot discount the importance of access to neuroimaging, which may be lacking in lower-income nations and undoubtedly impacts incidence rates.
One important limitation to our analyses is the lack of information on tumour behaviour. This is particularly relevant for the most common CNS tumour diagnosed in children, pilocytic astrocytoma. The CI5 data from the earlier volumes classified using ICD-O-2 codes was reclassified using ICD-O-3 codes, which the WHO published in 2000.34 After the ICD-O reclassification, pilocytic astrocytoma was regarded as non-malignant.35 It is unclear whether registries around the globe consistently collect information on non-malignant tumours. Therefore, some of the decrease in astrocytic tumour incidence may be due to the reclassification of pilocytic astrocytoma not captured in some registries. In regions collecting information on non-malignant tumours, such as North America, we did not observe a strong decrease in the rate of astrocytomas, which may reflect the continued reporting of pilocytic astrocytomas. Conversely, gliomas of uncertain origin increased in most regions in 2008–12, but these tumours did not experience an ICD-O reclassification.35 The observed increase could reflect a change in more accurate diagnoses, increased reporting around the globe and/or a true biologic increase in incidence. Unfortunately, we cannot disentangle these causes using CI5 data and rely on other international studies to resolve this issue.
We classified countries by change in HDI category as a means to assess changes in overall societal wellbeing that may accompany changes in CNS tumour incidence. For example, we have assumed that moving from low to high HDI over time indicates increased access to health care, presumably advanced neuroimaging, and/or is related to changes in risk factor patterns. In general, we observed consistent trends in incidence among countries moving from lower to higher HDI levels for each histology. Whereas the hypothesis that increased CNS tumour incidence in higher-income nations relative to lower income nations lies in access to neuroimaging,1 our data suggest that among tumour types that increased in incidence from 1988–2012, they tended to increase across all categories of HDI level change, suggesting that increased access to care may not be the only driver of differences in CNS tumour incidence across geographic regions. However, our analyses were exploratory in nature, included more high HDI countries, and warrant validation in studies with detailed neuroimaging data.
The regional variation in paediatric CNS tumour incidence could be due to underlying genetic susceptibility or variation in environmental risk factors; unfortunately, this information is not available in the CI5. We observed lower incidence rates for most CNS tumour types in children from Asian and African regions than in children from North America and Europe, as reported elsewhere using registry data.1 A proportion of the geographic variation may be due to differences in population genetics or regional variation in cancer predisposition syndromes known to cause CNS tumours, such as neurofibromatosis (NF1 and NF2), reviewed elsewhere.36 The role of common genetic variants remains to be explored among paediatric CNS tumours as necessary genomewide association studies from individuals with varying ancestry are lacking. Similarly, there are few established environmental risk factors for childhood CNS tumours. Epidemiologic risk factors for paediatric CNS tumours have been reviewed extensively,3 yet ionizing radiation is the only established environmental risk factor. The degree to which there is regional variation in ionizing radiation, genetic susceptibility, and other risk factors has yet to be defined using population-based methods.
To conclude, whereas astrocytic tumours are the most commonly diagnosed paediatric CNS tumours, their incidence varies tremendously by region and decreased globally from 1988–2012. Conversely, in regions with available data, incidence of other tumour types, including medulloblastoma, ependymal tumours and other embryonal tumours, has increased over this time period. We observed consistently lower incidence rates among children from Asian and African nations relative to children from North America and Europe, which could be due to underdiagnoses of childhood cancer in these regions, lack of registry reporting or risk factor differences. In exploratory analyses, we demonstrated that incidence increased across many levels of change in HDI, suggesting that increased societal well being may not be the only factor underlying regional differences in childhood CNS tumour incidence. Epidemiologic studies that explore regional differences in population genetics, risk factors, access to care and registry reporting are necessary.
Supplementary data
Supplementary data are available at IJE online.
Funding
This work was supported by the National Institutes of Health (grant T32 CA099936 [L.A.W. and A.K.H.]) and the Children’s Cancer Research Fund.
Conflict of interest
None declared.
References
United Nations Statistics Division. UNSD—Methodology. M49. https://unstats.un.org/unsd/methodology/m49/ (November 2017, date last accessed).
Author notes
Lindsay A Williams, Aubrey K Hubbard Co-first authors.

