


Abstract
Using longitudinal ultrasounds as an improved fetal growth marker, we aimed to investigate if fetal growth deceleration followed by rapid postnatal weight gain is associated with childhood cardiometabolic risk biomarkers in a contemporary well-nourished population.
We defined fetal growth deceleration (FGD) as ultrasound-measured 2nd-3rd-trimester abdominal circumference decrease by ≥0.67 standard deviation score (SDS) and rapid postnatal weight gain (RPWG) as 0–2-year-old weight increase by ≥0.67 SDS. In the GUSTO mother-offspring cohort, we grouped 797 children into four groups of FGD-only (14.2%), RPWG-only (23.3%), both (mismatch, 10.7%) or neither (reference, 51.8%). Adjusting for confounders and comparing with the reference group, we tested associations of these growth groups with childhood cardiometabolic biomarkers: magnetic resonance imaging (MRI)-measured abdominal fat (n = 262), liver fat (n = 216), intramyocellular lipids (n = 227), quantitative magnetic resonance-measured overall body fat % (BF%) (n = 310), homeostasis model assessment of insulin resistance (HOMA-IR) (n = 323), arterial wall thickness (n = 422) and stiffness (n = 443), and blood pressure trajectories (ages 3–6 years).
Mean±SD birthweights were: FGD-only (3.11 ± 0.38 kg), RPWG-only (3.03 ± 0.37 kg), mismatch (2.87 ± 0.31 kg), reference (3.30 ± 0.36 kg). FGD-only children had elevated blood pressure trajectories without correspondingly increased BF%. RPWG-only children had altered body fat partitioning, higher BF% [BF = 4.26%, 95% confidence interval (CI) (2.34, 6.19)], HOMA-IR 0.28 units (0.11, 0.45)] and elevated blood pressure trajectories. Mismatch children did not have increased adiposity, but had elevated ectopic fat, elevated HOMA-IR [0.29 units (0.04,0.55)] and the highest blood pressure trajectories. Associations remained even after excluding small-for-gestational-age infants from analyses.
Fetal growth deceleration coupled with rapid postnatal weight gain was associated with elevated childhood cardiometabolic risk biomarkers without correspondingly increased BF%.
Key Messages
We used dynamic growth information from longitudinal fetal ultrasounds rather than birthweight-for-gestational-age as a marker of poor fetal growth.
Children who experienced 2nd–3rd trimester fetal growth deceleration had elevated blood pressure trajectories without a corresponding increase in body fat %, arterial thickness or arterial stiffness, suggesting that poor fetal growth might affect blood pressure not through adiposity or changes in arterial structure, but possibly through poorer nephrogenesis.
Children who experienced 0–2-year-old rapid postnatal weight gain, regardless of their fetal growth rates, had elevated abdominal fat, intramyocellular lipids, insulin resistance and blood pressure trajectories in early childhood (ages 3–6 years), which could lead to greater cardiometabolic risk if these biomarkers tracked to adulthood.
Children who experienced a mismatch of fetal growth deceleration followed by rapid postnatal weight gain had the highest blood pressure trajectories and multiple elevated cardiometabolic risk biomarkers, without a corresponding increase in overall body fat %, suggesting that rapid postnatal weight gain might act as a ‘second-hit’ and increase the cardiometabolic risk in children who had experienced poor fetal growth.
Our findings highlight the importance of monitoring longitudinal growth patterns right from the fetal stage.
Introduction
The first 1000 days of life are a developmentally plastic and nutritionally sensitive period which may programme future cardiometabolic risk.1 From an evolutionary perspective, poor nutritional cues in utero enable predictive adaptive responses to maximize chances of survival in the predicted poor postnatal nutritional environment. However, when the postnatal nutritional environment is richer than predicted, predictive adaptive responses may become maladaptive and lead to increased cardiometabolic risk.2–4 This phenomenon is known as ‘developmental mismatch’, which has been supported by animal studies investigating mismatch between maternal and postnatal nutrition as well as epidemiological studies investigating mismatch between fetal and postnatal growth.2–10
Poor fetal growth, rapid postnatal weight gain (RPWG) and a combination of these two growth patterns have been associated with increased cardiometabolic risk.5,8,9,11–14 However, earlier studies often used low birthweight or small-for-gestational-age (SGA) as a crude proxy of poor fetal growth.5,8 These definitions might incorrectly classify neonates who were constitutionally small as having poor fetal growth.15 Hence, we studied fetal growth deceleration (FGD), defined as downward crossing of at least one major centile band [≥0.67 standard deviation score (SDS)] in fetal abdominal circumference charts between the 2nd and 3rd trimesters. Crossing down by at least one major centile band (0.67 SDS units) has been commonly used to assess growth deceleration, and crossing up by at least one major centile band has been used to assess growth acceleration, in both fetal and postnatal life.13,16 In addition, earlier studies on developmental mismatch have focused on extreme nutritional stresses in utero such as famine, intrauterine ligation or extreme caloric restriction in animal models.6,7,9 It is less clear if the adverse cardiometabolic risk associated with developmental mismatch manifests even in contemporary, well-nourished populations.
We aimed to evaluate the associations of FGD alone, RPWG alone and a combination of these growth patterns with early cardiometabolic alterations in childhood in an Asian mother-offspring cohort. We used an extensive panel of childhood cardiometabolic biomarkers: adiposity outcomes [anthropometry, body fat % (BF%), abdominal subcutaneous adipose tissue, visceral adipose tissue, intramyocellular lipids, liver fat], metabolic outcomes [fasting plasma glucose (FPG), fasting plasma insulin, insulin resistance] and cardiovascular outcomes (blood pressure, arterial thickness and stiffness). More sophisticated markers such as BF% and body fat partitioning to the abdomen, muscles and liver have been shown to be strong, independent correlates of cardiometabolic risk, above and beyond that of body mass index (BMI) alone.17–20 We hypothesize that the mismatch group with FGD followed by RPWG would be associated with the greatest alterations in cardiometabolic risk biomarkers, even in early childhood.
Methods
Study population
Children were part of the Growing Up in Singapore Towards healthy Outcomes (GUSTO) longitudinal mother-offspring cohort, detailed previously.21 Pregnant women in the first trimester were recruited (June 2009-September 2010) from KK Women’s and Children’s Hospital and National University Hospital, Singapore. Of 3751 women, 2034 were eligible, 1247 were recruited (response rate 61.3%) and 797 singletons with both fetal and postnatal growth data available were included (Supplementary Figure S1, available as Supplementary data at IJE online). Preterm (<37 completed weeks of gestation) infants were excluded, as World Health Organization (WHO) growth charts used to derive weight z-scores were not suitable for use in preterm infants. Data for different cardiometabolic assessments were not available for all children due to differential consent for measurement, data quality control and loss to follow-up. Precise sample sizes for different cardiometabolic outcomes are reported (Supplementary Figure S1). Written informed consent was obtained. The National Healthcare Group Domain Specific Review Board and SingHealth Centralized Institutional Review Board approved the study.
Exposures
Fetal abdominal circumference, a good indicator of fetal growth,22 was measured by trained ultrasonographers in the second [mean gestational age (±SD): 20.3 ± 0.8 weeks (wks)] and third (32.9 ± 0.7wks) trimesters. SDS were derived using the INTERGROWTH-21st standards.23 FGD was defined as a downward crossing of fetal abdominal circumference by at least one major centile band (change in SDS by ≥0.67 units) from the second to third trimester scan, similar to previous studies.24–26 Crossing down by at least one major centile band (0.67 SDS units) has been commonly used to assess growth deceleration, and crossing up by at least one major centile band has been used to assess growth acceleration, in both fetal and postnatal life.13,16
Birthweights were extracted from hospital medical records and weights (in grams) at age 2 years were measured (SECA803 Weighing Scale).27 SDS were derived according to WHO child growth standards,28 using the lambda-mu-sigma (LMS) method.29 RPWG was defined as an increase in weight by at least one major centile band (change in SDS by ≥0.67 units) from birth to age 2 years.13
Four growth groups were defined, depending on whether the child experienced FGD-only (14.2%), RPWG-only (23.3%), both FGD and RPWG (mismatch group) (10.7%) or neither (reference group) (51.8%).
Cardiometabolic risk biomarkers
At ages 4.5 and 6 years, weight (SECA803 Weighing Scale) and standing height (SECA213 stadiometer) were measured in 674 children.27 SDS of weight, height and BMI were derived using WHO growth standards.28 At age 6 years, high precision and accurate overall fat mass were obtained by Quantitative Magnetic Resonance (QMR) (EchoMRI-Adolescent Humans Body Composition Analyzer, EchoMRI Corp., Singapore) in a subset of 310 children.30 BF% was calculated by: [fat mass (kg)/total body weight (kg)]*100%
At age 4.5 years, abdominal magnetic resonance imaging (MRI) was performed without sedation using a Siemens Skyra 3 T magnetic resonance scanner to derive volumes of abdominal subcutaneous adipose tissue and visceral adipose tissue in millilitres (mL) in 262 children. 31,32 Intramyocellular lipids and liver fat were assessed by proton magnetic resonance spectroscopy (1H-MRS) in 227 and 216 children, respectively.33 Intramyocellular lipids were expressed as a percentage of the water signal and are proportional to lipid accumulation within skeletal muscles. Liver fat percentage by weight was calculated by averaging across the right and left liver lobe scans (detailed MRI and MRS protocols in Supplementary Section, available as Supplementary data at IJE online).
At age 6 years, after an overnight fast, venous fasting plasma glucose (FPG) was measured using the hexokinase enzymatic method (Abbott Architect c8000 analyzer at KK Women’s and Children’s Hospital and Beckman AU5800 analyzer at National University Hospital) in 429 children. Fasting insulin was measured using a sandwich immunoassay (Beckman DXL800 analyzer, Beckman Coulter) in 324 children. In 323 children, homeostasis model assessment (HOMA) of insulin resistance (HOMA-IR) was calculated as follows: HOMA-IR = [fasting insulin(mU/L)*FPG(mmol/L)]/22.5.34
Peripheral systolic blood pressure (SBP) and diastolic blood pressure (DBP) were measured from the right upper arm (Dinamap CARESCAPE V100, GE Healthcare, Milwaukee, WI) at ages 3 (n = 639), 4 (n = 586), 5 (n = 613) and 6 years (n = 565).35 At age 6 years, arterial wall thickness was assessed through carotid intima-media thickness (cIMT) using high resolution B-mode ultrasound, and arterial stiffness was assessed through carotid-femoral pulse wave velocity (PWV) by applanation tonometry in 422 and 443 children, respectively (detailed cIMT and PWV protocols in Supplementary Section).
Covariates
Maternal age, ethnicity, educational attainment, household income, parity and self-reported pre-pregnancy weight were collected at recruitment through interviewer-administered questionnaires. At ∼26–28 weeks of gestation, venous FPG was measured.36 Height was measured using a calibrated stadiometer (SECA213 Stadiometer, SECA Corp., Hamburg, Germany). Pre-pregnancy BMI (ppBMI) was calculated using this height and self-reported pre-pregnancy weight. Plasma cotinine level was measured by liquid chromatography-tandem mass spectrometry.37 Total gestational weight gain (GWG) was calculated from the difference between last measured antenatal weight (taken within 4 weeks from delivery) and self-reported pre-pregnancy weight. Child sex was taken from medical records. Gestational age (in weeks) was calculated based on first trimester crown-rump lengths assessed by trained ultrasonographers. Size at birth was categorized based on birthweight and gestational age using customized birth charts.38 Infants were categorized as low birthweight if they weighed less than 2500 g. Paternal height (in cm) was measured during the year 2 postnatal visits.
Statistical analysis
To compare differences between participants included and excluded in the study (n = 450 families excluded, n = 460 children excluded due to 10 pairs of twins), as well as those with and without at least one MRI/MRS measurement, blood glucose/insulin measurement and outcome measurement at year 6, two-tailed t tests were performed for continuous variables and chi square tests were performed for categorical variables. Multiple linear regression was performed to test associations between growth groups and childhood cardiometabolic risk biomarkers (anthropometry, BF%, abdominal fat, intramyocellular lipids, liver fat, FPG, fasting insulin, HOMA-IR, cIMT, PWV), with respect to the reference group. To gauge the magnitude of effects, adjusted differences between each growth group and the reference group were also expressed as a percentage change compared with the reference group (except for anthropometry z-scores where negative mean z-scores of the reference group prevent the meaningful evaluation of percentage change). Post-estimation pairwise comparisons using Tukey’s adjustment for multiple comparisons were also performed. Based on literature review, the following confounders which influence both fetal/postnatal growth and cardiometabolic outcomes were used: sociodemographic factors (maternal education, child sex and ethnicity), in-utero environmental factors (parity, pre-ppregnancy BMI, maternal height, gestational FPG, GWG, cotinine). To determine longitudinal associations of growth groups with SBP and DBP, linear mixed effects (LME) modelling, which accounts for correlation between repeated measures in the same participant, was performed using maximum likelihood estimation, assuming outcome data were missing at random39 and defining covariances as unstructured, to distinctly estimate all variances and covariances for individual growth curves.40 The models included a random intercept, random linear slope for age, an age-growth group interaction term and the same confounders as the regression model above. Using the ‘margins’ command in Stata, adjusted differences in LME-predicted blood pressure between each growth group and the reference group, while holding covariates constant at their mean values, were reported.
A few sensitivity analyses were performed. First, paternal height (available in 78.3% of participants) was added as a covariate in multiple linear regression models, due to its contribution to child growth.41 Since GWG and FPG could potentially be affected by fetal growth due to the temporal overlap in the collection of these variables, we also ran the model after removing GWG and FPG as confounders in multiple linear regression. Standardized residuals of blood pressure regressed on sex and height at each time point were calculated and their longitudinal associations with the growth groups were evaluated using the same LME model above, as blood pressure in growing children is closely related to sex and height. We adjusted for the rate of gestational weight gain from 15–35 weeks of gestation instead of total gestational weight gain, to ensure that this confounder was independent of gestational age. We also additionally adjusted for body fat partitioning at age 4.5 years, as it could be a potential mediator of metabolic and cardiovascular outcomes at age 6 years. Due to small sample sizes, we conducted multiple linear regression to determine the main effects of FGD, RPWG and their interaction term as a sensitivity analysis rather than as a main analysis. Multiple imputation using chained equations was performed to generate 50 imputed datasets for missing covariates (maternal education: n = 6, maternal height: n = 15, pre-pregnancy BMI: n = 63, FPG: n = 34, GWG: n = 71, cotinine: n = 88). The imputation model included all exposure, outcome and confounder variables included in this study.42 Multiple linear regression and LME models, whether including or excluding SGA infants, were performed on imputed datasets where Rubin’s combination rules were used to obtain pooled estimates.43 All analyses were performed using Stata 16.0 (StataCorp LP, TX).
Results
Cohort description
Of 1247 participants, 797 were classified into four growth groups (Supplementary Figure S1). Mothers of excluded children had lower education, household income and age (Supplementary Table S1, available as Supplementary data at IJE online). Excluded children had lower mean gestational age and birthweight but had similar childhood cardiometabolic outcomes compared with included offspring (Supplementary Table S2, available as Supplementary data at IJE online). Among 797 included participants, those with at least one MRI or MRS measurement were more likely to have lower maternal education, lower household income, lower proportion of nulliparous mothers, male offspring and Chinese, as well as higher maternal pre-pregnancy BMI and BF% at age 6 years compared with those without (Supplementary Table S3, available as Supplementary data at IJE online). Those with at least one child blood glucose or insulin measurement had similar parental and child characteristics compared with those without, except for slightly lower proportion of nulliparous mothers (40.5% vs 49.0%) (Supplementary Table S4, available as Supplementary data at IJE online). Those with at least one outcome measurement at age 6 years had similar parental and child characteristics compared with those without (Supplementary Table S5, available as Supplementary data at IJE online).
The mismatch and reference groups had higher maternal education and household income than the FGD-only and RPWG-only groups (Table 1). Compared with all other groups, the mismatch group had the highest proportion of nulliparous mothers (57.6%), mean plasma cotinine levels (4.73 ± 22.12 ng/mL) and mean height of parents, as well as lowest gestational age (38.67 ± 1.01wk) and birthweight (2.87 ± 0.31 kg). Groups which experienced FGD (mismatch, FGD-only) had lower gestational FPG and GWG and higher proportion of male offspring. Groups which experienced RPWG (mismatch, RPWG-only) had higher proportion of Indians. RPWG-only children had the highest mean z-BMI, z-Height, BF% and abdominal fat, and mismatch children had the highest mean FPG, fasting insulin, HOMA-IR and blood pressure (Table 2).
Demographic and clinical characteristics of study subjects in the four growth groups.
| Mismatch | FGD-only | RPWG-only | Reference | Total | |
|---|---|---|---|---|---|
| n = 85 | n = 113 | n = 186 | n = 413 | n = 797 | |
| Parental characteristics | |||||
| Maternal education | |||||
| <12 y | 26 (31.0%) | 55 (48.7%) | 75 (41.0%) | 146 (35.5%) | 302 (38.2%) |
| ≥12 y | 58 (69.0%) | 58 (51.3%) | 108 (59.0%) | 265 (64.5%) | 489 (61.8%) |
| Monthly household income | |||||
| High (≥S$6000) | 24 (31.2%) | 29 (26.6%) | 40 (23.1%) | 142 (37.1%) | 235 (31.7%) |
| Mid (S$2000–5999) | 42 (54.5%) | 63 (57.8%) | 109 (63.0%) | 196 (51.2%) | 410 (55.3%) |
| Low (<S$2000) | 11 (14.3%) | 17 (15.6%) | 24 (13.9%) | 45 (11.7%) | 97 (13.1%) |
| Parity | |||||
| Parous | 36 (42.4%) | 65 (57.5%) | 105 (56.5%) | 237 (57.4%) | 443 (55.6%) |
| Nulliparous | 49 (57.6%) | 48 (42.5%) | 81 (43.5%) | 176 (42.6%) | 354 (44.4%) |
| Paternal height (m) | 1.72 ± 0.05 | 1.71 ± 0.07 | 1.71 ± 0.07 | 1.71 ± 0.06 | 1.71 ± 0.06 |
| Maternal height (m) | 1.60 ± 0.05 | 1.59 ± 0.05 | 1.59 ± 0.06 | 1.58 ± 0.06 | 1.58 ± 0.06 |
| ppBMI (kg/m2) | 22.62 ± 4.77 | 22.91 ± 4.55 | 22.87 ± 4.59 | 22.65 ± 4.21 | 22.73 ± 4.40 |
| Gestational weight gain (kg) | 12.88 ± 4.96 | 13.02 ± 4.73 | 13.67 ± 5.67 | 14.02 ± 5.71 | 13.68 ± 5.50 |
| Maternal age (y) | 31.03 ± 5.14 | 31.71 ± 4.99 | 31.58 ± 4.95 | 31.57 ± 5.05 | 31.54 ± 5.02 |
| Maternal cotinine (ng/mL) | 4.73 ± 22.12 | 2.16 ± 11.28 | 2.46 ± 11.96 | 1.19 ± 7.94 | 2.01 ± 11.73 |
| Maternal FPG (mmol/L) | 4.28 ± 0.43 | 4.27 ± 0.42 | 4.41 ± 0.53 | 4.37 ± 0.46 | 4.35 ± 0.47 |
| Child characteristics | |||||
| Sex | |||||
| Female | 35 (41.2%) | 46 (40.7%) | 97 (52.2%) | 205 (49.6%) | 383 (48.1%) |
| Male | 50 (58.8%) | 67 (59.3%) | 89 (47.8%) | 208 (50.4%) | 414 (51.9%) |
| Ethnicity | |||||
| Chinese | 50 (58.8%) | 65 (57.5%) | 87 (46.8%) | 263 (63.7%) | 465 (58.3%) |
| Malay | 14 (16.5%) | 36 (31.9%) | 51 (27.4%) | 94 (22.8%) | 195 (24.5%) |
| Indian | 21 (24.7%) | 12 (10.6%) | 48 (25.8%) | 56 (13.6%) | 137 (17.2%) |
| Gestational age (wks) | 38.67 ± 1.01 | 38.90 ± 0.91 | 38.85 ± 1.07 | 39.25 ± 0.93 | 39.05 ± 0.99 |
| Birthweight (kg) | 2.87 ± 0.31 | 3.11 ± 0.38 | 3.03 ± 0.37 | 3.30 ± 0.36 | 3.17 ± 0.39 |
| Low birthweight | |||||
| No | 73 (85.9%) | 108 (95.6%) | 171 (91.9%) | 412 (99.8%) | 764 (95.9%) |
| Yes | 12 (14.1%) | 5 (4.4%) | 15 (8.1%) | 1 (0.2%) | 33 (4.1%) |
| Birthweight categories | |||||
| SGA | 20 (23.5%) | 12 (10.6%) | 28 (15.1%) | 15 (3.6%) | 75 (9.4%) |
| AGA | 65 (76.5%) | 85 (75.2%) | 140 (75.3%) | 303 (73.4%) | 593 (74.4%) |
| LGA | 0 (0.0%) | 16 (14.2%) | 18 (9.7%) | 95 (23.0%) | 129 (16.2%) |
Values in table are presented as mean ± SD or n (%). FGD, fetal growth deceleration; RPWG, rapid postnatal weight gain; ppBMI, pre-pregnancy body mass index; FPG, fasting plasma glucose; SGA, small-for-gestational-age; AGA, appropriate-for-gestational-age; LGA, large-for-gestational-age.
Cardiometabolic characteristics of study subjects in the four growth groups.
| Mismatch | FGD-only | RPWG-only | Reference | |
|---|---|---|---|---|
| n = 85 | n = 113 | n = 186 | n = 413 | |
| Anthropometry and adiposity outcomes | ||||
| 6-y z-BMI (SDS) (n = 674) | 0.18 ± 1.26 | −0.16 ± 1.57 | 0.66 ± 1.59 | −0.29 ± 1.06 |
| 6-y z-height (SDS) (n = 674) | 0.50 ± 1.05 | −0.33 ± 1.00 | 0.45 ± 0.97 | −0.30 ± 0.85 |
| 6-y body fat % (n = 310) | 19.36 ± 5.47 | 19.65 ± 8.24 | 23.57 ± 7.67 | 18.94 ± 5.36 |
| 4.5-y SAT (mL) (n = 262) | 590.32 ± 293.33 | 503.79 ± 337.84 | 807.90 ± 595.04 | 471.77 ± 197.19 |
| 4.5-y VAT (mL) (n = 262) | 200.07 ± 53.07 | 168.24 ± 52.15 | 220.07 ± 124.48 | 181.66 ± 51.82 |
| 4.5-y IMCL (% of water signal) (n = 227) | 0.48 ± 0.13 | 0.45 ± 0.20 | 0.55 ± 0.44 | 0.44 ± 0.21 |
| 4.5-y liver fat (% by weight) (n = 216) | 0.65 ± 0.40 | 0.52 ± 0.39 | 0.58 ± 0.40 | 0.53 ± 0.37 |
| 6-y metabolic outcomes | ||||
| Fasting glucose (mmol/L) (n = 429) | 4.64 ± 0.43 | 4.57 ± 0.34 | 4.56 ± 0.33 | 4.51 ± 0.36 |
| Fasting insulin (pmol/L) (n = 324) | 37.35 ± 23.08 | 26.56 ± 12.98 | 35.00 ± 24.66 | 26.69 ± 14.97 |
| HOMA-IR (units) (n = 323) | 1.17 ± 0.88 | 0.78 ± 0.40 | 1.03 ± 0.74 | 0.77 ± 0.45 |
| 6-y cardiovascular outcomes | ||||
| cIMT (mm) (n = 422) | 0.43 ± 0.04 | 0.42 ± 0.03 | 0.42 ± 0.03 | 0.42 ± 0.03 |
| PWV (m/s) (n = 443) | 4.82 ± 1.10 | 5.25 ± 2.24 | 4.91 ± 1.48 | 4.90 ± 1.58 |
| SBP (mmHg) (n = 565) | 102.80 ± 8.32 | 101.90 ± 9.25 | 101.48 ± 8.48 | 100.23 ± 8.12 |
| DBP (mmHg) (n = 565) | 61.98 ± 6.86 | 59.83 ± 5.39 | 59.81 ± 5.49 | 59.16 ± 5.48 |
Values in table are presented as mean ± SD or n (%). FGD, fetal growth deceleration; RPWG, rapid postnatal weight gain; BMI, body mass index; SDS, standard deviation score; SAT, subcutaneous adipose tissue; VAT, visceral adipose tissue; IMCL, intramyocellular lipid; HOMA-IR, homeostasis model assessment of insulin resistance; cIMT, carotid intima-media thickness; PWV, pulse wave velocity; SBP, systolic blood pressure; DBP, diastolic blood pressure.
Associations of growth groups with adiposity outcomes
Compared with the reference group, the mismatch and RPWG-only groups had elevated z-BMI [mismatch: 0.53 units (0.19, 0.88); RPWG-only: 0.98 units (0.72, 1.24)], abdominal subcutaneous adipose tissue [mismatch: 210.30 mL (52.74, 367.85); RPWG-only: 315.58 mL (196.23, 434.94) and visceral adipose tissue [mismatch: 40.17 mL (5.28, 75.06); RPWG-only: 38.03 mL (11.60, 64.46)]. However, only the RPWG-only group had increased overall BF% [4.26% [2.34, 6.19)], whereas the mismatch group had elevated intramyocellular lipids [0.13% of water signal (0.00, 0.26)] and liver fat [0.17% by weight (-0.01, 0.35)] (Figure 1A-F; Supplementary Table S6, available as Supplementary data at IJE online). In fact, the RPWG-only group had noticeably higher z-BMI, BF%, and abdominal subcutaneous adipose tissue than the FGD-only and mismatch groups (Supplementary Table S12, available as Supplementary data at IJE online). The FGD-only group was similar in adiposity outcomes to the reference group (Figure 1A-F; Supplementary Table S6). Relative to the reference group, these findings represent large percentage increases of 45%, 22%, 29% and 32% in abdominal subcutaneous adipose tissue, visceral adipose tissue, intramyocellular lipids and liver fat, respectively, in the mismatch group, compared with a relatively small percentage increase of 4% in BF%. They also represent large percentage increases of 23%, 67%, 21% and 21% in BF%, abdominal subcutaneous adipose tissue, visceral adipose tissue and intramyocellular lipids, respectively, in the RPWG-only group.
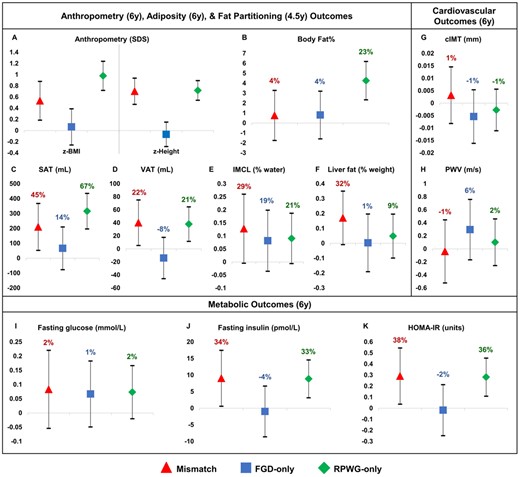
Associations with childhood cardiometabolic risk markers, according to growth groups and with respect to the reference group. Models are adjusted for maternal education, parity, pre-pregnancy BMI, gestational weight gain, maternal height, pregnancy fasting plasma glucose, cotinine, sex and ethnicity. Regression coefficients with 95% confidence intervals are shown. FGD, fetal growth deceleration; RPWG, rapid postnatal weight gain; SDS, standard deviation score; BMI, body mass index; SAT, subcutaneous adipose tissue; VAT, visceral adipose tissue; IMCL, Intramyocellular lipid; HOMA-IR, Homeostasis model assessment of insulin resistance; cIMT, carotid intima-media thickness; PWV, pulse wave velocity
Associations of growth groups with metabolic outcomes
Compared with the reference group, the mismatch and RPWG-only groups had elevated fasting insulin concentrations [mismatch: 9.04 pmol/L (0.61, 17.47); RPWG-only: 8.86 pmol/L (3.15, 14.57)] and HOMA-IR [mismatch: 0.29 units (0.04, 0.55); RPWG-only: 0.28 units (0.11, 0.45)] without elevated FPG at age 6 years (Figure 1I–K; Supplementary Table S6). The FGD-only group did not have clear alterations in metabolic outcomes compared with the reference group (Figure 1I–K; Supplementary Table S6) and had lower fasting insulin [-10.79 pmol/L (-22.14, 0.57)] and HOMA-IR [-0.39 units (-0.75, -0.04)] than the mismatch group (Supplementary Table S12). Relative to the reference group, these findings represent large percentage increases of 34%, 33%, 38%,] and 36% in fasting insulin (mismatch group), fasting insulin (RPWG-only group), HOMA-IR (mismatch group),] and HOMA-IR (RPWG-only group), respectively.
Associations of growth groups with cardiovascular outcomes
From age 3–6 years, mismatch children had the highest SBP and DBP LME trajectories (Figure 2). The differences in blood pressure between the mismatch and reference groups were more marked at age 3 years and were attenuated at age 6 years: age 3 years [SBP: 6.14 mmHg (3.97, 8.31); DBP: 3.04 mmHg (1.53, 4.54)], 4 years [SBP: 5.13 mmHg (3.42, 6.83); DBP: 2.75 mmHg (1.58, 3.92)], 5 years [SBP: 4.11 mmHg (2.41, 5.81); DBP: 2.46 mmHg (1.28, 3.64)], 6 years [SBP: 3.10 mmHg (0.95, 5.24); DBP: 2.18 mmHg (0.65, 3.70)] (Figure 2; Supplementary Table S7, available as Supplementary data at IJE online). Similarly, RPWG-only children had elevated SBP (age 3–6 years) and DBP (age 3–5 years) trajectories. The diastolic blood pressure trajectory of the FGD-only children was slightly higher than the reference children consistently from ages 3 to 6 years. The systolic blood pressure trajectory of the FGD-only children started at the same point as the reference children at age 3 years, but rose faster than the reference children till it converged with that of the RPWG-only children at age 6 years. None of the groups had substantial alterations in cIMT and PWV, with percentage changes relative to the reference group ranging from -1% to 6% (Figure 1G–H; Supplementary Table S6).
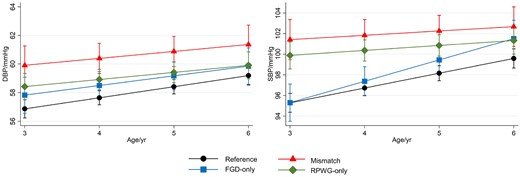
Association with blood pressure from 3–6 years old according to growth group, adjusted for maternal education, parity, pre-pregnancy BMI, gestational weight gain, maternal height, pregnancy fasting plasma glucose, cotinine, sex, and ethnicity in linear mixed models. Predicted blood pressures while holding all other covariates at their mean values at 3, 4, 5, 6 years old are shown (with 95% confidence intervals). Legend: FGD, fetal growth deceleration; RPWG, rapid postnatal weight gain; SBP, systolic blood pressure; DBP, diastolic blood pressure.
Sensitivity analysis
Associations remained similar after additional adjustment for paternal height, except that for RPWG-only children, magnitude of association with elevated metabolic outcomes at age 6 years increased slightly (Supplementary Table S8, available as Supplementary data at IJE online). After removal of GWG and FPG as confounders, associations remained similar, except that for the mismatch group, magnitude of association with elevated metabolic outcomes at age 6 years increased slightly (Supplementary Table S9, available as Supplementary data at IJE online). After using sex- and height-standardized blood pressures, mismatch children still had the highest overall SBP and DBP trajectories from ages 3–6 years, with the differences attenuated at age 6 years (Supplementary Figure S2, available as Supplementary data at IJE online). Associations remained similar after adjusting for rate of gestational weight gain instead of total gestational weight gain, except that association with fasting insulin in the mismatch group increased slightly (Supplementary Table S11, available as Supplementary data at IJE online). After additional adjustment for body fat partitioning at age 4.5 years, associations of the mismatch and RPWG-only groups with elevated fasting insulin and HOMA-IR were greatly diminished (Supplementary Table S13, available as Supplementary data at IJE online). Using an interaction model, we found that there is a marked negative interaction between FGD and RPWG for BF% [-4.30% (-7.90, -0.71)], concordant with our finding that a combination of FGD and RPWG was linked to lower BF% than an RPWG-only growth pattern (Supplementary Table S15, available as Supplementary data at IJE online).
After performing multiple imputation to account for missing confounders, associations remained similar, except that for the mismatch group, magnitude of associations with metabolic outcomes increased: higher FPG [0.13 mmol/L (0.01, 0.26); excluding SGA infants: 0.18 mmol/L (0.03,0.32)], fasting insulin [11.88 pmol/L (4.33, 19.44); excluding SGA infants: 12.54 pmol/L (3.41, 21.66)] and HOMA-IR [0.44 units (0.20, 0.68); excluding SGA infants: 0.48 units (0.19, 0.77)] (Supplementary Table S10, available as Supplementary data at IJE online). From LME models after multiple imputation, the mismatch group still had the highest SBP and DBP from ages 3–6 years compared with all other growth groups, whether including or excluding SGA infants from the analyses (Supplementary Figure S3, available as Supplementary data at IJE online).
Discussion
Poor in-utero growth and accelerated postnatal growth in the developmentally plastic first 1000 days of life have been linked to adverse cardiometabolic outcomes in adulthood. However, the precise pathways through which early life growth patterns influence later life cardiometabolic outcomes are not fully known, as most of the current results have been obtained from retrospective studies in adults. The current study, based on a prospective birth cohort, addresses some of these gaps by investigating how fetal growth deceleration, rapid postnatal weight gains in infancy or a combination of these two patterns alter cardiometabolic biomarkers in childhood.
We found that rapid weight gain from age 0 to 2 years, whether with or without previous fetal growth deceleration, was associated with a cluster of unfavourable cardiometabolic markers manifesting as early as age 3 years in an Asian cohort. Compared with the reference group which did not experience fetal growth deceleration or rapid postnatal weight gain, the RPWG-only group had elevated BF% (+23%) accompanied by elevated HOMA-IR (36%), subcutaneous adipose tissue (+67%), visceral adipose tissue (+21%) and intramyocellular lipids (+21%). However, it was notable that despite a much lower elevation in BF% (+4%), children in the mismatch group also had elevated HOMA-IR (+38%), subcutaneous adipose tissue (+45%), visceral adipose tissue (+22%) and intramyocellular lipids (+29%). The mismatch group also had a marked elevation in liver fat compared with the RPWG-only group (+32% vs +9%). The associations were not attenuated after excluding SGA children from the analysis, indicating that the above associations are not driven by children with extreme birthweights. The associations of the RPWG-only and mismatch growth patterns with HOMA-IR at age 6 years (y) was lost when we adjusted for the body fat partitioning at age 4.5 y, suggesting that fat partitioning may act as a mediator. Our findings also indicate that alterations in fat partitioning and HOMA-IR may emerge even before elevation in adiposity in children with the mismatch growth pattern.
Among all the growth groups, the mismatch group had the highest systolic and diastolic blood pressure trajectories between 3 to 6 years, followed by the RPWG group. The systolic blood pressure at age 6 years in the FGD-only children was close to that of the reference group at age 3 years, but was comparable to that of RPWG-only group at age 6 years, despite FGD-only children being leaner and shorter. Long-term blood pressure is regulated by the kidney. In humans, nephrogenesis (formation of nephrons which are the functional units of the kidney) ceases by 34–36 weeks of gestation. Poor fetal growth in the second and third trimester therefore can influence both nephron endowment and developmental programming of kidney function.44–46 The effects of fetal growth deceleration on blood pressure was amplified with increasing body size (which increases the filtration load) as the children grew older, and with rapid postnatal weight gain.47,48
Children in both the FGD-only group and the mismatch group experienced downward centile crossing in utero. This is likely to be a fetal response to prenatal perturbations such as maternal undernutrition or placental insufficiency, and not due to constitutional factors. However, metabolic characteristics, body fat partitioning and BF% in the FGD-only group were very similar to the reference group. Our results suggest that early alterations in the above characteristics in children who experienced fetal growth deceleration require a second hit in the form of rapid postnatal growth. Further follow-up of these children is required to evaluate if the effects of an adverse intrauterine environment are unmasked as they grow older.
Children in all four growth groups had similar arterial thickness and arterial stiffness at age 6 y, likely due to small inter-individual variability of these measures in early childhood.49,50 Thus, increase in arterial thickness and stiffness does not seem to play a role in the elevations in blood pressure observed in FGD-only, mismatch and RPWG-only groups. Further longitudinal tracking of these children is required to check if alterations in these cardiometabolic markers emerge later in life and to understand the development of differential cardiometabolic risk.
Although we have detected elevations in cardiometabolic risk markers in the mismatch, FGD-only and RPWG-only groups, there is limited evidence to conclude whether these changes are clinically significant in childhood, because of the absence of any hard clinical endpoints which will mainly become evident only in the later stages of life. However, since cardiometabolic risk factors tend to track to adulthood,51,52 children in the RPWG-only, FGD-only and mismatch groups are likely to be at increased risk of adverse cardiometabolic outcomes in adulthood. The alterations in the risk markers in the FGD-only and mismatch group emerged even without increased adiposity. Thus these alterations may be further accentuated if these children become obese later in life. These findings also highlight the importance of monitoring both fetal and childhood growth patterns for early risk stratification, as size at birth or overweight/obesity status alone may not be sufficient to identify all children who may be at elevated cardiometabolic risk.
Our findings were consistent with literature which reported increased subcutaneous adipose tissue, visceral adipose tissue,53,54 total body fat, BF%,13,55 BMI13,56 and fasting insulin57 associated with rapid weight gain in childhood. Our findings were also consistent with literature on the adverse cardiometabolic outcomes of poor fetal growth followed by rapid postnatal growth.5,8,9,11–14 For the mismatch group, other studies have reported increased android/gynoid fat ratio, fat mass index, abdominal fat and BMI at age 6 years,24 increased visceral fat index and liver fat at age 10 years25 and elevated blood pressure in school-age children and adulthood.12,26 We go on to demonstrate that adverse body fat partitioning alterations manifest as early as age 4.5 years, and elevated blood pressures manifest as early as age 3 years in Asian children.
Our findings contrast with some previous reports which have suggested that accelerated postnatal growth after poor fetal growth may occur with preferential fat accumulation.4,53 The mismatch group, which experienced RPWG after FGD, did not have elevations in overall BF%. This could potentially be due to the way mismatch was characterized. In the current work, we defined mismatch as having slower growth in utero and accelerated growth in infancy. Older works have used low birthweight as a proxy for poor fetal growth, which cannot separate the effects of constitutional factors from prenatal perturbations.15 Furthermore, some studies have also noted the absence of excess fat in the mismatch group58 and reported that catch-up after poor fetal growth might not necessarily involve preferential fat mass accretion.59,60 Our findings suggest that the impact of the mismatch growth pattern might first be on increased ectopic fat accumulation, rather than on increased adiposity. Further investigation is warranted to resolve these conflicting findings on phenomenon of preferential catch-up fat accumulation.
One strength of our study is the use of serial ultrasound measures to measure fetal growth deceleration even if it did not result in extremes of fetal or birth size. Although retrospective cohort studies have revealed links between early life growth patterns and cardiometabolic outcomes in adulthood, the precise mechanisms are not fully understood. The extensive phenotyping of cardiometabolic risk markers like body composition, fat partitioning, insulin resistance, blood pressure, arterial thickness and arterial stiffness during childhood in the current study provides insights into the potential pathways through which early life growth patterns could influence later health outcomes. Identifying early cardiometabolic alterations of high-risk growth groups in a large prospective cohort provides evidence for risk stratification in children and provides impetus to uncover underlying mechanisms.
Our limitations include the fact that our study included only Asian children and excluded preterm infants. Hence, findings from our multi-ethnic Asian cohort might not be generalizable to other populations or to preterm children. Participants with MRI/MRS measures were of slightly lower socioeconomic status and had slightly higher maternal and child adiposity than those without, which might lead to potential bias. We also acknowledge that some children might be classified as having undergone RPWG/FGD due to regression to the mean. Although we have adjusted for sociodemographic and maternal confounders in our analyses, we acknowledge that fetal/postnatal growth and cardiometabolic outcomes might be further influenced by unmeasured behavioural, environmental, nutritional and genetic confounders. We have suggested possible aetiologies underlying our findings, but this paper is not focused on the etiologies of the four growth groups and further studies are needed to understand them.
In conclusion, rapid weight gain from ages 0 to 2 years, whether with or without poor fetal growth, is associated with a cluster of elevated cardiometabolic risk markers in early childhood. Notably, children with a mismatch between poor fetal growth and rapid postnatal weight gain had elevated insulin resistance and ectopic fat accumulation and the highest blood pressure trajectory in early childhood, even without a corresponding elevation in BF%. Children with fetal growth deceleration in the absence of rapid postnatal weight gain also had elevated systolic blood pressure without having elevated BF%. The emergence of cardiometabolic alterations, even without increased adiposity, in the mismatch and FGD-only groups is troubling, as these changes may be further accentuated with later life obesity. Our work highlights the role of longitudinal growth monitoring in both the fetal and the postnatal period for early risk stratification, as screening based on size at birth or BMI at a single time point may not be able to uncover all children who may be at increased cardiometabolic risk.
Supplementary data
Supplementary data are available at IJE online.
Funding
This work was supported by the Singapore National Research Foundation under its Translational and Clinical Research (TCR) Flagship Programme and administered by the Singapore Ministry of Health’s National Medical Research Council (NMRC), Singapore (NMRC/TCR/004-NUS/2008, NMRC/TCR/012-NUHS/2014). Additional funding is provided by the Singapore Institute for Clinical Sciences, Agency for Science Technology and Research (A*STAR), Singapore. K.M.G. is supported by the UK Medical Research Council (MC_UU_12011/4), the National Institute for Health Research [NIHR Senior Investigator (NF-SI-0515–10042)] and the NIHR Southampton Biomedical Research Centre, and the European Union (Erasmus+ Programme Early Nutrition eAcademy Southeast Asia) (573651-EPP-1–2016-1-DE-EPPKA2-CBHE-JP).
Acknowledgements
We would like to thank all study participants and the GUSTO study group: Allan Sheppard, Amutha Chinnadurai, Anne Eng Neo Goh, Anne Rifkin-Graboi, Anqi Qiu, Arijit Biswas, Bee Wah Lee, Birit F P Broekman, Boon Long Quah, Borys Shuter, Chai Kiat Chng, Cheryl Ngo, Choon Looi Bong, Christiani Jeyakumar Henry, Claudia Chi, Cornelia Yin Ing Chee, Yam Thiam Daniel Goh, Doris Fok, E Shyong Tai, Elaine Tham, Elaine Quah Phaik Ling, Evelyn Chung Ning Law, Evelyn Xiu Ling Loo, Falk Mueller-Riemenschneider, George Seow Heong Yeo, Helen Chen, Heng Hao Tan, Hugo P S van Bever, Iliana Magiati, Inez Bik Yun Wong, Ivy Yee-Man Lau, Jeevesh Kapur, Jenny L Richmond, Jerry Kok Yen Chan, Joanna D Holbrook, Joanne Yoong, Joao N Ferreira., Jonathan Y Bernard, Joshua J Gooley, Kenneth Kwek, Krishnamoorthy Niduvaje, Kuan Jin Lee, Leher Singh, Lin Lin Su, Ling-Wei Chen, Lourdes Mary Daniel, Mark Hanson, Mary Foong-Fong Chong, Mary Rauff, Mei Chien Chua, Melvin Khee-Shing Leow, Michael Meaney, Neerja Karnani, Ngee Lek, Oon Hoe Teoh, P C Wong, Paulin Tay Straughan, Pratibha Agarwal, Queenie Ling Jun Li, Rob M van Dam, Salome A Rebello, Seang-Mei Saw, Seng Bin Ang, Shang Chee Chong, Shirong Cai, Shu-E Soh, Sok Bee Lim, Stella Tsotsi, Chin-Ying Stephen Hsu, Sue Anne Toh, Swee Chye Quek, Victor Samuel Rajadurai, Walter Stunkel, Wayne Cutfield, Wee Meng Han, Wei Wei Pang, and Yin Bun Cheung.
Author contributions
Y.Y.O. analysed data, interpreted data and wrote the manuscript. N.M. contributed to the analysis, interpretation of data and drafting of manuscript. S.A.S, I.M.A., M.T.T., W.L.Y., J.Y.H., Y.H.C., S.N., S.L.L., S.S.V., M.V.F., K.M.G., L.P.S., K.H.T., P.D.G., F.Y., J.T.C., L.H.L., K.T., L.C., N.K., Y.S.C., J.G.E., M.E.W., S.Y.C., N.M. and Y.S.L. contributed to the concept and design of the study. I.M.A., J.Y.H., Y.H.C. and Y.S.L. contributed to the analysis and interpretation of data. S.A.S., I.M.A., M.T.T., W.L.Y., J.Y.H., Y.H.C., S.N., S.L.L., S.S.V., M.V.F., K.M.G., L.P.S., K.H.T., P.D.G., F.Y., J.T.C., L.H.L., K.T., L.C., N.K., Y.S.C., J.G.E., M.E.W., S.Y.C., and Y.S.L. made critical revisions of the manuscript for important intellectual content. Y.Y.O., N.M. and Y.S.L. have primary responsibility for the final content.
Conflict of interest
K.M.G., P.D.G. and Y.S.C. are part of an academic consortium that has received research funding, and they have received reimbursement for speaking at conferences sponsored by companies selling nutritional products. All other authors declare no potential conflict of interest that might bias the submitted work and no other relationships or activities that could appear to have influenced the submitted work.
References
WHO Multicentre Growth Reference Study Group. WHO Child Growth Standards: Length/Height-For Age, Weight-For-Age, Weight-For-Length, Weight-For-Height and Body Mass Index-For-Age, Methods and Development. Geneva: World Health Organization,
Author notes
Joint last authors.

