


Abstract
Early puberty is a risk indicator for adult diseases. Identification of modifiable causes of earlier puberty is, therefore, warranted. We estimate the association between childhood body mass index (BMI) and pubertal timing in a cohort study and in a sibling-matched study to adjust for unobserved time-stable confounders shared within families.
For the cohort study, 11 046 of 22 439 (49%) invited children, born 2000–203, from the Danish National Birth Cohort (DNBC) had information on childhood BMI at 7 years and self-reported, half-yearly puberty information from 11 years on Tanner stages, menarche, voice break, first ejaculation, acne, and axillary hair. For the sibling-matched study, 1700 brothers and sisters were included among 86 820 live-born singletons from the DNBC.
Childhood overweight (85th ≤ BMI < 95th percentile) and obesity (BMI ≥ 95th percentile) were associated with earlier age attaining the pubertal milestones in a dose-dependent manner in boys and girls. When modelling all pubertal milestones simultaneously, the pubertal milestones were attained earlier in: overweight boys: −3.1 [95% confidence interval (CI): −4.5, −1.7] months, overweight girls: −5.5 (95% CI: −7.1, −3.9) months, obese boys: −3.5 (95% CI: −5.1, −2.0) months, obese girls: −5.2 (95% CI: −7.1, −3.4) months compared with normal weight (BMI < 85th percentile) children. In the sibling-matched study, higher BMI was associated with earlier age at attaining most pubertal milestones in girls, but only a tendency toward earlier pubertal timing was observed in boys.
Childhood overweight and obesity were associated with earlier pubertal timing even after adjustment for unobserved time-stable confounders shared within families.
Childhood overweight and obesity were associated with earlier puberty in a dose-dependent manner in boys and girls in the cohort analysis.
Higher childhood body mass index was associated with earlier puberty even after adjustment for unobserved time-stabled confounders shared within families in a sibling-matched analysis of sisters.
Only a tendency toward earlier pubertal timing for higher childhood body mass index was observed for brothers in the sibling-matched analysis.
Introduction
A time trend toward earlier puberty in girls has been observed in many countries, but a time trend is less established in boys.1–7 This is a concern, as early puberty has been related to adult diseases such as depression, obesity, type 2 diabetes, cardiovascular disease, and cancers.8–11 Some authors have suggested the time trend to be partly attributable to the increase in childhood obesity.7,12–15 Childhood obesity is associated with hyperandrogenism, insulin resistance and compensatory hyperinsulinism,16 which may initiate earlier puberty either by modulation of the hypothalamus-pituitary-gonadal axis17 or by increasing the bioavailability of sex hormones through insulin’s effect on the liver, adrenals, ovaries and adipose tissue.15 Several epidemiological studies have found obese girls to have earlier age at menarche and onset of breast development than normal-weight girls,14,15,18–21 but studies on boys have found conflicting results.5,22–33 Genetic factors and socioeconomic factors may, however, have confounded the reported association between childhood obesity and pubertal timing.34,35 Siblings raised together share a number of potential confounding factors, including socioeconomic factors and half of their genes. This can be exploited in a sibling-matched design, which removes confounding by time-stable and shared factors.36
In this study, we estimate the association between childhood body mass index (BMI) and timing of puberty, using a cohort design and a sibling-matched design.
Methods
Study populations
These cohort and sibling-matched study designs were based on the Danish National Birth Cohort (DNBC)37 and its sub-cohort, the Puberty Cohort. The DNBC comprises approximately 100 000 children and their mothers. Mothers were recruited by their general practitioners during early gestation, from 1996 through 2002. Information on pregnancy, maternal health and child health was collected twice during pregnancy and twice during infancy by telephone interviews, and at 7 and 11 years by questionnaires.
Children eligible for this study were live-born singletons born 1996–2003, whose mothers participated in the first interview in the DNBC (n = 86 820). During the 11-year follow-up in the DNBC, 45 794, of these children provided information on pubertal development. To obtain longitudinal information on puberty, we sampled 22 439 of the 56 641 eligible children who were born 2000–03, to constitute the Puberty Cohort. To increase the statistical power, these children were sampled according to 12 different prenatal exposures, hypothesized to be causes of earlier pubertal timing, as well as a random sample of 8000 children.38 From August 2012, these 22 439 children were invited half-yearly to provide information on pubertal development through web-based questionnaires, from the age of 11.5 years until 18 years or full maturity (defined as Tanner stage 5 for pubic hair and genital development in boys and Tanner stage 5 for pubic hair and breast development in girls). The half-yearly questions on puberty in the Puberty Cohort were identical to the questions on puberty in the 11-year follow-up. By October 2018, 14 756 children had returned at least one questionnaire, and the data collection is still ongoing. When adding data from the 11-year follow-up, 15 819 children from the Puberty Cohort returned at least one questionnaire on pubertal development.
For the cohort study, information on childhood BMI obtained from the 7-year follow-up in the DNBC was available for 12 964 (58%) of the 22 439 children invited to participate in the Puberty Cohort (Figure 1). Of these children with information on childhood BMI, 11 046 children also provided information on pubertal development (participation rate: 49% of those invited to the Puberty Cohort) (Figure 1). We will refer to the analysis of these children as the cohort analysis.
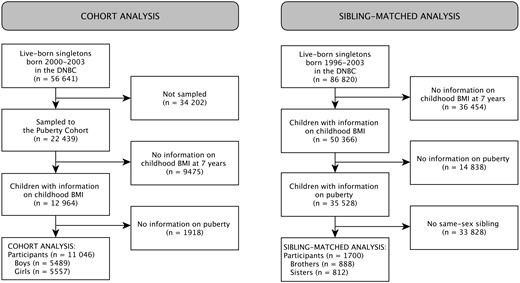
Flow chart of children included in the cohort analysis and the sibling-matched analysis. BMI, body mass index; DNBC, Danish National Birth Cohort; FU, follow-up.
For the sibling-matched study, we identified all live-born singletons in the DNBC (n = 86 820) who had available information on childhood BMI (n = 50 366) from the 7-year follow-up and information on puberty (n = 35 528), as part of the 11-year follow-up in the DNBC or the half-yearly follow-up in the Puberty Cohort (Figure 1). Among these singletons were 888 brothers and 812 sisters (Figure 1). We will refer to the analysis of these siblings as the sibling-matched analysis.
Exposure
Childhood BMI was derived from height (cm) and weight (kg) reported by the mothers at a median age of 7.1 (25th–75th percentile: 7.0–7.2) years. Childhood BMI percentiles were derived,39 and children were then categorized as normal weight (BMI <85th percentile), overweight (85th ≤ BMI < 95th percentile) and obese (BMI ≥ 95th percentile).
Outcome
Information on current status of the following pubertal milestones was collected: voice break (yes, no), first ejaculation (yes, no; if yes: year and month), menarche (yes, no; if yes: year and month), acne (yes, no), axillary hair (yes, no) and Tanner stages (1 to 5) for pubic hair development and breast development or genital development.40,41 Tanner stages were illustrated with line drawings assisted by a short description of each stage. The questionnaire is available online.42
Covariates
In the cohort analysis, confounders were identified by use of a directed acyclic graph (Supplementary Figure 1, available as Supplementary data at IJE online).43 Potential confounders were highest educational class of parents, maternal smoking in first trimester, maternal pre-pregnancy BMI, maternal age at menarche, parity, birthweight, childhood diet, childhood physical activity, and childhood sedentary behaviour. Birthweight and parity were obtained from the Danish Medical Birth Registry.44 Highest educational class of the parents was obtained from Statistics Denmark and classified according to the International Standard Class of Occupation and Education codes (ISCO-88 and ISCED). Maternal smoking in first trimester, maternal pre-pregnancy BMI, and maternal age at menarche were obtained from the first interview in pregnancy scheduled around week 12. Servings per week of sugary drinks, fruit, vegetables and candy as well as hours per day of physical activity and sedentary behaviour were obtained from the 7-year follow-up in the DNBC. Covariates were categorized or kept continuous as shown in Table 1.
Cohort analysis: baseline characteristics by childhood weight group
| Normal weighta(n = 9450) | Overweighta(n = 914) | Obesea(n = 682) | Missing | |
|---|---|---|---|---|
| Characteristics | No. (%) | No. (%) | No. (%) | No. (%) |
| Highest educational class of parents | 23 (0.2) | |||
| High-grade professional | 2568 (27.2) | 181 (19.9) | 135 (19.9) | |
| Low-grade professional | 3222 (34.2) | 301 (33.1) | 208 (30.6) | |
| Skilled worker | 2468 (26.2) | 282 (31.0) | 190 (27.9) | |
| Unskilled worker | 1175 (12.5) | 146 (16.0) | 147 (21.6) | |
| Smoking in first trimester | 35 (0.3) | |||
| Non-smoker | 7109 (75.5) | 618 (67.8) | 426 (62.7) | |
| 1-10 daily cigarettes | 1878 (19.9) | 241 (26.4) | 178 (26.2) | |
| >10 daily cigarettes | 433 (4.6) | 53 (5.8) | 75 (11.0) | |
| Pre-pregnancy BMI | 137 (1.2) | |||
| <18.5 | 679 (7.3) | 26 (2.9) | 20 (3.0) | |
| 18.5–24.9 | 6101 (65.3) | 491 (54.6) | 289 (42.9) | |
| 25.0–29.9 | 1816 (19.5) | 247 (27.4) | 204 (30.3) | |
| 30.0+ | 740 (7.9) | 136 (15.1) | 160 (23.8) | |
| Maternal age of menarche | 70 (0.6) | |||
| Earlier than peers | 2298 (24.5) | 244 (26.9) | 209 (30.7) | |
| Same time as peers | 5394 (57.5) | 548 (60.5) | 371 (54.5) | |
| Later than peers | 1697 (18.1) | 114 (12.6) | 101 (14.8) | |
| Parity | 0 (0.0) | |||
| First child | 4776 (50.5) | 469 (51.3) | 305 (44.7) | |
| Second or later child | 4674 (49.5) | 445 (48.7) | 377 (55.3) | |
| Birthweight, mean (SD), grams | 3519 (586) | 3680 (601) | 3676 (626) | 41 (0.4) |
| Sugary drinks, mean (SD), servings per week | 2.0 (3.0) | 2.0 (3.2) | 2.0 (3.0) | 32 (0.3) |
| Fruit, mean (SD), servings per week | 11.4 (6.7) | 11.3 (6.9) | 11.7 (7.3) | 13 (0.1) |
| Vegetables, mean (SD), servings per week | 9.1 (6.5) | 8.7 (6.3) | 8.2 (6.4) | 11 (0.1) |
| Candy, mean (SD), servings per week | 2.8 (2.1) | 2.7 (2.4) | 2.5 (2.1) | 11 (0.1) |
| Physical activity, mean (SD), hours per day | 2.5 (1.0) | 2.6 (1.0) | 2.4 (1.0) | 311 (2.8) |
| Sedentary time, mean (SD), hours per day | 2.1 (0.8) | 2.1 (0.8) | 2.2 (0.9) | 296 (2.7) |
BMI, body mass index; SD, standard deviation.
Normal weight: BMI < 85th percentile; overweight: 85th ≤ BMI < 95th percentile; obese: BMI ≥ 95th percentile.
In the sibling-matched analysis, shared confounders were adjusted for by design, and non-shared confounders that differ within sibling-pairs were adjusted for in the regression model. Thus, the non-shared confounders were birth date (for adjustment of calendar time) and the same potential confounders as in the cohort analysis, except maternal age at menarche and highest educational class of parents, which were both shared by the sibling-pairs.
Statistical analysis
In the cohort analysis, we estimated the adjusted mean age difference in attaining each of the pubertal milestones for childhood overweight and obesity with normal weight as reference. As the puberty information was provided half-yearly, the pubertal milestones were right-, left- or interval-censored. Thus, we used a censored regression model based on the normal distribution fitted by maximum likelihood estimation45 using the -intreg- procedure in STATA 15.1 MP software (Statacorp., College Station, TX). The model assumption of normally distributed residuals was inspected by plotting the non-parametric cumulative incidence function based on the Turnbull Estimator against the normal distribution in R (x64 3.3.1).46,47 The assumption of constant variance across covariates was inspected by stratifying these plots on levels of covariates. Data were compatible with these assumptions (data not shown). To look for dose-dependent patterns, we also included childhood BMI as restricted cubic splines with three knots at 14, 16 and 18 kg/m2. As all associations were reasonably compatible with linearity, we modelled age at attaining the pubertal milestones as a linear function of childhood BMI per 5 kg/m2. Then, we explored the joint association of childhood weight and a high waist:height ratio >0.5 (a marker of central distribution of fat) on pubertal timing in an interaction analysis; a high waist:height ratio has been related to hyperinsulinism and insulin insensitivity in children,48 which is related to earlier pubertal timing.15,17 To reduce the risk of type 1 error due to multiple testing, we also employed Huber-White robust variance estimation to obtain a single estimate for the overall adjusted mean age difference in attaining all pubertal milestones according to childhood BMI (in categories and continuous) as well as in the interaction analysis.49,50 Sampling weights were used in the analysis and were computed as the inverse probability of being sampled according to the sampling regime for the Puberty Cohort as described previously.38 Furthermore, selection weights were used and obtained by multivariable logistic regression as the inverse probability of participation in the cohort analysis given the confounders and childhood BMI.51 The selection weights were then multiplied by the sampling weights and used in the cohort analysis. Robust standard errors were employed to account for the use of weights and the clustering of siblings.
In the sibling-matched analysis, we used a between-within model to obtain the within sibling-pair association as the mean age difference in age at attaining each of the pubertal milestones per 5 kg/m2 higher childhood BMI (continuous).52 To remove confounding by shared factors, we included both childhood BMI (continuous) and the mean childhood BMI for each sibling-pair (continuous).36,52 To remove confounding by non-shared confounders, we adjusted for the child’s own non-shared confounders as well as the non-shared confounder of the other sibling.36 We used a mixed effect model to model each sibling-pair as a random intercept using STATA’s -meintreg- procedure.52
We conducted three sensitivity analyses. First, we repeated the cohort analysis of childhood BMI (categorical) among the 35 528 children from which we identified the siblings (Figure 1) to evaluate whether the results were comparable to those obtained from the cohort analysis. Second and third, we restricted the sibling-matched analysis to siblings with the same father (98%) and then to siblings born ≤3.0 years apart (83%) as they might share more confounders than siblings born further apart.
Ethics
The Committee for Biomedical Research Ethics in Denmark approved the collection of data in the DNBC ((KF)01–471/94). Written informed consent was obtained from mothers upon recruitment, covering both mothers’ participation and children’s participation in the DNBC until they turn 18 years of age. The present study was approved by the Danish Data Protection Agency (2012–41-0379 and 2015–57-0002) and the Steering Committee of the DNBC (2012–04, 2015–47 and 2018–27).
Results
In the cohort analysis, mothers of obese children were more likely to be lower educated, to be smokers, to have higher pre-pregnancy BMI, to have earlier age at menarche and to have higher parity than mothers of normal-weight children (Table 1; Supplementary Tables 1 and 2, available as Supplementary data at IJE online). The obese children were heavier at birth than normal-weight children, whereas dietary patterns, physical activity and sedentary behaviour only varied slightly between childhood weight groups (Table 1). In the sibling-matched analysis, the patterns were similar for the 1700 brothers and sisters (Supplementary Table 3, available as Supplementary data at IJE online). The median age difference for the siblings was 2.3 (range: 1.0–5.0) years. The younger sibling’s BMI at 7 years was comparable to the older sibling’s BMI: mean difference 0.0 (standard deviation: 1.9) kg/m2.
Compared with children who did not participate in the cohort analysis, children who participated (n = 11 046, 49%) were more likely to have normal weight and non-smoking mothers with higher education, to be of normal weight themselves and to eat vegetables, whereas other dietary factors, physical activity and sedentary behaviour were similar (data not shown).
Cohort analysis
Both childhood overweight and obesity were associated with earlier age at attaining nearly all the pubertal milestones in boys and all pubertal milestones in girls (Table 2). The associations were similar across pubertal milestones in boys, but they were larger for Tanner Breast stages in girls. When combining the estimates for all milestones using robust variance estimation, the pubertal milestones were attained earlier in overweight (boys: -3.1 months; girls: -5.5 months) and obese (boys: -3.5 months; girls: -5.2 months) children, with normal weight as the reference (Table 2). When including childhood BMI as a restricted cubic spline, the associations were reasonably linear (Figure 2; Supplementary Figure 2, available as Supplementary data at IJE online). When modelling childhood BMI as a linear term, all pubertal milestones were attained earlier with higher childhood BMI in both sexes (Table 2). When combining the estimates, the pubertal milestones were attained 5.1 months earlier in boys and 7.8 months earlier in girls per 5 kg/m2 higher childhood BMI (Table 2). In the interaction analysis, a central fat distribution did not further strengthen the associations between weight groups and pubertal timing (Supplementary Table 4, available as Supplementary data at IJE online).
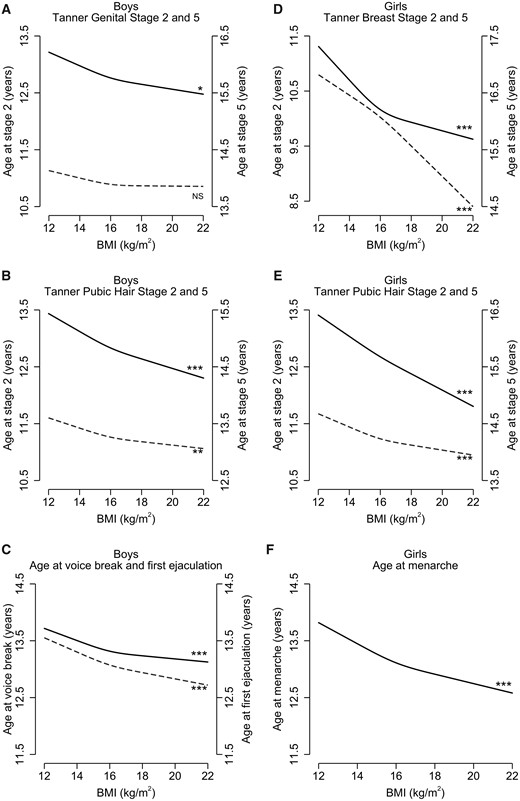
Adjusted mean age at attaining the pubertal milestones as spline functions of childhood BMI (body mass index). Tanner stage 2 (dashed line), Tanner stage 5 (solid line), voice break (dashed line), first ejaculation (solid line) and menarche (solid line). Estimates presented for a reference child who was the first-born child with a birthweight of 3500 g, who had average diet, physical activity and sedentary behaviour in childhood, and whose mother was a high-grade professional, had pre-pregnant normal weight, did not smoke during first trimester and had menarche at same time as her peers. NSP-value >0.05; *P-value <0.01; **P-value <0.001; ***P-value <0.0001.
Cohort analysis: monthly difference in timing of puberty across childhood weight groups and per 5 kg/m2 BMI
| Normal weight (ref)a | Overweighta | Obesea | Childhood BMI (continuous in 5 kg/m2) | |||||
|---|---|---|---|---|---|---|---|---|
| Pubertal milestones | No.b | Mean agec | Crude | Adj. (95% CI)d | Crude | Adj. (95% CI)d | Crude | Ajd. (95% CI)d |
| Boys | ||||||||
| Tanner Genital stage 2 | 5121 | 10.9 | −2.7 | −2.4 (−4.4, −0.4) | −0.7 | 0.0 (−2.2, 2.2) | −2.5 | −1.8 (−3.6, 0.0) |
| Tanner Genital stage 3 | 5121 | 12.5 | −3.9 | −3.5 (−5.5, −1.5) | −3.5 | −2.5 (−4.8, −0.3) | −5.1 | −4.4 (−6.2, −2.6) |
| Tanner Genital stage 4 | 5121 | 13.8 | −3.2 | −2.8 (−4.9, −0.7) | −4.9 | −3.9 (−6.3, −1.6) | −5.5 | −4.8 (−6.6, −3.0.) |
| Tanner Genital stage 5 | 5121 | 15.8 | −2.7 | −2.2 (−5.3, 0.8) | −5.4 | −4.3 (−7.8, −0.7) | −5.5 | −4.5 (−7.3, −1.8) |
| Tanner Pubic Hair stage 2 | 5121 | 11.3 | −3.0 | −2.8 (−4.7, −0.8) | −2.0 | −1.2 (−3.3, 0.9) | −3.9 | −3.4 (−5.1, −1.7) |
| Tanner Pubic Hair stage 3 | 5121 | 12.8 | −4.7 | −4.3 (−6.1, −2.5) | −4.4 | −3.3 (−5.3, −1.4) | −6.9 | −6.3 (−7.9, −4.8) |
| Tanner Pubic Hair stage 4 | 5121 | 13.6 | −3.1 | −2.9 (−4.6, −1.1) | −4.3 | −3.4 (−5.3, −1.5) | −5.3 | −4.8 (−6.3, −3.3) |
| Tanner Pubic Hair stage 5 | 5121 | 14.8 | −3.7 | −3.4 (−5.4, −1.3) | −6.3 | −5.2 (−7.5, −2.8) | −7.6 | −6.9 (−8.7, −5.1) |
| Axillary hair | 5123 | 13.4 | −6.9 | −6.5 (−8.7, −4.3) | −8.4 | −7.4 (−9.7, −5.1) | −10.2 | −9.7 (−11.7, −7.7) |
| Acne | 5123 | 12.3 | −2.5 | −2.2 (−4.2, −0.1) | −5.0 | −4.4 (−6.8, −2.0) | −5.4 | −5.1 (−6.9, −3.2) |
| Voice break | 5028 | 13.1 | −3.1 | −2.6 (−4.6, −0.5) | −5.3 | −4.2 (−6.4, −2.0) | −6.1 | −5.1 (−6.9, −3.3) |
| First ejaculation | 5118 | 13.4 | −1.6 | −1.6 (−3.7, 0.6) | −3.3 | −2.8 (−4.7, −1.0) | −4.0 | −3.7 (−5.4, −2.0) |
| All milestones combinede | 5028 | – | −3.5 | −3.1 (−4.5, −1.7) | −4.5 | −3.5 (−5.1, −2.0) | −5.7 | −5.1 (−6.3, −3.8) |
| Girls | ||||||||
| Tanner Breast stage 2 | 5171 | 10.0 | −11.3 | −9.5 (−13.9, −5.1) | −17.6 | −15.2 (−21.7, −8.6) | −14.7 | −13.1 (−15.7, −10.5) |
| Tanner Breast stage 3 | 5171 | 11.7 | −9.5 | −8.3 (−10.5, −6.2) | −9.5 | −7.7 (−10.5, −4.9) | −11.3 | −10.3 (−11.9, −8.6) |
| Tanner Breast stage 4 | 5171 | 13.1 | −7.8 | −6.5 (−8.5, −4.5) | −6.6 | −4.8 (−7.3, −2.4) | −9.7 | −8.4 (−10.1, −6.8) |
| Tanner Breast stage 5 | 5171 | 16.1 | −10.2 | −8.5 (−12.1, −4.8) | −9.4 | −6.5 (−11.2, −1.9) | −12.7 | −10.5 (−13.5, −7.6) |
| Tanner Pubic Hair stage 2 | 5171 | 11.3 | −3.5 | −3.0 (−5.0, −1.1) | −3.2 | −2.5 (−4.6, −0.5) | −4.9 | −4.8 (−6.1, −3.5) |
| Tanner Pubic Hair stage 3 | 5171 | 12.5 | −4.0 | −3.4 (−5.3, −1.6) | −3.3 | −2.4 (−4.3, −0.5) | −5.4 | −5.1 (−6.4, −3.9) |
| Tanner Pubic Hair stage 4 | 5171 | 13.5 | −4.6 | −4.3 (−6.4, −2.2) | −5.7 | −5.1 (−7.7, −2.6) | −7.0 | −7.0 (−8.6, −5.4) |
| Tanner Pubic Hair stage 5 | 5171 | 15.7 | −7.1 | −6.3 (−9.5, −3.1) | −10.1 | −8.8 (−12.6, −5.0) | −10.2 | −9.8 (−12.3, −7.3) |
| Axillary hair | 5174 | 12.0 | −5.7 | −5.2 (−7.5, −2.9) | −5.5 | −4.4 (−7.4, −1.5) | −8.1 | −7.9 (−9.8, −6.1) |
| Acne | 5174 | 11.4 | −4.1 | −3.6 (−6.1, −1.0) | −2.6 | −1.7 (−5.2, 1.8) | −3.8 | −3.5 (−5.5, −1.5) |
| Menarche | 5170 | 13.1 | −5.3 | −4.2 (−5.8, −2.6) | −7.5 | −5.7 (−7.6, −3.9) | −8.8 | −7.8 (−9.0, −6.6) |
| All milestones combinede | 5170 | – | −6.3 | −5.5 (−7.1, −3.9) | −6.5 | −5.2 (−7.1, −3.4) | −8.4 | −7.8 (−9.0, −6.6) |
Adj., adjusted; BMI, body mass index; CI, confidence interval; ref, reference.
Normal weight: BMI < 85th percentile; overweight: 85th ≤ BMI < 95th percentile; obese: BMI ≥ 95th percentile.
As some boys and girls gave information on some but not all pubertal milestones, different numbers of observations were used for each outcome.
Crude mean age in years at attaining pubertal milestones for boys and girls with normal weight.
Adjusted for highest educational class of parents, maternal smoking in first trimester, maternal pre-pregnancy BMI, maternal age at menarche, parity, birthweight, childhood diet, childhood physical activity and childhood sedentary behaviour.
Estimated using Huber-White robust variance estimation.
Sibling-matched analysis
In the sibling-matched analysis, point estimates ranged -9.7 to 0.8 months in boys and -18.0 to -3.1 months per 5 kg/m2 higher childhood BMI (Table 3). Higher childhood BMI was consistently associated with earlier age at attaining the pubertal milestones in girls, but the confidence intervals were wide and crossed the null for most estimates in boys (Table 3).
Sibling-matched analysis: monthly difference in timing of puberty per 5 kg/m2 higher BMI
| Model 1: Shared confoundersa | Model 2: Shared and non-shared confoundersb | ||
|---|---|---|---|
| Pubertal milestones | No. | Adjusted (95% CI) | Adjusted (95% CI) |
| Boys | |||
| Tanner Genital stage 2 | 796 | −5.2 (−12.4, 2.0) | −5.9 (−13.3, 1.5) |
| Tanner Genital stage 3 | 796 | −6.3 (−13.1, 0.6) | −4.3 (−11.3, 2.8) |
| Tanner Genital stage 4 | 796 | 0.3 (−8.2, 8.7) | 0.8 (−7.6, 9.2) |
| Tanner Genital stage 5 | 796 | −4.1 (−17.6, 9.4) | −5.5 (−19.8, 8.7) |
| Tanner Pubic Hair stage 2 | 796 | −8.9 (−15.5, −2.4) | −9.3 (−15.9, −2.6) |
| Tanner Pubic Hair stage 3 | 796 | −6.7 (−12.8, −0.6) | −4.1 (−10.5, 2.2) |
| Tanner Pubic Hair stage 4 | 796 | −1.3 (−8.2, 5.7) | −0.1 (−7.4, 7.3) |
| Tanner Pubic Hair stage 5 | 796 | −3.1 (−14.4, 8.2) | −3.3 (−14.8, 8.2) |
| Axillary hair | 796 | −9.9 (−18.8, −0.9) | −7.4 (−16.7, 1.9) |
| Acne | 796 | −8.9 (−15.4, −2.4) | −9.7 (−16.2, −3.3) |
| Voice break | 612 | −5.5 (−15.2, 4.2) | −7.9 (−17.5, 1.8) |
| First ejaculation | 796 | −2.3 (−10.4, 5.8) | −2.3 (−10.4, 5.7) |
| Girls | |||
| Tanner Breast stage 2 | 712 | −16.4 (−26.2, −6.6) | −14.1 (−24, −4.2) |
| Tanner Breast stage 3 | 712 | −12.2 (−18.0, −6.4) | −13.6 (−19.6, −7.6) |
| Tanner Breast stage 4 | 712 | −14.6 (−22.2, −7.0) | −12.5 (−20.1, −4.8) |
| Tanner Breast stage 5 | 712 | −20.0 (−35.2, −4.8) | −18.0 (−33.6, −2.4) |
| Tanner Pubic Hair stage 2 | 712 | −7.5 (−12.7, −2.3) | −7.3 (−12.7, −1.9) |
| Tanner Pubic Hair stage 3 | 712 | −7.1 (−13.0, −1.3) | −5.1 (−11.2, 0.9) |
| Tanner Pubic Hair stage 4 | 712 | −13.8 (−21.5, −6.1) | −10.6 (−18.6, −2.5) |
| Tanner Pubic Hair stage 5 | 712 | −13.4 (−25.1, −1.7) | −4.7 (−16.6, 7.2) |
| Axillary hair | 712 | −8.2 (−14.6, −1.7) | −8.6 (−15.1, −2.1) |
| Acne | 712 | −2.0 (−9.8, 5.8) | −3.1 (−11.2, 5.0) |
| Menarche | 712 | −11.4 (−17.2, −5.7) | −9.8 (−15.7, −4.0) |
BMI, body mass index; CI, confidence interval.
Model 1 is adjusted for shared confounders by sibling-matched design.
Model 2 is adjusted for shared confounders by sibling-matched design and adjusted for non-shared confounders (in regression model): birth date, maternal smoking in first trimester, maternal pre-pregnancy BMI, parity, birthweight, childhood diet, childhood physical activity and childhood sedentary behaviour.
Sensitivity analyses
When repeating the cohort analysis among the 35 528 children among whom the siblings were identified, the results were similar to the results obtained from the Puberty Cohort (Supplementary Table 5, available as Supplementary data at IJE online). When restricting to either sibling-pairs with same father or siblings born ≤3.0 years apart, the results remained essentially the same (Supplementary Table 6, available as Supplementary data at IJE online).
Discussion
In the cohort analysis, childhood overweight and obesity were associated with earlier pubertal timing in both boys and girls in a dose-dependent manner. The same associations for girls were found in the sibling-matched analysis for almost all pubertal milestones, indicating that confounding from shared factors, such as socioeconomic and genetic factors, cannot explain the associations observed in the cohort analysis. For the boys, a tendency toward earlier pubertal timing related to childhood obesity was observed in the sibling-matched analysis, but the confidence intervals were wide. A central fat distribution did not strengthen the association between childhood weight groups and pubertal timing.
Strengths and limitations
The main strengths of this study include the large study size, the ascertainment of childhood BMI before onset of puberty, the multiple pubertal milestones for each participant and the detailed information on potential confounders. Further, the main strength of the sibling-matched analysis was that it, by design, controls for all time-stable confounders that were shared within the siblings’ family. These factors may include place of residence, socioeconomic status and genetic factors, which may be difficult to adjust for in a usual cohort study. Several genetic variants have pleiotropic effects on both obesity and earlier timing of puberty, and these variants may confound the associations in our cohort analysis.34 The sibling-matched design partly corrects for this confounding, as siblings share on average half of their genes.
A number of limitations merit attention. Childhood BMI was reported by mothers and is only a proxy for body fat.53 Moreover, self-reported BMI is not a perfect measure compared with BMI measured by health care professionals. These sources of measurement error are most likely non-differential with regard to the children’s pubertal timing that usually occurs a few years later. In a recent validation study within the Puberty Cohort, we found moderate agreement between self-reported Tanner stages when compared with Tanner staging assessed by clinicians.54 This may be problematic for breast assessment in obese girls, who may mistake adipose tissue for breast tissue.55 This might explain the stronger associations for breast stages, but it is probably less problematic for other pubertal milestones, where this measurement error most likely causes bias towards the null.56 In the cohort analysis, a relatively high proportion of children had already attained the earliest pubertal milestones, leaving their puberty information left-censored; in the sibling-matched analysis, a relatively high proportion of children had not attained the later pubertal milestones, as some only provided puberty information at 11 years, leaving their puberty information right-censored (Supplementary Tables 7 and 8, available as Supplementary data at IJE online). This may bias the estimates if the assumption of normally distributed residuals is violated. However, our data were compatible with the normal distribution.
Childhood BMI and most confounders differed between children who participated and those who did not participate in the Puberty Cohort, but these differences were addressed by use of selection weights.51 Still, we cannot exclude selection bias if pubertal timing is also associated with participation in the cohort analysis. Finally, as height and weight were only measured when the child was aged 7 years, we were unable to determine the age at the adiposity rebound, which is the onset of the second rise in the BMI curve usually around 5 to 7 years.57 The age at the adiposity rebound is influenced by pre- and postnatal nutrition.57 An early adiposity rebound is associated with a low BMI before the rebound, but with high BMI after the rebound, and is a strong predictor of childhood and adult obesity,57 insulin resistance58 and possibly also cardiovascular diseases.59 This is similar to the trajectory of health and disease observed for boys and girls with early puberty.8 However, given the data, we were unable to disentangle the influence of the age at the adiposity rebound on the association between childhood obesity and timing of puberty.
There were also limitations specific to the sibling-matched design. Even though we adjusted for several non-shared potential confounders, we cannot rule out that there were other important non-shared confounders. Unadjusted non-shared confounders may cause even stronger confounding in a sibling-matched analysis than in a usual cohort analysis.60 Moreover, the non-differential measurement error on the exposure, childhood BMI, may lead to weaker estimates in the sibling-matched analysis than the cohort analysis.60
Interpretation
In boys, overweight and obesity have been reported to have higher,22–24 lower24,25 or comparable29 Tanner stages in cross-sectional studies. Most longitudinal studies have linked higher childhood BMI in boys with earlier age at onset of the growth spurt and peak height velocity,30–33 whereas results for Tanner stages and testicular volume have been conflicting.26–28 A higher childhood BMI has also been linked to earlier age at voice break in Danish choir boys.5 These findings have led most reviews to conclude that an association is not well established in boys.14,15,19–21,61 We believe this study moderates this conclusion. We found that higher childhood BMI was consistently associated with younger age at attaining all the pubertal milestones in boys in a dose-dependent manner even after thorough confounder adjustment. The sibling-matched analysis in boys showed a tendency toward earlier puberty given higher childhood BMI, although the estimates had wide confidence intervals.
In girls, we found that higher childhood BMI was associated with earlier age at attaining all pubertal milestones, in a dose-dependent manner. This is in line with conclusions from most reviews.14,15,18–21 Although most studies have been cross-sectional with risk of reverse causation,14,15,19–21 a recent review of longitudinal studies has now addressed the temporality of exposure and outcome.18 This review reported that higher body weight and weight gain in childhood were consistently associated with earlier age at menarche.18 However, confounding may induce spurious associations in observational studies. One remedy is the Mendelian randomization study design that exploits the random allocation of genes at conception to estimate causal effects by using ‘randomized’ genetic variants as instruments for the exposure of interest.29 Findings from Mendelian randomization studies support a causal relation between childhood obesity and early menarche in girls.62,63 The sibling-matched design is another option for confounding control. A sibling-matched study has indicated earlier age at menarche after rapid childhood weight gain.64 However, important non-shared confounders, such as physical activity and diet, were not adjusted for.64 In our sibling-matched analysis, we adjusted for such non-shared confounders, and we found an earlier age at virtually all the pubertal milestones given higher childhood BMI. This supports a plausible causal relationship between childhood BMI and pubertal timing in girls.
Conclusion
We found that higher childhood BMI was associated with earlier pubertal timing in boys and girls in both a cohort analysis and a sibling-matched analysis. Our findings add to the growing evidence that supports a causal interpretation of the association of childhood overweight and obesity with earlier pubertal timing.
Supplementary Data
Supplementary data are available at IJE online.
Funding
This work was supported by the Danish Council for Independent Research (DFF 4183–00152) and the Faculty of Health at Aarhus University to NB.
Acknowledgements
The Danish National Birth Cohort was established with a significant grant from the Danish National Research Foundation. Additional support was obtained from: the Danish Regional Committees; the Pharmacy Foundation; the Egmont Foundation; the March of Dimes Birth Defects Foundation; the Health Foundation; and other minor grants. The DNBC Biobank has been supported by the Novo Nordisk Foundation and the Lundbeck Foundation. Follow-up of mothers and children has been supported by: the Danish Medical Research Council [SSVF 0646, 271–08-0839/06–066023, O602-01042B, 0602-02738B]; the Lundbeck Foundation [195/04, R100-A9193];tThe Innovation Fund Denmark [0603-00294B (09–067124)]; the Nordea Foundation [02–2013-2014]; Aarhus Ideas [AU R9-A959-13-S804]; University of Copenhagen Strategic Grant [IFSV 2012]; and the Danish Council for Independent Research [DFF 4183–00594 and DFF 4183–00152].
Conflict of Interest
None declared.
References
The Danish National Birth Cohort. Code book in English for the DNBC Puberty Follow-Up.

