


Why was the cohort study set up?
Although a large sample size is useful for the elucidation of what is called ‘missing heritability’, which is an unexplained part of a total phenotypic variance in a quantitative trait or familial disease aggregation, in prospective genome cohort studies, additional strategies may be required.1 Historically, many patient-based cohort studies have been conducted with limited environmental information for the period preceding the onset of diseases.2–6 Population-based prospective cohort designs have since been improved, and many risk factors for diseases have been identified.7–10 Once the importance of in utero exposures was recognized, birth cohorts were also developed,11–18 and were used to examine the lifelong effects of in utero exposures.19 Because a study assessing disease risk throughout a person’s lifespan requires exposure and outcome measurements in multiple generations with long-term follow-up, a three-generation prospective cohort design has emerged.20,21 In accordance with the development of genome cohort designs, birth and three-generation cohort studies combined with genome and omics information appear to be necessary. However, because of the difficulty of this study design and the actual operation of recruiting and following-up pregnant women, babies, husbands (or partners) and grandparents of babies, no group in the world has ever tried this type of cohort study from an initial stage of cohort construction (Figure 1).
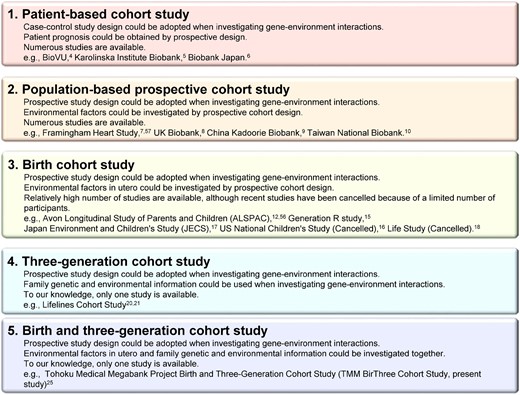
Types of prospective cohort studies. The types of prospective cohort studies and their features are presented in this figure. The number of each cohort approximates the historical sequence.
Cohort studies contribute to the monitoring of individuals’ health status and the implementation of suitably timed interventions, even after a large natural disaster. The Great East Japan Earthquake (GEJE) and subsequent tsunami, on 11 March 2011, devastated a wide area of the northeastern coast of Japan. This event was one of the greatest natural disasters in modern history; 15 896 persons lost their lives, and 2537 remain missing.22 Because middle- and long-term impacts of the natural disaster on the health of affected people were of concern,23,24 the Tohoku Medical Megabank Project (TMM) was established on 1 February 2012, by Tohoku University Tohoku Medical Megabank Organization (ToMMo) and Iwate Medical University Iwate Tohoku Medical Megabank Organization (IMM).25 The TMM aims to facilitate solutions to medical problems in the aftermath of the GEJE by providing maximal efforts to recover the damaged health care services through the establishment of a system to dispatch physicians to the damaged areas on a rotational basis, monitoring and intervening in the health status of the persons within and around the affected areas, and introducing personalized health care and medicine not only to the damaged areas but also to the world.
ToMMo and IMM have conducted the TMM Birth and Three-Generation Cohort Study (TMM BirThree Cohort Study) since July 2013. In this study, we collected in utero and subsequent exposure and outcome information, including disaster-related information, of newborns and other family members. To resolve ‘missing heritability’ issues,26 the TMM BirThree Cohort Study involves plans to use this information and rich family relationship information. The present paper reports the rationale, progress and perspectives of the TMM BirThree Cohort Study.
Who is in the cohort?
We recruited pregnant women and their fetuses as probands. Then, we recruited the women’s partners (the fathers of the fetuses), their parents (the grandparents of the fetuses), their children (the siblings of the fetuses, if any) and their extended family members (Figure 2). A genetic relationship was not necessary for participation.
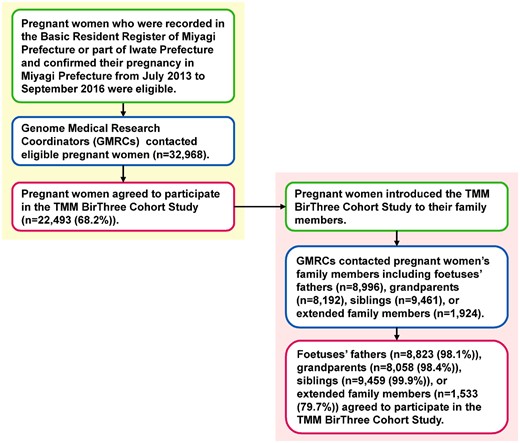
Flow chart of the Tohoku Medical Megabank Project Birth and Three-Generation Cohort Study (TMM BirThree Cohort Study) participants. The flow chart shows the inclusion criteria, inclusion route and response rate to invitations to potential participants.
From 2013 to 2017, pregnant women and their family members were contacted in obstetric clinics or hospitals when they scheduled their deliveries. Approximately 50 obstetric clinics and hospitals in Miyagi Prefecture participated in the recruiting process. ToMMo established seven ‘community support centres’ in Miyagi Prefecture and IMM established five ‘satellites’ in Iwate Prefecture as local facilities for voluntary admission-type recruitment and health assessment of the participants.25 Some pregnant women participated in the cohort at the community support centres or satellites. Trained genome medical research coordinators (GMRCs) were placed in each clinic, hospital or community support centre to provide information on the TMM BirThree Cohort Study to potential participants, and to receive a signed informed consent form from each participant. The GMRC licence has been certified by the Japan Society of Human Genetics, and also ToMMo or IMM.
A sample size of approximately 70 000 participants was calculated based on the requirements for a multipurpose research platform that included genetic analysis,25 the number of births in Miyagi Prefecture, where the study is being conducted, the estimated number of incident disease cases, feasibility and costs. In the TMM BirThree Cohort Study, 74 116 persons participated as the ‘fetus’ origin cohort, and 73 529 persons participated as the ‘newborn’ origin cohort (Figure 3). We excluded persons who offered complete withdrawal of their consent before identification of birth, when calculating the above number for the newborn cohort participation. If a person had two or more family roles, the assignment order of priority was pregnant woman/mother, newborn, father, grandparent, sibling, great-grandparent and extended family. The mean and range of ages of the participants at enrolment are shown in Table 1. The participation rate was lower in males than in females, as observed in several Japanese cohort studies, such as the Saga Japan Multi-Institutional Collaborative Cohort (J-MICC) Study, a sub-cohort of the J-MICC Study.27
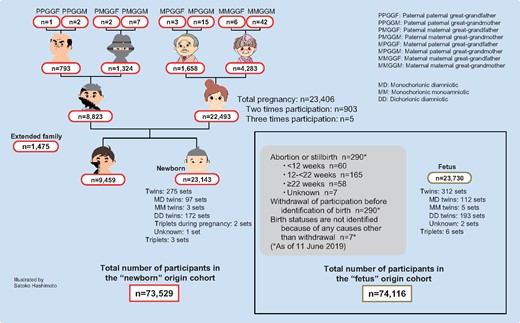
Number of participants according to family role. Both the total number of participants in the ‘fetus’ origin cohort and that in the ‘newborn’ origin cohort are presented.
Mean and range of age at enrolment
| na | Mean age in years (SDb) | Range of age in years | |
|---|---|---|---|
| Father | 8763 | 33.3 (5.9) | 18–74 |
| Mother | 22 230 | 31.2 (5.0) | 14–47 |
| Sibling of newborn | 9393 | 4.0 (2.9) | 0–44 |
| Maternal grandfather | 1657 | 63.0 (6.0) | 28–81 |
| Maternal grandmother | 4276 | 58.8 (6.2) | 32–82 |
| Paternal grandfather | 793 | 64.1 (5.9) | 43–85 |
| Paternal grandmother | 1320 | 61.0 (5.9) | 38–81 |
| Great-grandparents | 78 | 75.4 (6.7) | 60–88 |
| Extended family members | 1474 | 29.0 (16.4) | 0–83 |
Total number of participants is not equal to that of Figure 3 because of complete withdrawal of consents before making this table. If a person had two or more family roles, the assignment order of priority was pregnant women/mother, newborn, father, grandparent, sibling, great-grandparent and extended family.
SD, standard deviation.
The 23 143 newborns included 275 sets of twins and three sets of triplets. As we anticipated, more maternal grandparents than paternal grandparents participated in the cohort. When the mothers of newborns became pregnant again during the recruitment period, we recruited their second or third fetuses for the study. Of 22 493 mothers, a total of 23 406 pregnancies were recruited (two times participation; n = 903, three times participation; n = 5). Figure 4 presents the number of family sets, which constituted more than 13 000 trios across the three generations.
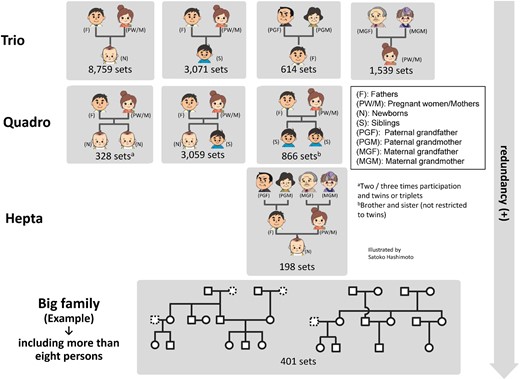
Number of trio, quadro, hepta and big family sets. Each number shows the number of trio, quadro, hepta, and big family sets.
The cumulative numbers of participants, including pregnant women, newborns and family members (fathers, siblings, grandparents, great-grandparents and extended family members) are presented in Figure 5. Although pregnant women and newborns were linearly recruited, the number of family members increased quadratically.
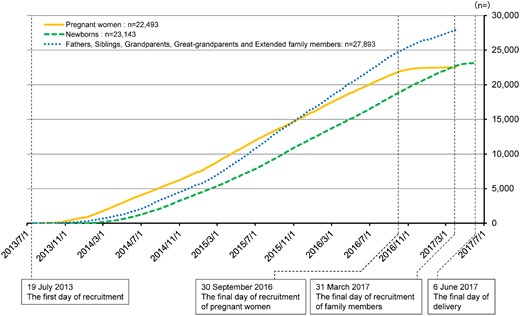
Cumulative number of participating pregnant women, newborns, and family members (fathers, siblings, grandparents, great-grandparents and extended family members) in the newborn origin cohort. Pregnant women and newborns were linearly recruited, but the recruitment of family members increased quadratically.
The TMM BirThree Cohort Study protocol was reviewed and approved by the Ethics Committee of ToMMo (2013-1-103-1). Additionally, the study’s progress has been periodically monitored and reviewed by the committee specifically set up in the TMM. We have conducted the study in accordance with the Declaration of Helsinki,28 the Ethical Guidelines for Human Genome/Gene Analysis Research29 and all other applicable guidelines. We have adopted broad and continuing consent procedures for participation.25 For participants 10 to 15 years of age, we obtained informed assent from the individuals and informed consent from their guardians. For participants 16 to 19 years of age, we obtained informed consent from both the individuals and their guardians. For participants with insufficient ability to understand the study protocol at any age, with the Ethics Committee’s approval, we obtained informed consent from their guardians.
How often have they been followed up?
The TMM BirThree cohort participants’ follow-up plan is shown in Table 2. For child participants, both newborns and their siblings, questionnaires are mailed to their parents when the children are 6, 12, 24, 36, 42, 48 and 60 months old. After the participants reach 5 years of age, we send questionnaires once a year. We use web-based questionnaires when applicable. We review infants’ health examination records conducted by municipalities. We also review school health examination records. We obtain data of Vital Statistics, which are conducted by the Ministry of Health, Labour and Welfare in Japan.30 We analyse individual data independently of the Ministry, so summarized data of our studies using vital statistics might not always be consistent with published data from the Ministry. We transcribe medical records from clinics and hospitals, and conduct data linkage with the disease registration system of the Miyagi Prefectural Cancer Registry.31 We will further conduct data linkage with the Miyagi Medical and Welfare Information Network (MMWIN),32 the electronic health record that is constructed by Miyagi Prefecture, for information on diseases.
The TMM BirThree cohort participants' follow-up plan
| Children |
| From fetus to 1 month old |
| Review of obstetrical medical records |
| From 1 month old to 3 or 3.5 years old |
| Review of infants' health examination records conducted by municipalities |
| Abstracting data from maternal and child health handbooka |
| From 4 years old or older |
| Health assessment at ‘community support centre’b |
| Review of school health examination records |
| Abstracting data from maternal and child health handbooka |
| Any age of less than 20 years old |
| Self-reported questionnaire by guardians |
| Review of medical records, when detecting disease indicators |
| Abstracting data from Miyagi Medical and Welfare Information Network (MMWIN)c |
| Record linkage |
| • Change of address |
| • Death date and causes |
| • Cancer registry |
| • Japanese system for intractable diseases and specific chronic diseases in childhood (under consideration) |
| Adults |
| Any age of 20 years old or older |
| Self-reported questionnaire |
| Health assessment at ‘community support centre’b |
| Review of medical records, when detecting disease indicators |
| Abstracting data from Miyagi Medical and Welfare Information Network (MMWIN)c |
| Record linkage |
| • Change of address |
| • Death date and causes |
| • Cancer registry |
| • Receipt of National Health Insurance (if applicable) |
| • Long-Term Care Insurance data (if applicable) |
Maternal and child health handbook has been distributed to all mothers by the municipalities in Japan since 1947. It consists of information on pregnancy, delivery, child development, immunization and child growth charts.33
We established seven ‘community support centres’ in Miyagi Prefecture as local facilities for health assessment of participants.25
Miyagi Medical and Welfare Information Network (MMWIN) is the information and communication technology system under construction by Miyagi Prefecture for information on the diseases incidence and clinical information.32
We have asked the children’s guardians to take the children to community support centres for health assessments when the children are 4, approximately 10 and approximately 16 years old. We ask the guardians to bring the children’s maternal and child health handbooks,33 which have been distributed to all mothers by the municipalities all over Japan when the women become pregnant, and transcribe all information in the handbooks, such as the health status and lifestyle of the mothers during pregnancy, birth information, children’s development and immunization.
For adult participants, we apply methods similar to those used for the children to obtain detailed health information, including from questionnaires, web-based questionnaires, medical records, their own maternal and child health handbooks when possible, disease registration system, the MMWIN and health check-ups at community support centres. The measurements of health check-ups are standardized with those of the TMM Community Cohort Study (TMM CommCohort Study).25
What has been measured?
The questionnaire items are similar to those of other ongoing cohort studies in Japan.17,34,35 At the time of enrolment, we asked the pregnant women to respond to a wide range of questions about their lifestyle habits, medical history before and during pregnancy, sociodemographic factors, the Kessler Psychological Distress Scale (K6)36 and the Athens Insomnia Scale (AIS).37 The questions on lifestyle habits included a 130-item food frequency questionnaire (FFQ) based on the Japan Public Health Centre-based prospective study’s FFQ.34 The response option ‘constitutionally unable to eat or drink it’ for individual food and drink items is unique to our FFQ. We also collected blood and urine samples. In mid-pregnancy, a second questionnaire was administered, which included questions about the Autism Spectrum Quotient (AQ),38,39 short-form Eysenck Personality Questionnaire-Revised (EPQR-S)40,41 and living environment. Additionally, the second round of blood and urine samples was collected at this time.
Content of the baseline questionnaires for pregnant women/mother
| Item | Descriptions (examples) | Timing | ||
|---|---|---|---|---|
| Enrolment | Mid pregnancy | 1 month after deliverya | ||
| Family information | Family composition, age of children | x | ||
| Reproductive and medical history | Height and weight, estimated date of delivery, morning sickness, fertility treatment, history of female-specific and perinatal period, history of diseases | x | ||
| Smoking and alcohol consumption | Smoking history of parents of fetus, passive smoking (current and past), alcohol consumption (frequency and volume) | x | x | |
| Physical activity | Frequency and the total time spent engaging in three levels of physical activity | x | x | |
| Sleep | Sleeping hours, Athens Insomnia Scale (AIS),37 use of sleeping pills | x | x | |
| Employment history | Occupation, function, duties, working environment, use of chemical substances | x | x | |
| Mental health | Kessler Psychological Distress Scale (K6)36 | x | x | |
| Autism-Spectrum Quotient (AQ)38,39 | x | |||
| Mother-to-Infant Bonding Scale (MIBS)42, Edinburgh Postnatal Depression Scale (EPDS)43,44 | x | |||
| Medication history | Medication, intake of folic acid and other supplement (name, dose) | x | x | |
| Eating habits and nutrition | A 130-items food frequency questionnaire (FFQ) | x | x | |
| Food preference (frequency of 11 food/drink items) | x | |||
| Living environment | Use of household appliances, domestic animals | x | ||
| Social connection and socioeconomic status | Communication with family members, relatives, or friends, and household income | x | ||
| Personality | Short-Form Eysenck Personality Questionnaire—Revised (EPQR-S)40,41 | x | ||
| Information of a newborn | Caregiver of a newborn, health status, disease diagnosis, medication, and sleeping hours of a newborn, breastfeeding or formula feeding | x | ||
| Living environment of a newborn | Electronic goods, floor in a newborn's bedroom, passive smoking | x | ||
Questions for a mother and a newborn are included in a questionnaire.
Notably, umbilical cord blood was collected at delivery in the clinic or hospital. One month after delivery, the third round of blood and urine samples, breast milk and the third questionnaire were collected when the mothers of the newborns visited the clinic or hospital for their scheduled health check-up. The third questionnaire included questions to obtain information on the newborns, the Mother-to-Infant Bonding Scale (MIBS)42 and the Edinburgh Postnatal Depression Scale (EPDS) (Table 3).43,44
We asked non-pregnant adult participants, including fathers, grandparents, great-grandparents, adult siblings of fetuses and others, to respond to a wide range of questions that were essentially the same questions as those posed to the pregnant women. These adults also provided blood and urine samples.
At enrolment, 95.7% of pregnant women, 88.5% of fathers, 97.9% of grandparents and 95.0% of siblings of newborns (completed by their guardians) returned questionnaires.
Detailed health assessments have been performed by the GMRCs, and other questionnaire data have been collected using tablet computers at the community support centres. The questionnaire includes questions about personal experience of the GEJE, stress and the use of public health check-ups. Oral examinations, including check-ups for dental cavities, assessment of periodontal health status, and dental plaque and saliva collection, have been performed by dentists. Two weeks of lifelog data, including home blood pressure measurements and the number of steps taken per day, have been obtained from volunteer participants. Furthermore, brain and femur magnetic resonance imaging (MRI) has been performed on a by-request basis. The assessments, collections and measurements vary depending on where the participants undergo their health assessment.25 As of 31 March 2017, approximately 38% of the adult participants had undergone physiological measurements and approximately 5% of the adult participants had undergone MRI examinations.
In the TMM, as described by Yasuda et al.,45 we are currently intensively working on generating genotype data for all participants. In terms of the BirThree Cohort Study, genotype data have been generated for 33 687 participants using single nucleotide polymorphism (SNP) arrays. Additionally, whole-genome sequencing has been completed for more than 150 ‘septets’ (families consisting of paternal and maternal grandparents, parents and a child), i.e. more than 1000 participants.
In addition to genomics, the TMM BirThree Cohort Study has evaluated other omics analyses, such as transcriptomics, proteomics and metabolomics, in prospective cohort settings.46 The ideal modern cohort for further interpretation and follow-up of the candidate loci should contain multi-omics data that contribute to the understanding of variations between individuals in molecular parameters.47
What has been found? Key findings and publications
Table 4 presents some selected baseline characteristics of the pregnant women in their first-time participation, based on the self-reported questionnaires administered during early pregnancy. The prevalence of underweight persons before pregnancy was larger than that of overweight persons. With respect to lifestyle characteristics, 2.5% of the pregnant women were current smokers and 19.6% of those were current drinkers after learning they were pregnant.
Characteristics of pregnant women in their first-time participation based on available self-reported questionnaires during early pregnancy
| Pregnant women, n | 21 493 |
| Mean age, years (SD) | 31.4 (5.0) |
| Mean height (cm) (SD)a | 158.4 (5.3) |
| Mean weight before pregnancy (kg) (SD)a | 53.2 (8.0) |
| Mean BMI before pregnancy (kg/m2) (SD)a | 21.2 (3.0) |
| BMI, n (%) | |
| BMI <18.5 kg/m2 before pregnancy, n (%) | 3030 (14.1) |
| BMI 18.5 kg/m2–<25.0 kg/m2 before pregnancy, n (%) | 15 366 (71.5) |
| BMI ≥25.0 kg/m2 before pregnancy, n (%) | 2163 (10.1) |
| Missing or out of range (≤mean -3SD or ≥mean+3SD), n (%) | 934 (4.3) |
| Smoking status, n (%) | |
| Never smoker | 12 678 (59.0) |
| Past smoker before pregnancy | 4948 (23.0) |
| Past smoker after pregnancy | 3063 (14.3) |
| Current smoker | 538 (2.5) |
| Missing | 266 (1.2) |
| Alcohol drinking, n (%) | |
| Constitutionally never drinker | 1211 (5.6) |
| Never drinker | 8483 (39.5) |
| Past drinker | 7350 (34.2) |
| Current drinker | 4203 (19.6) |
| Missing | 246 (1.1) |
Values of ≤mean-3SD or ≥mean +3SD are deleted.
Table 5 presents the characteristics of adult participants, except for pregnant women, based on the self-reported questionnaire available at enrolment. More than one-third of fathers were current smokers during the pregnancy of their wife. Table 6 presents the characteristics at birth of siblings and minor extended family members of the fetuses based on a parent-administered questionnaire obtained at enrolment. More boys than girls participated in this sub-cohort. The majority of siblings and minor extended family members were born at normal term (93.5% and 89.2%, respectively) and at a weight of ≥2500 g (91.3% and 86.9%, respectively).
Characteristics of fathers and grandparents based on available self-reported questionnaires at enrolment
| Paternal | Paternal | Maternal | Maternal | ||
| Father | grandfather | grandmother | grandfather | grandmother | |
| n | 7607 | 685 | 1069 | 1397 | 3455 |
| Mean age, years (SD) | 33.6 (5.9) | 64.1 (6.0) | 61.1 (5.9) | 62.9 (6.1) | 58.9 (6.1) |
| Mean height (cm) (SD)a | 172.1 (5.8) | 167.5 (5.9) | 155.1 (5.1) | 168.0 (5.8) | 155.6 (5.3) |
| Mean weight (kg) (SD)a | 69.6 (10.5) | 67.5 (9.0) | 55.1 (8.6) | 67.8 (9.3) | 56.0 (8.9) |
| Mean BMI (kg/m2) (SD)a | 23.5 (3.2) | 24.1 (2.9) | 22.9 (3.5) | 24.0 (2.9) | 23.1 (3.5) |
| BMI, n (%) | |||||
| BMI <18.5 kg/m2, n (%) | 255 (3.4) | 6 (0.9) | 78 (7.3) | 29 (2.1) | 197 (5.7) |
| BMI 18.5 kg/m2–<25.0 kg/m2, n (%) | 5051 (66.4) | 438 (63.9) | 735 (68.8) | 886 (63.4) | 2332 (67.5) |
| BMI ≥25.0 kg/m2, n (%) | 2106 (27.7) | 235 (34.3) | 239 (22.4) | 464 (33.2) | 847 (24.5) |
| Missing or out of range (≤mean -3SD or ≥mean+3SD), n (%) | 195 (2.6) | 6 (0.9) | 17 (1.6) | 18 (1.3) | 79 (2.3) |
| Smoking status, n (%) | |||||
| Never smoker | 2505 (32.9) | 155 (22.6) | 878 (82.1) | 301 (21.5) | 2543 (73.6) |
| Past smoker | 2134 (28.1) | 340 (49.6) | 93 (8.7) | 709 (50.8) | 392 (11.3) |
| Current smoker | 2877 (37.8) | 166 (24.2) | 65 (6.1) | 333 (23.8) | 397 (11.5) |
| Missing | 91 (1.2) | 24 (3.5) | 33 (3.1) | 54 (3.9) | 123 (3.6) |
| Alcohol drinking, n (%) | |||||
| Constitutionally never drinker | 314 (4.1) | 23 (3.4) | 69 (6.5) | 55 (3.9) | 205 (5.9) |
| Never drinker | 1584 (20.8) | 90 (13.1) | 519 (48.6) | 182 (13.0) | 1593 (46.1) |
| Past drinker | 87 (1.1) | 21 (3.1) | 15 (1.4) | 45 (3.2) | 64 (1.9) |
| Current drinker | 5598 (73.6) | 551 (80.4) | 451 (42.2) | 1111 (79.5) | 1564 (45.3) |
| Missing | 24 (0.3) | 0 (0.0) | 15 (1.4) | 4 (0.3) | 29 (0.8) |
Values of ≤mean -3SD or ≥mean +3SD are deleted.
Characteristics at birth of siblings and minor extended family members based on available parent-administered questionnaires
| Minor extended | ||
|---|---|---|
| Siblings | family members | |
| n | 8917 | 352 |
| Sex, n (%) | ||
| Boys | 4577 (51.3) | 185 (52.6) |
| Girls | 4326 (48.5) | 165 (46.9) |
| Missing | 14 (0.2) | 2 (0.6) |
| Delivery week, n (%) | ||
| Preterm (<37 w) | 412 (4.6) | 21 (6.0) |
| Normal term (37 w-<42 w) | 8334 (93.5) | 314 (89.2) |
| Postmature (≥42 w) | 69 (0.8) | 1 (0.3) |
| Missing or out of range (<22 w or ≥45 w) | 102 (1.1) | 16 (4.5) |
| Birthweight, n (%) | ||
| ≥2500 g | 8141 (91.3) | 306 (86.9) |
| <2500 g | 616 (6.9) | 35 (9.9) |
| Missing or out of range (≤mean -3SD or ≥mean +3SD) | 160 (1.8) | 11 (3.1) |
| Birthweight (g), mean (SD)a | 3054.2 (384.9) | 3018.2 (382.7) |
w, weeks.
Values of ≤mean -3SD or ≥mean +3SD are deleted.
Table 7 presents follow-up results for babies at birth and at 1 month after birth, based on obstetric medical records. Boys outnumbered girls. Some obstetric medical records described newborns’ sex as ‘unidentified’ and we could not find words regarding newborns’ sex in several records, which possibly indicated that obstetric medical doctors could not determine the sex. When we could not find information about a newborn’s sex, we described it as ‘missing’ in Table 7. Approximately 92.7% of the newborns were delivered at normal term, but 7.0% were delivered preterm. The proportion of low birthweight (LBW), defined by the World Health Organization as a birthweight of an infant of 2499 g or less, regardless of gestational age,48 was 9.0%. The average birthweight, body length and the proportion of LBW infants in this cohort were almost compatible with the national averages.49,50 Japan had the highest proportion of LBW infants among Organisation for Economic Co-operation and Development (OECD) countries.51 Low birthweight is an important indicator of both neonatal mortality and morbidity and is associated with long-term health, including chronic diseases.11 Our unique epidemiological study of the TMM BirThree Cohort Study will contribute to the elucidation of the genetic and environmental risk factors associated with LBW, using information from three generations, and to the evaluation of the lifelong effects of LBW. ‘Life course epidemiology’, which will be realized in the TMM BirThree Cohort Study, is very important because more findings based on the follow-up data will be obtained.
Follow-up results of newborns at birth and at 1 month after birth, based on available obstetric medical records
| Number (%) for categorical variables and mean (SD) for continuously measured variables | |
|---|---|
| At birth, n =22 834 | |
| Sex, n (%) | |
| Boys | 11 808 (51.7) |
| Girls | 11 017 (48.2) |
| Unidentifieda | 9 (0.0) |
| Delivery week, n (%) | |
| Preterm (<37 w) | 1602 (7.0) |
| Normal term (37 w-<42 w) | 21 172 (92.7) |
| Postmature (≥42 w) | 27 (0.1) |
| Missing or out of range (<22 w or ≥45 w) | 33 (0.1) |
| Birthweight, n (%) | |
| ≥2500 g | 20.459 (89.6) |
| <2500 g | 2060 (9.0) |
| Out of range (≤mean -3SD or ≥mean +3SD) | 315 (1.4) |
| Birth weight (g), mean (SD)b | 3025.6 (403.6) |
| Body length (cm), mean (SD)b | 49.2 (2.6) |
| Head circumference (cm), mean (SD)b | 33.3 (1.6) |
| At 1 month after birth, n =22 212 | |
| Methods of nutrition, n (%) | |
| Breastfeeding | 12 058 (54.3) |
| Mixed feeding | 8750 (39.4) |
| Formula feeding | 779 (3.5) |
| Missing | 625 (2.8) |
| Body weight (g), mean (SD)b | 4124.3 (550.7) |
| Body length (cm), mean (SD)b | 53.2 (2.4) |
| Head circumference (cm), mean (SD)b | 36.6 (1.5) |
w, weeks.
Of 9 newborns, 7 newborns were described ‘Unidentified’ and 2 newborns were no information about sex on obstetrical medical records at birth.
Values of ≤mean-3SD or ≥mean+3SD are deleted.
At 1 month after birth, more than half of the mothers were breastfeeding. The average body weight of infants increased more than 1000 g compared with the weight at birth.
We have published the TMM protocol, which includes the outline of the TMM BirThree Cohort Study.25 The details of the TMM BirThree Cohort Study are available at [http://www.megabank.tohoku.ac.jp/english/].
Correlation of low birthweight among three-generation participants
We examined the correlation of LBW48 among the three-generation participants. Birthweight data for 13 141 mothers, 6576 fathers, 2758 grandmothers and 989 grandfathers were collected from self-reported questionnaires and divided into categories. Birthweight data for newborns (11 957 boys and 11 089 girls) were derived from obstetric medical records. The kappa coefficient was strongest between newborn girls and mothers (kappa coefficient = 0.09). Corresponding coefficients were 0.02 for newborn boys and fathers, 0.02 for newborn girls and grandmothers and 0.04 for newborn boys and grandfathers. The results indicate that LBW might be inherited through the maternal line.
The prevalence of postpartum depression at 1, 6 and 12 months after delivery
We examined the EPDS43,44 for postpartum depression. Postpartum depression was defined as an EPDS score of ≥9. Among 12 205 postpartum women who completely answered the EPDS at 1, 6 and 12 months after delivery, 13.7%, 12.8%, and 11.3% of women, respectively, were identified as having postpartum depression. It has been reported that the prevalence increased to 21.3% after the GEJE,52 compared with 13.9% in the general population of postpartum women.53 Nevertheless, we found that the prevalence of postpartum depression about 3 to 7 years after the GEJE was almost comparable to that of the general population.
What are the main strengths and weaknesses?
To our best knowledge, the TMM BirThree Cohort Study is the first study to involve a birth and three-generation cohort from an initial stage of cohort construction combined with genome and omics analyses. Corbett et al.54 stated large, multigenerational prospective cohort studies are needed. The integration of the birth cohort and the three-generation cohort designs will further create a synergistic effect that will bring marked advantages to prospective genome cohort studies.
Unique features of the TMM BirThree Cohort as a birth cohort study
This cohort will serve as a powerful resource for the study of developmental origins of health and disease (DOHaD) theory.11 The DOHaD theory, as advocated by Gluckman and Hanson, posits that the development of non-communicable diseases in adulthood is influenced by environmental factors that are encountered in early life, in addition to genetic factors and lifestyle factors in adulthood.55
It is important to note that several birth cohort studies are currently being successfully conducted.12–15,17 Of these, some birth cohort studies are being extended. For example, the Avon Longitudinal Study of Parents and Children (ALSPAC), conducted by the University of Bristol in UK from 1990,12 has initiated an extended study in which the offspring and partners of the original ALSPAC participants are asked to participate in the Children of the Children of the 90s (COCO90s) study when they become pregnant.56 The Framingham Heart Study in USA has established second- and third-generation cohorts. The investigators recruited the offspring of the ‘Original Cohort’ and their spouses as the ‘Offspring Cohort’, and recruited children of the ‘Offspring Cohort’ as the ‘Third Generation Cohort (Gen III)’.57 The Uppsala Birth Cohort in Sweden established a first-generation cohort in Uppsala University Hospital from 1915 to 1929, and all subsequent generations born to this cohort members have also been traced.58 Because these are quite important study expansions, the TMM BirThree Cohort Study is also planning a similar study expansion.
Unique features of the TMM BirThree Cohort as a three-generation cohort study
To our knowledge, the only cohort study with a three-generation design from the beginning of the cohort is the Lifelines Cohort Study.20,21 With a three-generation design, the TMM BirThree Cohort Study, the Lifelines Cohort Study and other extended cohort studies could reveal the effects of environmental factors, such as lifestyles, through multiple generations. For example, Golding et al.59 reported that if both the maternal grandmother and the mother had smoked, the female offspring have reduced height, weight and fat/lean/bone mass compared with girls born to smoking mothers whose own mothers had not smoked.
Regarding genetic factors, as a three-generation cohort study, the TMM BirThree Cohort Study will serve as a powerful platform that can provide precise information on rare variants and de novo mutations. As Manolio and colleagues suggested,26 the ‘missing heritability’ for common diseases is likely to be attributed in part to multiple rare variants, and de novo mutations remain a critical problem. That is, complex human disease is actually thought to be a large collection of individually rare conditions.60 Based on detailed information of pedigree and allele inheritance, which is available in the multigenerational study design, recombination mapping can be conducted to search for family-specific rare variants that have large effects on the subtypes of an apparently common disease, as well as de novo mutations. It is also important to consider gene-environment interactions.61,62 The study design enables the assessment of gene-environment interactions by testing whether an environmental risk factor has different effects between people at a genetically higher risk, which can be determined by familial aggregation, and those at a lower risk. The three-generation design could contribute to the elucidation of ‘missing heritability’ for common diseases from the perspectives of both genetic and environmental factors.
When paternal/maternal allele-specific effects related to common diseases are estimated, information about the grandparents, based on a three-generation design, could contribute to confirming paternal or maternal origin.63,64 The inclusion of all family members from three generations enables a direct haplotype assessment.65 Familial information may enable the estimation of genetic and non-genetic familial transmission and aid investigations of the effects of assortative mating on offspring characteristics, inter-generational (dis)similarities and socioeconomic mobility.20,21,66,67 As previously mentioned, the participation rate was lower in males than in females. In the study design, however, genotypes and haplotypes of non-participants, if not all, can be estimated based on those of their spouse, children and other relatives. Additionally, when the genotype is only available for one parent, the transmission disequilibrium test (1-TDT) proposed by Sun et al.68 may help.
Regarding the implementation of a long-term cohort study, a family member could provide information of current status of the cohort for other family members. Revisiting a community support centre or responding to a questionnaire could facilitate the direction of attention to other family members’ revisiting or responding.20
Other strengths and limitations
In 2016, the TMM BirThree cohort was able to recruit 49.6% of the newborns in Miyagi Prefecture (8605 out of 17 347 newborns).69 This high coverage appears to be attributable to multiple factors, but we surmise that well-trained GMRCs played an important role in recruiting participants. Our GMRCs have been trained in cordial communication with participants and in conducting scientific measurements.
Can I get hold of the data? Where can I find out more?
Data sharing policy of the TMM biobank
A biobank is being constructed based on the TMM BirThree Cohort Study and TMM CommCohort Study.25 Although we are planning to share the full baseline data by the end of 2020, a portion of the data have been distributed to researchers who have been approved by the Sample and Data Access Committee of the Biobank since 2017. Currently, Japanese research institutions are allowed full access to the data. Although phenotypic data and summary statistics are also available to researchers in foreign countries, we are in discussion regarding international distribution of genetic data.
In accordance with the development of the genome cohort design, a birth and three-generation cohort study appears to be essential for unravelling how genes and the environment compound on one another to determine health. We have conducted the Tohoku Medical Megabank Project Birth and Three-Generation Cohort Study (TMM BirThree Cohort Study) since July 2013 in Miyagi Prefecture, Japan.
In the TMM BirThree Cohort Study, the ‘fetus’ origin cohort consists of 74 116 persons and the ‘newborn’ origin cohort consists of 73 529 persons, including more than 22 000 pregnant women and more than 23 000 babies.
We collected questionnaire data and biospecimens at enrolment and during follow-up. For child participants, questionnaires are mailed to their parents almost once a year. At 6 months of age, 73.1% of the parent-administered questionnaires, and at 12 months of age, 61.7% of the questionnaires have been returned. For mothers and fathers, 61.6% and 48.4% of the questionnaires have been returned, respectively, when their children became 1 year old. For grandparents, 58.2% of the second-round questionnaires have been returned during follow-up. For pregnant women, blood and urine were collected during early and mid-pregnancy, and 1 month after birth. Umbilical cord blood was collected at delivery. Blood samples are available for 97.1% of mothers, 84.0% of fathers, 94.1% of grandparents and 21.8% of siblings of newborns. When the children are 4, approximately 10 and approximately 16 years old, their families are invited to take the children for health assessment.
We have obtained further detailed health information of all family members from medical records, participants’ own maternal and child health handbooks when possible, disease registration systems and the electronic health record of the Miyagi Medical and Welfare Information Network.
Currently, Japanese research institutions are allowed full access to the data, but we are in discussion about international distribution of genetic data.
Funding
The TMM is supported by grants from the Reconstruction Agency, the Ministry of Education, Culture, Sports, Science and Technology (MEXT) and the Japan Agency for Medical Research and Development (AMED). This research was supported by AMED under grant numbers JP15km0105001, JP16km0105001, JP17km0105001, JP15km0105002, JP16km0105002 and JP17km0105002. The Reconstruction Agency, MEXT and AMED had no role in the design of the study nor in the conduct of the study.
Acknowledgements
The authors are sincerely grateful to the people of Japan and of the world for providing their valuable support to the individuals and areas affected by the GEJE disaster. We thank the members of ToMMo and IMM, including the GMRCs, office and administrative personnel and software engineers, for their assistance with the projects. The full lists of members are available at [http://www.megabank.tohoku.ac.jp/english/a150601] for ToMMo and [http://iwate-megabank.org/en/about/departments] for IMM.
Conflict of interest: None declared.
References
National Police Agency of Japan. Damage Situation and Police Countermeasures Associated With 2011 Tohoku District - Off the Pacific Ocean Earthquake. Tokyo: National Police Agency of Japan,
World Medical Association.
Ministry of Education, Culture, Sports, Science and Technology, Ministry of Health, Labour and Welfare, Ministry of Economy, Trade and Industry. Ethical Guidelines for Human Genome/Gene Analysis Research. Tokyo: Ministry of Education, Culture, Sports, Science and Technology, Ministry of Health, Labour and Welfare, Ministry of Economy, Trade and Industry,
Vital Health and Social Statistics Office, Ministry of Health, Labour and Welfare. Vital Statistics of Japan. Tokyo: Ministry of Health, Labour and Welfare,
Miyagi Medical and Welfare Information Network. Sendai: MMWIN. http://mmwin.or.jp/ (17 August 2018, date last accessed).
United Nations Children’s Fund and World Health Organization.
Director-General for Statistics and Information Policy, Ministry of Health, Labour, and Welfare. Vital Statistics in Japan. Trends up to 2016. Tokyo: Ministry of Health, Labour, and Welfare,
OECD.
Miyagi Prefectural Government. Vital Statistics Report. Sendai: Miyagi Prefectural Government. https://www.pref.miyagi.jp/site/toukei/h28kakutei-.html (17 August 2018).
Appendix
Including the initially mentioned investigators, the Tohoku Medical Megabank Project Study Group members as of 1 September 2018 are as follows. Tohoku University Tohoku Medical Megabank Organization (ToMMo): Principal Investigator: Masayuki Yamamoto; Study Group Members: Michiaki Abe, Yayoi Aizawa, Yuichi Aoki, Koichi Chida, Inaho Danjoh, Shinichi Egawa, Ai Eto, Takamitsu Funayama, Nobuo Fuse, Yohei Hamanaka, Yuki Harada, Hiroaki Hashizume, Shinichi Higuchi, Sachiko Hirano, Takumi Hirata, Masahiro Hiratsuka, Atsushi Hozawa, Kazuhiko Igarashi, Jin Inoue, Noriko Ishida, Naoto Ishii, Tadashi Ishii, Mami Ishikuro, Kiyoshi Ito, Sadayoshi Ito, Maiko Kageyama, Fumiki Katsuoka, Hiroshi Kawame, Junko Kawashima, Masahiro Kikuya, Kengo Kinoshita, Kazuyuki Kitatani, Tomomi Kiyama, Hideyasu Kiyomoto, Tomoko Kobayashi, Eiichi Kodama, Mana Kogure, Kaname Kojima, Sachie Koreeda, Seizo Koshiba, Shihoko Koyama, Hisaaki Kudo, Kazuki Kumada, Shigeo Kure, Miho Kuriki, Shinichi Kuriyama, Yoko Kuroki, Norihide Maikusa, Satoshi Makino, Hiroko Matsubara, Hiroyuki Matsui, Hirohito Metoki, Takahiro Mimori, Naoko Minegishi, Kazuharu Misawa, Masako Miyashita, Satoshi Mizuno, Hozumi Motohashi, Ikuko N. Motoike, Keiko Murakami, Satoshi Nagaie, Masato Nagai, Fuji Nagami, Masao Nagasaki, Sachiko Nagase, Naoki Nakamura, Tomohiro Nakamura, Naoki Nakaya, Keiko Nakayama, Akira Narita, Ichiko Nishijima, Takahiro Nobukuni, Kotaro Nochioka, Taku Obara, Soichi Ogishima, Noriaki Ohuchi, Gervais Olivier, Noriko Osumi, Hiroshi Otsu, Akihito Otsuki, Daisuke Saigusa, Sakae Saito, Tomo Saito, Masaki Sakaida, Mika Sakurai-Yageta, Yuki Sato, Yukuto Sato, Atsushi Sekiguchi, Chen-Yang Shen, Tomoko F. Shibata, Ritsuko Shimizu, Kazuro Shimokawa, Matsuyuki Shirota, Junichi Sugawara, Kichiya Suzuki, Yoichi Suzuki, Shu Tadaka, Makiko Taira, Takako Takai-Igarashi, Yuji Takano, Yasuyuki Taki, Gen Tamiya, Osamu Tanabe, Hiroshi Tanaka, Yukari Tanaka, Shunsuke Teraguchi, Takahiro Terakawa, Teiji Tominaga, Hiroaki Tomita, Akito Tsuboi, Naho Tsuchiya, Ichiro Tsuji, Masao Ueki, Akira Uruno, Nobuo Yaegashi, Junya Yamagishi, Yumi Yamaguchi-Kabata, Chizuru Yamanaka, Riu Yamashita, Jun Yasuda, Junji Yokozawa and Kazunori Waki. Iwate Medical University Iwate Tohoku Medical Megabank Organization (IMM): Principal Investigator: Makoto Sasaki; Study Group Members: Junko Akai, Ryujin Endo, Akimune Fukushima, Ryohei Furukawa, Tsuyoshi Hachiya, Kouhei Hashizume, Jiro Hitomi, Yasushi Ishigaki, Shohei Komaki, Yuka Kotozaki, Takahiro Mikami, Motoyuki Nakamura, Naoyuki Nishiya, Satoshi Nishizuka, Yoko Nomura, Kuniaki Ogasawara, Hideki Ohmomo, Shinichi Omama, Ryo Otomo, Kotaro Otsuka, Kotaro Oyama, Kiyomi Sakata, Ryohei Sasaki, Mamoru Satoh, Namie Sato, Atsushi Shimizu, Yu Shiwa, Yoichi Sutoh, Nobuyuki Takanashi, Noriko Takebe, Fumitaka Tanaka, Ryoichi Tanaka, Kozo Tanno, Tomoharu Tokutomi, Kayono Yamamoto, and Fumio Yamashita.
Author notes
Shinichi Kuriyama, Hirohito Metoki, Masahiro Kikuya, Taku Obara, Mami Ishikuro, Chizuru Yamanaka,Shigeo Kure, Nobuo Yaegashi and Masayuki Yamamoto contributed equally to this work.
Study Group members are listed in the Appendix.

