


Abstract
To investigate the relative contributions of prenatal complications, perinatal characteristics, neonatal morbidities and socio-economic conditions on the occurrence of motor, sensory, cognitive, language and psychological disorders in a large longitudinal preterm infant population during the first 7 years after birth.
The study population comprised 4122 infants born at <35 weeks of gestation who were followed for an average of 74.0 months after birth. Developmental disorders, including motor, sensory, cognitive, language and psychological, were assessed at each follow-up visit from 18 months to 7 years of age. The investigated determinants included prenatal complications (prolonged rupture of membranes >24 hours, intrauterine growth restriction, preterm labour and maternal hypertension), perinatal characteristics (gender, multiple pregnancies, gestational age, birth weight, APGAR score and intubation or ventilation in the delivery room), neonatal complications (low weight gain during hospitalization, respiratory assistance, severe neurological anomalies, nosocomial infections) and socio-economic characteristics (socio-economic level, parental separation, urbanicity). Based on hazard ratios determined using a propensity score matching approach, population-attributable fractions (PAF) were calculated for each of the four types of determinants and for each developmental disorder.
The percentages of motor, sensory, cognitive, language and psychological disorders were 17.0, 13.4, 29.1, 25.9 and 26.1%, respectively. The PAF for the perinatal characteristics were the highest and they were similar for the different developmental disorders considered (around 60%). For the neonatal and socio-economic determinants, the PAF varied according to the disorder, with contributions of up to 17% for motor and 27% for language disorders, respectively. Finally, prenatal complications had the lowest contributions (between 6 and 13%).
This study illustrates the heterogeneity of risk factors on the risk of developmental disorder in preterm infants. These results suggest the importance of considering both medical and psycho-social follow-ups of preterm infants and their families.
This study, conducted as part of a large longitudinal population-based cohort study, illustrates the heterogeneity of various developmental disorder risk factors in preterm infants.
The population-attributable fractions (PAF) for perinatal characteristics amounted to 60%, irrespective of the developmental disorder. By contrast, for neonatal and socio-economic determinants, the PAF varied according to the developmental disorder considered, with the highest contributions for motor and language, respectively. Finally, prenatal complications had the lowest contributions on developmental disorders.
Prevention of neonatal comorbidities should allow the incidence of motor and sensory disorders to be reduced by around 15%. Similarly, a favourable socio-economic environment should allow the incidence of language, cognitive and psychological disorders to be reduced by around 25%.
These results suggest the importance of considering both medical and psycho-social follow-ups of infants and families.
Introduction
Advances in neonatal care have led to an increase in the survival of very preterm children.1–3 However, developmental sequelae are still a major problem, with a high risk for a wide range of neurodevelopmental impairments, including neuromotor, neurosensory, cognitive and behavioural disorders.3–15 Whereas the rate of cerebral palsy has recently decreased to an overall rate of around 5–9%,3,16,17 global and fine-motor-skill impairments are frequent, with rates ranging from 14 to 50% for infants between 2 and 8 years of age.6,9,10,18 The frequencies of developmental disorders vary according to the criteria used for the assessment and the age of the infants. However, overall, the rates of cognitive disorders range from 12 to 32% for infants aged between 2 and 8 years.4,6,11,16,18,19 The rate of behavioural disorders, such as attention-deficit/hyperactivity disorder, emotional symptoms or peer problems, can reach 25% in preterm children between 5 and 13 years of age.15,20,21 Finally, language ability is reduced in school-aged preterm infants compared with term infants,22 with frequencies ranging from 22 to 38%.23–25
The determinants of developmental disorders in preterm infants are complex and highly multifactorial. These factors include prenatal complications, perinatal characteristics, neonatal morbidities and the socio-economic environment. In regard to perinatal characteristics, the lower the gestational age, the higher the risk of neurodevelopmental impairments,3,4,18,26 cognitive deficiency21 and behavioural disorders.27 Being male is a major risk factor for cerebral palsy.17 Furthermore, a low birth weight is associated with an increased risk of cognitive deficiency.19,21 Among neonatal morbidities, cerebral lesions are major risk factors for motor disabilities such as cerebral palsy, with a very high predictive value,17 as well as severe cognitive disorders.19 Bronchopulmonary dysplasias are associated with an increased risk of cognitive impairment.28 Low weight gain during hospitalization is associated with a higher risk of neurodevelopment disorders.29 Finally, neonatal infections (both early- and late-onset) are associated with a higher risk of cerebral palsy.16 In addition to perinatal and neonatal characteristics, the socio-economic environment also influences the risk of developmental disorders. A low socio-economic status increases the risk of cognitive disorders at 4 years of age19,26,30 and early language disorders (at around 2 years of age).31 Furthermore, living in an urban area is associated with lower cognitive neurodevelopment at 5 years of age.32
The relative contributions of prenatal, perinatal, neonatal and socio-economic determinants are likely to differ for each developmental disorder. Understanding the contributions of each of these determinants allows better prevention and/or targeting through early interventions to reduce the occurrence of developmental disorders. The objective of this study was to investigate the relative contributions of prenatal complications, perinatal characteristics, neonatal morbidities and socio-economic conditions on the occurrence of motor, sensory, cognitive, language and psychological disorders in a large longitudinal preterm infant population during the first 7 years after birth.
Methods
Study population
The study population comprised surviving preterm infants enrolled in the Loire Infant Follow-up Team (LIFT),33 born at less than 35 weeks of gestation between January 2003 and December 2008, and who had at least one follow-up visit between 1 and 7 years of age (Figure 1). The LIFT network includes 24 maternity clinics in the Pays de la Loire (PDL) region with the objective of screening for early clinical anomalies associated with preterm births and providing specifically tailored care. The follow-up consisted of standardized visits by trained physicians at 3, 6, 9, 18 and 24 months as well as at 3, 4, 5 and 7 years after the birth of the infant.
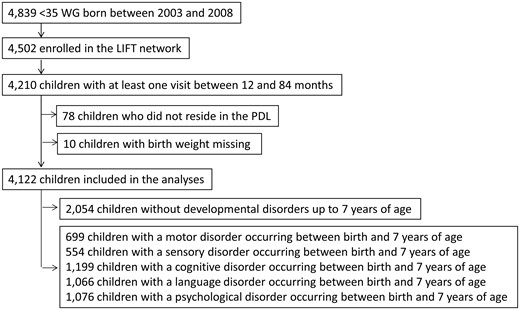
Flowchart of the inclusion.
Assessment of developmental disorders
Developmental disorders, including motor, sensory, cognitive, language and psychological impairments, were assessed at each follow-up visit from 18 months to 7 years of age. At the end of each visit, a medical summary was generated by gathering specific information from the referring paediatricians, psychologists, parents and teachers. A detailed description of the clinical diagnostic criteria and validated questionnaires that were used to assess developmental disorders according to the age of the infant is presented Supplementary Table 1, available as Supplementary data at IJE online.
Evaluations by the referring paediatrician
At each visit, the referring paediatricians performed a neurodevelopmental assessment, including physical examinations and a psychomotor sensory evaluation. Specific data regarding the diagnosis of cerebral palsy with an inability to walk independently, or milder signs, were recorded. Neuromotor assessments were based on Claudine Amiel-Tison’s recommendations and they comprised six sections including 35 items covering passive and active muscle tones, spontaneous motor activity and primary reflexes in particular.34 Visual and auditory disorders were also examined during the evaluation. When the children reached 4 years of age, the paediatricians completed the ERTL4 questionnaire (‘Epreuves de Repérage des Troubles du Language’), which is a validated questionnaire designed to screen and monitor language difficulties in French-speaking countries.35–37 The ERTL4 test is divided into four sections (E1 to E4) that assess the repetition of words, the repetition of sentences, adequate use of prepositions and the construction of sentences. Furthermore, at 18 and 24 months of age, the CHAT questionnaire was used to screen for autism disorders38,39 by assessment of whether the child had reached developmental milestones. Items include a report of behaviours such as taking an interest in other children, pointing and pretend play. Finally, at 5 and 7 years of age, the BREV questionnaire (‘Batterie Rapide d’Evaluation des Fonctions Cognitives’) was used to detect cognitive and language disorders.40 The BREV questionnaire was designed to explore oral language in both its expressive and receptive forms, and the main learning acquired in regard to reading, spelling and numeracy achievement.
Evaluations by specialized psychologists
Trained psychologists systematically performed a psychomotor evaluation at 2 years of age using the revised Brunet-Lézine (RBL) scale. The RBL scale evaluates four developmental areas: fine motor skills, social skills, language skills, posture and gross motor adaptation,41 thereby allowing four separate scores plus an overall developmental quotient (DQ) to be calculated. The RBL scale is routinely used in French-speaking countries.42
Parent-completed questionnaires
Two questionnaires completed by the parents were used between 18 months and 7 years of age. First, the Ages and Stages Questionnaire (ASQ) was completed at 18, 24, 36 and 48 months of age.43 This questionnaire comprises age-specific questions divided into five areas of child capacities: communication abilities, gross motor skills, fine motor skills, problem-solving abilities and personal-social skills. Second, the standardized Strengths and Difficulties Questionnaire (SDQ) was used at 4, 5 and 7 years of age to evaluate infant behaviour.44 Five subscales evaluated pro-social behaviour, hyperactivity, emotional symptoms, conduct and peer problems. An overall score was computed to evaluate whether an infant exhibits a significant problem.
Teacher-completed questionnaires
A last questionnaire, the Global School Adaptation (GSA) questionnaire, completed by the kindergarten teachers for children 5 and 7 years of age, was used to assess the children’s abilities and behaviour in the classroom.45,46 This questionnaire has been validated as a screening tool for adverse neurodevelopmental outcomes in preterm children.47 It comprises 20 items that examine five areas: language, transverse skills, socialization, motor skills and number processing.
Prenatal complications
Four prenatal complications were considered: (i) prolonged rupture of membranes >24 hours (yes vs no), (ii) intrauterine growth restriction (yes vs no), (iii) preterm labour (yes vs no) and (iv) maternal hypertension (yes vs no).
Perinatal characteristics
The perinatal data that were considered comprised (i) gender (male vs female), (ii) multiple pregnancies (yes vs no), (iii) the gestational age (GA) (24–31 vs 32–34 weeks of gestation), (iv) the birth weight (Z-scores <–1 vs ≥–1), (v) intubation or ventilation in the delivery room (yes vs no) and (vi) APGAR score (<7 vs ≥7). The birthweight Z-score was computed according to the Olsen standards.48
Neonatal morbidities
Four morbidities between birth and discharge were considered: (i) a low weight gain expressed as the difference between the Z-score of the weight at discharge and the Z-score of the weight at birth (<–1 vs ≥–1); (ii) respiratory assistance, including ventilation and continuous positive airway pressure (yes vs no); (iii) severe neurological anomalies assessed by ultrasound or magnetic resonance imaging, including a stage 3 or a stage 4 intraventricular haemorrhage, cerebral ventriculomegaly, periventricular leukomalacia or lesion of the basal ganglia (yes vs no); and (iv) nosocomial infection (i.e. administration of an antibiotherapy that lasted for more than 3 days) (yes vs no).
Socio-economic conditions
Three different dimensions of the socio-economic conditions were investigated: the socio-economic level, the parents’ relationship and the urbanicity of the residential municipality. These variables were considered at the first visit after birth (3-month visit). The socio-economic level was assessed based on the nature of the parents’ employment and the eligibility for social-security benefits for those with low incomes (yes vs no). Each parent’s employment was rated according to the official classification developed by the INSEE institute. If either parent’s job was highly rated, their socio-economic level was considered ‘high’; otherwise, it was considered ‘intermediate’. This categorization has been used in previous studies.49,50 Information regarding the parental relationship status was binary and rated either as the parents living together or the parents living separately. Finally, the residential municipality was considered to be either urban or rural, based on definitions developed by the INSEE institute that take into account the distance between buildings and the number of inhabitants.
Statistical analyses
The statistical analyses were performed in three steps. First, associations between prenatal complications, perinatal characteristics, neonatal morbidities, socio-economic conditions and the risk of developmental disorders were estimated separately for each type of disorder. Second, the corresponding population-attributable fractions (PAF) were calculated. Finally, the PAF of the four perinatal characteristics were added to yield an overall PAF of the perinatal characteristics. This was similarly done for the prenatal complications, neonatal morbidities and the socio-economic conditions. For the calculation of the PAF, continuous risk factors such as Z-score of birth weight were dichotomized. The choice of the cut-off values was based on visual inspection of smoothed functions estimated using generalized additive models. The PAF provide a useful way to express the burden of risk factors associated with the health outcome(s), taking into account both the prevalence of the risk factors and the strength of the associations between these risk factors and the outcome(s).
Associations between the prenatal complications, perinatal characteristics, neonatal morbidities and socio-economic conditions with the risk of developmental disorders were determined using survival analyses. A separate analysis was performed for each developmental disorder. The first occurrence of each developmental disorder was considered. To account for possible confusion, infants were matched by a propensity score. The factors considered for the estimations of the propensity scores are detailed in Supplementary Table 2, available as Supplementary data at IJE online. The factors to be considered in the propensity score were included based on the temporality between the different determinants. For example, to estimate the effect of the gestational age on the risk of motor disorders, the propensity score included prenatal complications, other perinatal characteristics and socio-economic conditions. In this case, the neonatal morbidities were not included, as they were posterior to birth and cannot therefore be considered as possible confounders. Then infants born at between 24 and 31 weeks were matched with infants born at between 32 and 34 weeks with a 1:1 ratio within a 0.2 caliper of standard deviation of the logit of the propensity score. A caliper width equal to 0.2 has been shown to have optimal properties in terms of bias reduction and resultant confidence intervals estimation.51 Covariate distributions between those exposed and those unexposed after matching were checked using standardized differences (SDs). Estimation of the effects of the different determinants on the risk of developmental disorders, expressed as hazard ratios (HR), was carried out using Cox models with a frailty variable to account for the matching between infants. To account for possible residual confounding after matching, the covariates used to estimate the propensity scores were added in the final models as adjustment variables.
Ethics approval
Written consent was obtained for each patient before inclusion in the study and the cohort was registered with the French Data Protection Authority for clinical research (CNIL, No. 851117).
Results
Between January 2003 and December 2008, 4502 infants born at less than 35 weeks of gestation in the PDL region of France were enrolled in the LIFT cohort (Figure 1). The following infants were excluded from the study population: infants who had no follow-up visit between 12 and 84 months of age (n = 292), infants who did not reside in the PDL region (n = 78) and infants for whom there was no record of their birth weight (n = 10). Due to these exclusions, the study population comprised 4122 preterm infants. The overall median length of the follow-up period was 74.0 months (mean = 70 months, SD = 19 months).
The percentages of motor, sensory, cognitive, language and psychological disorders were 17.0, 13.4, 29.1, 25.9 and 26.1%, respectively, with median ages at first occurrences of 28.8, 37.8, 60.0, 38.1 and 60.5 months, respectively (Figure 2). In terms of the perinatal characteristics, 54.2% of the infants were male (n = 2235) and 35.7% were born at <32 weeks of gestation (n = 1472) (Table 1).
Description of the prenatal complications, perinatal characteristics, neonatal morbidities and socio-economic conditions of included and non-included infants
| Infants included in the analyses | Infants not included in the analyses | P-value | |
|---|---|---|---|
| 4122 | 380 | ||
| Prenatal complications | |||
| Premature rupture of membranes | 0.961 | ||
| No | 3600 (87.3) | 331 (87.1) | |
| Yes | 522 (12.7) | 49 (12.9) | |
| Intrauterine growth restriction | 0.015 | ||
| No | 3603 (87.4) | 349 (91.8) | |
| Yes | 519 (12.6) | 31 (8.2) | |
| Preterm labour | 0.322 | ||
| No | 2553 (61.9) | 225 (59.2) | |
| Yes | 1569 (38.1) | 155 (40.8) | |
| Maternal hypertension | 0.008 | ||
| No | 3543 (86) | 307 (80.8) | |
| Yes | 579 (14) | 73 (19.2) | |
| Perinatal characteristics | |||
| Gender | 0.258 | ||
| Female | 1887 (45.8) | 186 (48.9) | |
| Male | 2235 (54.2) | 194 (51.1) | |
| Multiple pregnancies | <0.001 | ||
| No | 2574 (62.4) | 272 (71.6) | |
| Yes | 1548 (37.6) | 108 (28.4) | |
| Gestational age | <0.001 | ||
| 32–35 | 2650 (64.3) | 288 (75.8) | |
| 24–31 | 1472 (35.7) | 92 (24.2) | |
| Z-score of birthweight | 0.062 | ||
| ≥–1 | 3101 (75.2) | 295 (79.7) | |
| <–1 | 1021 (24.8) | 75 (20.3) | |
| Intubation or ventilation | 0.001 | ||
| No | 2770 (67.2) | 287 (75.5) | |
| Yes | 1352 (32.8) | 93 (24.5) | |
| APGAR score | 0.387 | ||
| ≥7 | 3930 (95.3) | 358 (94.2) | |
| <7 | 192 (4.7) | 22 (5.8) | |
| Neonatal morbidities | |||
| Low weight growth | 0.082 | ||
| No | 2488 (60.4) | 235 (61.8) | |
| Yes | 1019 (24.7) | 77 (20.3) | |
| Missing | 615 (14.9) | 68 (17.9) | |
| Respiratory assistance | <0.001 | ||
| No | 2641 (64.1) | 285 (75) | |
| Yes | 1481 (35.9) | 95 (25) | |
| Severe neurological disorders | 0.527 | ||
| No | 3950 (95.8) | 361 (95) | |
| Yes | 172 (4.2) | 19 (5) | |
| Nosocomial infection | 0.031 | ||
| No | 3564 (86.5) | 344 (90.5) | |
| Yes | 558 (13.5) | 36 (9.5) | |
| Socio-economic conditions | |||
| Eligibility for social-security benefits | 0.776 | ||
| No | 3681 (89.3) | 337 (88.7) | |
| Yes | 441 (10.7) | 43 (11.3) | |
| Socio-economic level | <0.001 | ||
| High | 1019 (24.7) | 36 (9.5) | |
| Intermediate | 3103 (75.3) | 344 (90.5) | |
| Parental separation | 0.07 | ||
| No | 3605 (87.5) | 345 (90.8) | |
| Yes | 517 (12.5) | 35 (9.2) | |
| Urbanicity | 0.5 | ||
| Urban | 1313 (31.9) | 128 (33.7) | |
| Rural | 2809 (68.1) | 252 (66.3) |
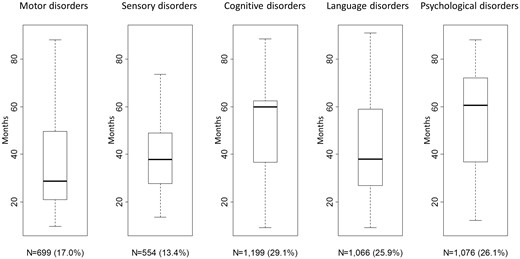
The first occurrence of developmental disorders up to 7 years of age.
Overall, having an intrauterine growth restriction, a preterm labour, being male, having a low gestational age or a low birth weight, being intubated or ventilated in the delivery room, having severe neurological anomalies or a nosocomial infection during the hospitalization, and being raised in a family with a low socio-economic level were associated with an increased risk of developmental disorders (Figure 3 and Supplementary Figure 1, available as Supplementary data at IJE online). SD were calculated to check for the covariate distributions before and after matching. For each developmental disorder, 176 SD were calculated (880 for the five developmental disorders) corresponding to all the covariates considered in the matching procedure. Out of these SD, 56 (6.4%) were higher than 0.1 and only 2 higher than 0.25 (both equal to 0.26).
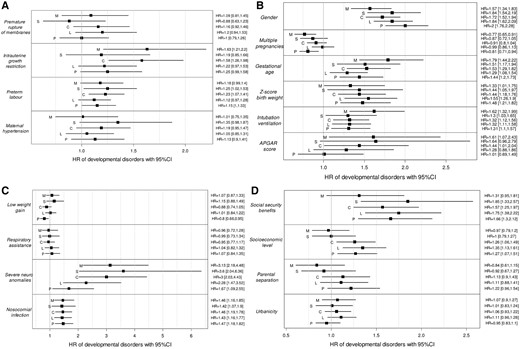
The increased risk of developmental disorders, expressed as hazard ratios (HR) with their 95% confidence intervals, according to (A) the prenatal complications, (B) the perinatal characteristics, (C) the neonatal morbidities and (D) the socio-economic conditions. M, motor disorders; S, sensory disorders; C, cognitive disorders; L, language disorders; P, psychological disorders. HR were estimated using survival analyses (Cox model). To account for possible confusion, infants were matched with a 1:1 ratio within a 0.2 caliper of standard deviation of the logit of the propensity score (the variables included in the propensity scores are presented in Supplementary Table 2, available as Supplementary data at IJE online). The risk factors that were considered were as follows: prolonged rupture of membranes >24 hours (yes vs no), intrauterine growth restriction (yes vs no), preterm labour (yes vs no), maternal hypertension (yes vs no), gender (male vs female), multiple pregnancies (yes vs no), gestational age (GA) (24–31 vs 32–34 weeks of gestation), birth weight (Z-score <–1 vs ≥–1), intubation or ventilation in the delivery room (yes vs no), APGAR score (<7 vs ≥7), low weight gain (difference between the Z-score of the weight at discharge and the Z-score of the weight at birth <–1 vs ≥–1), respiratory assistance (yes vs no), severe neurological anomalies (yes vs no), nosocomial infection (yes vs no), socio-economic level (intermediate level vs high), eligibility for social-security benefits for those with low incomes (yes vs no), parental separation (parents living together or parents living separately) and residential municipality (urban vs rural).
The PAF for the perinatal characteristics were the highest among the four types of determinants for all of the developmental disorders, with values around 60% (Figure 4). When based only on potentially modifiable perinatal factors, i.e. gestational age, birth weight, intubation or ventilation in the delivery room and APGAR score, these PAF were equal to 54% for motor disorders, 33% for sensory disorders, 36% for cognitive disorders, 29% for language disorders and 32% for psychological disorders (dotted lines in Figure 4). On the other hand, the prenatal complications had the lowest contributions on motor, sensory and cognitive disorders (PAF around 10%). For the motor and sensory disorders, the second highest PAF corresponded to the neonatal morbidities (PAF around 15%) whereas, for the cognitive, language and psychological disorders, the second highest PAF corresponded to the socio-economic conditions (PAF of around 25%). The detailed PAF of each separate risk factor are presented Supplementary Table 3, available as Supplementary data at IJE online.
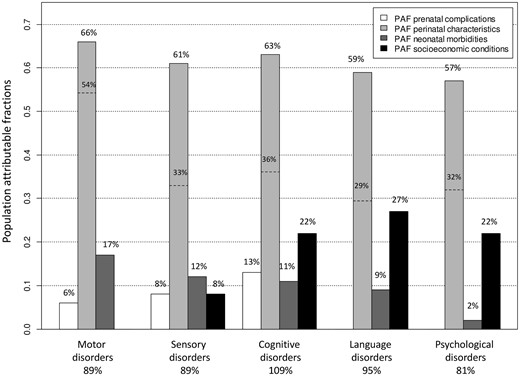
Population-attributable fractions (PAF) estimates for the prenatal complications (prolonged rupture of membranes >24 hours, intrauterine growth restriction, preterm labour and maternal hypertension), the perinatal characteristics (gender, multiple pregnancies, gestational age, birth weight, intubation or ventilation in the delivery room and APGAR score), the neonatal morbidities (low weight gain, respiratory assistance, severe neurological anomalies and nosocomial infection) and the socio-economic conditions (socio-economic level, social-security benefits, parental separation and residential municipality) according to the developmental disorders. The PAF were calculated for all of the significant hazard ratios (detailed in Figure 3) and added together within each category of determinants, i.e. prenatal, perinatal, neonatal and socio-economic. For the perinatal characteristics, two percentages are provided: the percentage corresponding to the six characteristics (on top of the vertical bars) and the percentage corresponding to the perinatal complications potentially amenable for intervention, i.e. gestational age, birth weight, intubation or ventilation in the delivery room and APGAR score (dotted lines).
Discussion
This study, which was part of a large longitudinal population-based cohort study, illustrated the heterogeneity of risk factors for developmental disorders. To our knowledge, this is the first study to investigate the effects of these various risk factors on different developmental dimensions in a large longitudinal population-based cohort of preterm infants. We found that the PAF for perinatal characteristics amounted to around 60%, irrespective of the developmental disorder. By contrast, for neonatal and socio-economic determinants, the PAF varied according to the developmental disorder considered, with values comprised between 2 and 27%. Finally, the prenatal complications had the lowest contributions around 10%. The strength of our study lies largely with the quantification of these various types of determinants within the same population that allow comparison of their relative contributions.
PAF can be interpreted as the proportions of disease cases that could be prevented by elimination of the exposures. Among perinatal characteristics, the gender and multiple pregnancies are not amenable to interventions, whereas the other factors could be targeted for intervention. Based on the PAF interpretation, elimination of the adverse perinatal characteristics should allow between 30 and 50% of the developmental disorders to be prevented. It has been shown that interventions such as cervical cerclage or smoking cessation could prevent between 2 and 8% of preterm births in women at risk (older age or with lower socio-economic level).53 Moreover, specific nutrition interventions during pregnancy, especially multiple micronutrients supplementation, had a positive effect in reducing low birth weight by 10–14%.54 The contributions of neonatal morbidities and socio-economic conditions varied according to the developmental disorder. Elimination of all of the neonatal morbidities should allow around 15% of the motor disorders to be prevented. Similarly, a favourable socio-economic environment should be able to reduce the language, cognitive and psychological disorders by around a quarter.
PAF are valid based on the assumption of a causal relationship between exposures and diseases. Potential violation of the causality could be due to measured and unmeasured confounders. Regarding measured confounders, the propensity score matching allows confounding biases to be limited. The balances of measured covariates between the exposed and unexposed groups showed that measured confounders were appropriately accounted for. Indeed, all the SD were ≤0.26 and, in the final models, the covariates used to estimate the propensity score were further used as adjustment variables. There is no widely accepted absolute criterion for assessing when balance occurs; however, some studies have suggested that the 0.25 value provides some guideline.55–57 Although the absence of unmeasured confounders cannot be formally established here, the number and diversity of risk factors for developmental disorders considered from prenatal complications to the socio-economic environment may have a priori reduced the risk of bias. However, some risk factors known to influence the developmental disorders were not taken into account, such as the age of the mother. The assumptions underlying valid PAF estimation also include the independence of the considered risk factors. To check for the validity of this assumption, the variance inflation factors (VIF) were calculated for all the risk factors considered. One model was run for each developmental disorder. The higher the value, the higher the collinearity. The definition of ‘high value’ is somewhat arbitrary but values between 5 and 10 are commonly used.58 All the VIF were <2.5 (Supplementary Table 4, available as Supplementary data at IJE online), indicating that the independence of the risk factors can reasonably be assumed, and therefore suggesting the validity of the PAF estimated.
The prevalences of motor,18 cognitive,4,11,18 language24,25 and psychological disorders20 found in this study are consistent with the prevalences reported for other studies conducted in preterm infant populations. In regard to the risk factors for developmental disorders, our results are in accordance with other studies conducted in preterm infant populations, with the exception of the effects of low weight gain during the hospitalization and the urbanicity (non-significant results). In regard to the effect of the low weight gain, the reason for this finding lies with the construction of the variable. We have considered a binary variable, corresponding to the difference between the Z-scores of the weight at birth and the weight at discharge <–1 vs ≥–1. When considering a categorical variable that allows comparison of infants with a difference between Z-scores <–1 and ≥0, we found an increased risk of motor disorders. This exposure was considered binary for the calculation of the PAF (i.e. exposed vs not exposed). In regard to the effect of urbanicity, we did not find association with cognitive disorders. Although it has been reported that there is an association between urbanicity and cognitive development at 5 years of age in preterm infants, this finding may be due to the fact that the study population in question only comprised preterm infants with optimal neurodevelopment at 2 years of age.32
A major strength of this population-based study was the longitudinal design that allowed developmental disorders of infants from 18 months to 7 years of age to be considered. Of the 4502 infants enrolled in the LIFT network, the longitudinal design meant that 91% of the infants (n = 4122) had at least one follow-up visit between 12 and 84 months of age and they could hence be included in the analyses. Moreover, investigation of various and diverse risk factors allowed part of the complexity of the associations between the prenatal complications, the infant characteristics at birth and during hospitalization, their socio-economic environment and their possible developmental disorders to be captured. The choice of the factors to include in each type of determinant was based on clinical expertise and literature. Each developmental disorder was assessed using appropriate diagnostic criteria and/or validated questionnaires according to the age of the infants. The fact that we found developmental disorder prevalences that are close to those reported in other studies underscores the appropriateness of the tools used to assess the developmental disorders. A further strength of our study is the large number of infants included, which allowed a high statistical power to be attained.
This study has limitations. First, the characteristics of infants who were excluded from the study population were not comparable to the characteristics of the children who were included (Table 1). Late-preterm infants with fewer neonatal complications born to families with a lower socio-economic level were overrepresented in the category that was not included for the analysis. However, the absolute differences in the characteristics were quite small, thus indicating that the inclusion criteria did not result in an obvious selection bias and that the findings of this study should be generalizable to the preterm birth infants in this part of France. Second, some infants were lost during the follow-up. However, for the infants enrolled in the LIFT network, 78.1% were still being followed at 5 years.33 Finally, some factors known to influence the developmental disorders were not available in this study, such as the parental age or their mental health.
Conclusion
This study illustrates the heterogeneity of risk factors on the risk of developmental disorder in preterm infants. These results suggest the importance of considering both medical and psycho-social follow-ups of infants and their families.
Funding
This work was supported by grants from the Regional Health Agency of the Pays de la Loire. The sponsor had no role in regard to this manuscript.
Conflict of interest: The authors have declared that they have no conflict of interest.

