


Abstract
Studies on immigrants revealed an epidemiological paradox whereby low-socioeconomic status (SES) immigrant mothers exhibit favourable birth outcomes compared with native-born mothers. We tested the epidemiological paradox in a context of forced migration, comparing associations of low birthweight (LBW) and maternal SES between Syrian and Lebanese newborns in Lebanon.
We used data from the National Collaborative Perinatal Neonatal Network (NCPNN) of 31 Lebanese hospitals, including 45 442 Lebanese and 4910 Syrian neonates born 2011–13. We assessed associations between LBW and maternal SES for both groups. Logistic regression models examined interactions between maternal origin and SES.
Syrian births increased exponentially between 2011 and 2013, along with the group’s forced migration into Lebanon. Although Syrian mothers are more socioeconomically disadvantaged compared with Lebanese mothers, Syrian LBW (6.2%) was only marginally higher than Lebanese LBW (5.6%; P = 0.059). Only 20–24-years-old Syrian women [odds ratio (OR) = 1.70 (1.22–2.36)] and those with ≥ university education [OR = 2.02 (0.98–4.16)] exhibited higher odds of delivering an LBW baby compared with Lebanese women of the same age and education.
The findings do not provide strong evidence for the epidemiological paradox in a forced migration context. However, the relatively advantageous LBW profile among Syrian neonates, despite their mothers’ low SES and exposure to acute and chronic psychological stress, points to protective mechanisms. One of these mechanisms may be a collective response by the displaced population to improve neonatal outcomes as a way of recovering from loss and death.
The number of Syrian births in NCPNN hospitals increased exponentially between 2011 and 2013 due to forced migration following the war in Syria.
Although Syrian mothers are younger and less educated compared with Lebanese mothers, their odds of delivering an LBW neonate were only marginally higher [OR = 1.20; 95% confidence interval (CI) = 0.97-1.48].
Among Lebanese mothers, LBW showed a typical U-shaped association with age and an inverse association with maternal education; among Syrians mothers, LBW did not display a significant association with age or maternal education.
Our findings do not provide strong evidence for the epidemiological paradox. However, the relatively advantageous LBW profile among Syrian neonates, despite their mothers’ low SES and exposure to psychological stress, points to protective mechanisms, one of which may be a collective response to recover from loss and death.
Background
Promoting equity in child health and reducing preventable neonatal and infant deaths are two primary targets of the health Sustainable Development Goal 3.1 Low birthweight (LBW), or weighting less than 2500 g at birth, poses great challenges to child health in poor settings. LBW consists of preterm birth and small-for-gestational-age neonates, two outcomes that contribute to neonatal and infant mortality globally.2 Even when LBW babies survive beyond their first year of life, they may suffer repeated childhood infections, poor developmental outcomes and chronic disease risk in adulthood.3–6 Given its short- and long-term consequences, LBW is recognized as a global public health problem, and is both a predictor and a determinant of socioeconomic disadvantage.7,8
Consistent evidence has shown the negative effects of SES on LBW, in both high-income9–12 and low- and middle-income settings,13–17 with maternal education, in particular, exerting a strong negative gradient. Moreover, young maternal age, oftentimes viewed as an indication of low SES, increases the risk of poor perinatal outcomes in general and LBW specifically.18–20 Notwithstanding the robust global evidence on the negative SES-LBW association, studies on perinatal outcomes among immigrants have shown a non-linear relationship, whereby immigrant status exerts a protective effect among low SES mothers.21–22 Initially observed among Latino immigrants in the USA,23 the lower risk of LBW (and other perinatal health outcomes) among low-SES immigrant women has been labelled an epidemiological paradox.24–26 The paradoxical findings are not limited to the USA, with evidence from Canada and Belgium uncovering similar findings; in both settings, immigrant status was associated with lower risk of LBW among low-SES mothers.27,28
International studies have focused on two potential explanations for the epidemiological paradox—the effect of selective migration and resistance to acculturation.21,29,30 The first proposes that healthier women are more likely to emigrate and that this selective process flattens the association between SES and poor birth outcomes. The second emphasizes the role of origin culture and community cohesion in promoting health and buffering against the deleterious effects of poor SES on health. Evidence on the paradox thus far has come from immigrant-receiving countries, where it is safe to assume that most migration has been driven by economic factors, and where the immigrants’ culture differs from that of the native-born population. To date, the epidemiological paradox has not been researched in a setting of forced migration where people flee their homes to escape violence, a process that is less selective compared with economic migration. Forced migration is determined more by geography than economic resources, as people initially flee to the closest safe area within their own country or cross the nearest international border.31
As systematic evidence suggests that women’s exposure to violent conflict associates with poor pregnancy outcomes, particularly LBW,32 it is all the more important to understand the reproductive health risk experienced by women who are forcibly displaced due to war. Testing the epidemiological paradox in contexts of forced migration promises to refine our understanding of possible explanations of the phenomenon and provide more realistic estimates of the magnitude of perinatal health risk among forcibly displaced women. In this study, we test the paradox among Syrian women who were displaced into Lebanon during the first 2 years following the onset of the Syria crisis in 2011, and who gave birth in a Lebanese hospital. In line with the published literature, we hypothesize that low-SES Syrian women who gave birth in Lebanon between 2011 and 2013 had lower or equal odds of delivering an LBW neonate compared with native Lebanese women. Given increasing attention to early marriage (and early pregnancy) among Syrian refugees, and given that young maternal age is a proxy for low SES, we extend the epidemiological paradox and examine whether young Syrian mothers also had lower odds of LBW.
Syrian refugees in Lebanon
Lebanon, an upper-middle-income country, has made significant progress in reducing child mortality over the past three decades and is well poised to achieve the child health SDG targets. The neonatal mortality rate (NMR) dropped from 18 per 1000 in 1990 to 12 per 1000 in 201033; World Bank data show that, in 2015, NMR in Lebanon was well below 10 per 1000.34 Data on geographic, social and economic inequalities in child health and mortality have rarely been investigated in Lebanon where it is assumed that overall improvement in child health is equally distributed in the population. Shortly after the onset of the Syria crisis in March 2011, Lebanon began hosting an increasing number of Syrians escaping civil war in their home country; the number of forcibly displaced Syrians in Lebanon increased from less than 30 000 in late 2011 to almost one million in December 2013.35 A country of 4.5 million, Lebanon currently hosts 1 011 366 Syrian refugees,36 most of whom live in dire socioeconomic conditions.
There are vast differences between the Syrian and Lebanese health care systems. The Lebanese system is highly privatized, with secondary and tertiary health services primarily provided in private hospitals or institutions belonging to political parties.37 Childbirth by a skilled attendant and in a hospital facility is almost universal in Lebanon.38 Conversely, before the conflict, the Syrian state espoused a welfare system in which health services were provided for free or at very low cost. For a long time, however, the Syrian health system faced challenges related to efficiency, quality, and equity.39 Elaborating on these challenges is beyond the scope of this paper; of note, however, are the high regional inequalities in access to basic maternal and neonatal health services. An analysis of the 2006 Syria Multiple Indicator Cluster Survey revealed that 29% of women delivered at home and only 57% of neonates were weighed at birth; among newborns who were weighed, the LBW rate was 10%.40
In Lebanon, the majority of Syrian refugee women give birth in a health facility (96% in 2017); half do so in a governmental facility, and 73% receive financial support from the United Nations High Commissioner for Refugees (UNHCR) to cover the cost of delivery.41 UNHCR subsidizes maternal and neonatal services by paying 75% of the cost of facility delivery through a private insurance scheme.41,42 It also covers the following services: family planning (insertion of intra-uterine devices, pills, condoms), two ultrasounds, four antenatal consultations, laboratory and diagnostic tests, and one postnatal consultation. Aside from a few field-based surveys commissioned by international humanitarian agencies or studies based on data from one medical facility,43,44 very limited systematic study has been conducted on the maternal and child health outcomes of the Syrian refugee population in Lebanon.
In this study, we evaluated the profile of Syrian women, the majority of whom were forcibly displaced into Lebanon after the Syria crisis in 2011, who gave birth in Lebanese hospitals between 2011 and 2013. We assessed associations between LBW and maternal education, and between LBW and young maternal age (a proxy for low SES). The main objective of the study was to test the epidemiological paradox among Syrian mothers through examining the interactions between maternal origin and education, and maternal origin and age, in relation to LBW.
Methods
Study population
The study used data from the National Collaborative Perinatal Neonatal Network (NCPNN) of 31 Lebanese hospitals. NCPNN was established in 1998 as a surveillance system, with the goal of collecting maternal and neonatal health outcomes, identifying risk factors and informing policy and practice. The Network is housed at the American University of Beirut Medical Center but includes 30 other public and private hospitals located across all six Lebanese regions. Currently, NCPNN covers 26% of all hospital births in the country and collects data on live births, stillbirths and mortality until discharge from the hospital. Maternal and neonatal data are collected in each hospital by trained staff (nurses, midwives or research assistants) using standardised medical forms.
NCPNN hospitals cover the delivery of Lebanese and non-Lebanese women of diverse regional and socioeconomic backgrounds, and collect data on maternal origin; as such, data on Syrian women who gave birth in these hospitals since the beginning of the crisis are available. We included in our study all singleton live births delivered in the 31 NCPNN hospitals to Lebanese- and Syrian-origin mothers between 1 January 2011 and 31 December 2013, excluding babies born with birth defects and those from a maternal origin other than Lebanese or Syrian. The total sample size is 50 352.
Variables
The study’s outcome variable is LBW defined as weighing less than 2500 g at birth. Data on birthweight and gestational age were obtained from hospital medical records; based on gestational age, newborns were categorized into preterm (≤36 weeks) or term (>37 weeks), and small-for-gestational-age (SGA) was calculated on neonates born between 28 and 36 weeks of gestation.45 The three main independent study variables, also obtained from medical records, were: maternal origin (Lebanese or Syrian), age and education. As hospitals do not collect information on refugee status, we obtained data on maternal origin which in most cases was reported as the nationality of the mother. Maternal origin data were cleaned and categorized into Lebanese, Syrian and other (not included in the current analysis). Maternal age was grouped into five categories: <20 years of age; 20–24; 25–29; 30–34; and 35 years or older. Maternal education was grouped into four categories: illiterate/elementary; intermediate; secondary/technical; and university education or higher. The study adjusted for the following confounders available from medical records: gestational age (continuous); sex of the neonate; maternal parity (nulliparous versus multiparous); maternal body mass index (underweight, normal weight, overweight and obese); smoking during pregnancy (a self-reported yes/no question); gestational diabetes (yes/no); maternal chronic hypertension (yes/no); and maternal chronic anaemia (yes/no).
Statistical analysis
Descriptive analyses were carried out to explore increases in the number of Syrian births in Lebanon from 2011 to 2013, to describe the sociodemographic and health characteristics of Lebanese and Syrian women and to calculate estimates for birthweight (continuous), LBW, (categorical) gestational age (continuous and categorical) and small-for-gestational age (categorical). Bivariate associations (using χ2 tests of significance) were conducted to assess associations between LBW and the main independent variables and confounders. We used multivariate logistic regression analysis to test whether maternal origin is an effect modifier in the association between LBW and maternal education, and LBW and maternal age. Following this, we specified logistic regression models to test for interactions between maternal origin and education (the epidemiological paradox), and between maternal origin and young maternal age. All multivariate analyses adjusted for confounders that showed significance at the bivariate level. Analyses were carried out using SPSS version 24.
Results
Descriptive characteristics
A total of 50 352 singleton live births who fitted the study’s inclusion criteria were born in NCPNN hospitals between 2011 and 2013: 45 442 Lebanese births (90.2%) and 4910 Syrian births (9.7%). Comparing with 320 Syrian births recorded in 2011, 978 were recorded in 2012 and 3612 were recorded in 2013 (Figure 1). Because the number of NCPNN hospitals was not changed during this period, the 10-fold increase in the number of Syrian births between 2011 and 2013 provides evidence that the overwhelming majority of these births during the 3-year period were to forcibly displaced Syrian women in Lebanon. The profiles of Lebanese and Syrian mothers differ by maternal age and education, showing that Syrian mothers are socio-economically disadvantaged (Figure 2). Compared with the Lebanese, Syrian women are younger and less educated. Only 4.4% of Lebanese compared with 14.4% of Syrian women were younger than 20 years old. Furthermore, more than one-third (36.7%) of Syrian women had elementary education or less and only 16.6% had secondary education or more. The educational profile of Lebanese women was the opposite, with only 15% having elementary education or less and the majority (63.4%) holding at least secondary education.
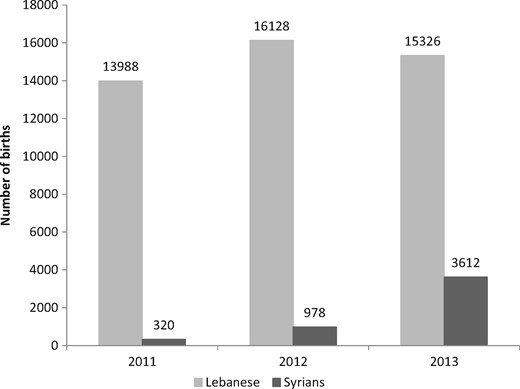
Number of births in NCPNN hospitals by maternal origin.
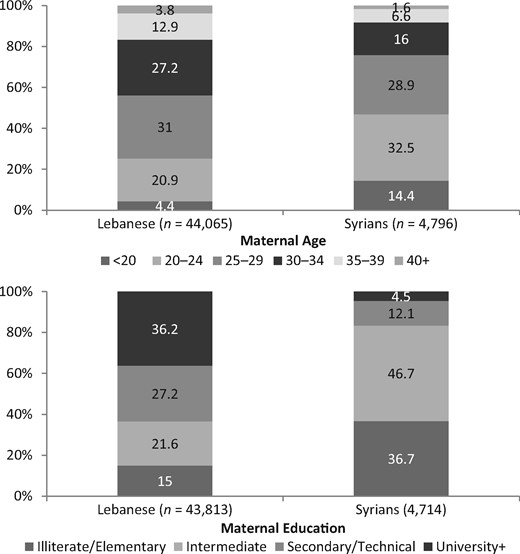
Age and education characteristics of Lebanese and Syrian women giving birth in NCPNN hospitals.
Bivariate results
LBW was 5.7% overall, 5.6% for neonates born to Lebanese women (n = 2483) and only marginally higher (6.2%) for neonates born to Syrian women (n = 300) (P = 0.059); see Table 1. Mean birthweight was lower among Syrian than Lebanese newborns (3155.79 ± 479.48 versus 3190.48 ± 472.53 g; P <0.001). Despite their lower mean birthweight, Syrian mean gestational age was higher compared with Lebanese (38.65 ± 1.55 versus 38.34 ± 1.52 weeks; P <0.001). Syrians and Lebanese had similar proportions of preterm newborns (7.1% and 7.7%, respectively; P = 0.115). Conversely, Syrians had 11.2% small-for-gestational-age newborns compared with only 7.3% for the Lebanese (P < 0.001).
Birthweight, LBW, gestational age, preterm birth, and small-for-gestational-age for Lebanese and Syrian women giving birth in NCPNN hospitals
| Lebanese | Syrians | P-value | |
|---|---|---|---|
| Birthweight in grams (mean ± SD) | 3190.48 ± 472.53 | 3155.79 ± 479.48 | <0.001 |
| LBW, n (%) | 2483 (5.6) | 300 (6.2) | 0.059 |
| Gestational age in weeks (mean ± SD) | 38.34 ± 1.52 | 38.65 ± 1.55 | <0.001 |
| Preterm births, n (%)a | 3385 (7.7) | 337 (7.1) | 0.115 |
| Small-for-gestational-age, n (%)b | 3339 (7.3) | 551 (11.2) | <0.001 |
SD, standard deviation.
Preterm birth is 21 to 36 weeks of gestation.
Calculated on newborns of 28 to 36 weeks of gestation.45
Table 2 presents bivariate associations between LBW and sociodemographic and health variables for the Lebanese and Syrian women separately. As expected, mean gestational age was lower for LBW compared with normal weight neonates for both Lebanese (35.92 ± 2.95 versus 38.48 ± 1.25; P <0.001) and Syrians (36.57 ± 2.80 versus 38.78 ± 1.34; P <0.001). For the Lebanese, LBW was highest among women in the youngest (7.5%) and oldest age categories (5.8%; P = 0.001); for the Syrians, it was highest among the 20–24 age group (7.2%) and decreased with increasing age. LBW was inversely associated with maternal education among Lebanese women, decreasing in a stepwise manner from 8% for those who had ≤elementary to 4.8% for those with ≥university education (P <0.001). Among Syrian women, LBW was also highest among the least educated group (8.4%) but did not show a clear negative association with education: 4.6% for intermediate, 6.6% for secondary and 5.9% for ≥university education (P <0.001). For both Lebanese and Syrians, LBW was higher for female than male neonates, among nulliparous compared with multiparous women, and among underweight mothers (all P-values <0.05). A higher proportion of Lebanese and Syrian women who smoked during pregnancy (8.8% and 8.3%, respectively) gave birth to a LBW neonate compared with non-smokers (5.3% and 6.0%, respectively); however, the P-value for Syrians was 0.099. Finally, LBW did not associate with any of the three clinical risk factors—anaemia, hypertension and gestational diabetes—for either Lebanese or Syrians.
Bivariate associations between LBW and main independent variables and confounders
| Lebanese | Syrian | |||||
|---|---|---|---|---|---|---|
| NBW n (%) | LBW n (%) | P-value | NBW n (%) | LBW n (%) | P-value | |
| Gestational age | ||||||
| Weeks (mean + SD) | 38.48 + 1.25 | 35.92 + 2.95 | <0.001 | 38.78 + 1.34 | 36.57 + 2.80 | <0.001 |
| Maternal age | ||||||
| <20 | 1758 (92.5) | 143 (7.5) | 0.001 | 633 (93.4) | 45 (6.6) | 0.205 |
| 20-24 | 8562 (94.8) | 473 (5.2) | 1422 (92.8) | 111 (7.2) | ||
| 25-29 | 12 746 (94.7) | 707 (5.3) | 1282 (94.1) | 80 (5.9) | ||
| 30-34 | 11 158 (94.6) | 634 (5.4) | 717 (94.7) | 40 (5.3) | ||
| ≥35 | 6818 (94.2) | 423 (5.8) | 367 (95.3) | 18 (4.7) | ||
| Maternal education | ||||||
| Illiterate/elementary | 5821 (92.0) | 503 (8.0) | <0.001 | 1550 (91.6) | 143 (8.4) | <0.001 |
| Intermediate | 8828 (94.6) | 500 (5.4) | 2073 (95.4) | 99 (4.6) | ||
| Secondary/technical | 11 183 (94.9) | 603 (5.1) | 522 (93.4) | 37 (6.6) | ||
| University+ | 14 900 (95.2) | 747 (4.8) | 193 (94.1) | 12 (5.9) | ||
| Sex of neonate | ||||||
| Male | 21 521 (95.1) | 1103 (4.9) | <0.001 | 2320 (94.7) | 129 (5.3) | 0.006 |
| Female | 19 925 (93.8) | 1328 (6.2) | 2155 (92.8) | 168 (7.2) | ||
| Parity | ||||||
| Nulliparous | 15 007 (93.8) | 998 (6.2) | <0.001 | 1323 (92.1) | 113 (7.9) | 0.001 |
| Multiparous | 26 586 (95.0) | 1410 (5.0) | 3158 (94.6) | 182 (5.4) | ||
| Maternal BMI | ||||||
| Underweight | 1441 (92.2) | 122 (7.8) | <0.001 | 113 (88.3) | 15 (11.7) | 0.013 |
| Normal | 20 989 (94.8) | 1156 (5.2) | 1545 (94.3) | 94 (5.7) | ||
| Overweight | 8635 (95.4) | 416 (4.6) | 677 (95.0) | 36 (5.0) | ||
| Obese | 3035 (95.2) | 153 (4.8) | 264 (96.0) | 11 (4.0) | ||
| Smoking during pregnancy | ||||||
| Yes | 2720 (91.2) | 261 (8.8) | <0.001 | 276 (91.7) | 25 (8.3) | 0.099 |
| No | 39 065 (94.7) | 2165 (5.3) | 4171 (94.0) | 264 (6.0) | ||
| Gestational diabetes | ||||||
| Yes | 973 (94.0) | 62 (6.0) | 0.484 | 38 (97.4) | 1 (2.6) | 0.347 |
| No | 40 798 (94.5) | 2369 (5.5) | 4417 (93.8) | 292 (6.2) | ||
| Maternal chronic hypertension | ||||||
| Yes | 76 (93.8) | 5 (6.2) | 0.759 | 2 (100) | 0 | 0.721 |
| No | 39 821 (94.6) | 2274 (5.4) | 4325 (94.0) | 276 (6.0) | ||
| Maternal chronic anaemia | ||||||
| Yes | 1398 (94.7) | 78 (5.3) | 0.716 | 209 (92.5) | 17 (7.5) | 0.392 |
| No | 40 413 (94.5) | 2354 (5.5) | 4251 (93.9) | 277 (6.1) | ||
NBW, normal birthweight; SD, standard deviation.
Multivariate results
Figure 3 and Supplementary Table S1 show associations between LBW and education, and LBW and age, by maternal origin (adjusting for gestational age, sex of the neonate, parity, maternal BMI and smoking during pregnancy). After adjustment, multivariate results confirmed bivariate results for the Lebanese; for Syrians, education lost its association with LBW. Among Lebanese women, the age-LBW association displayed a typical U-shaped pattern, with those in the youngest (<20) and oldest (≥35) age categories exhibiting the highest odds of delivering a LBW neonate (OR = 1.18; 95% CI = 0.88-1.60, and OR = 1.23; 95% CI = 1.02-1.50, respectively). Conversely, the age-LBW association among Syrian women did not display a clear pattern; interestingly, Syrian women in the ≥35 age category exhibited the lowest LBW odds compared with their 20–24-year-old counterparts (OR = 0.37; 95% CI = 0.14-0.96). Having secondary, intermediate and ≤ elementary education, compared with ≥university education, was associated with higher odds of giving birth to a LBW neonate among the Lebanese; as expected, the highest odds were for the ≤elementary education category (OR = 1.65; 95% CI =1.37-1.98). For Syrian women, the LBW-education association did not show the typical inverse association.
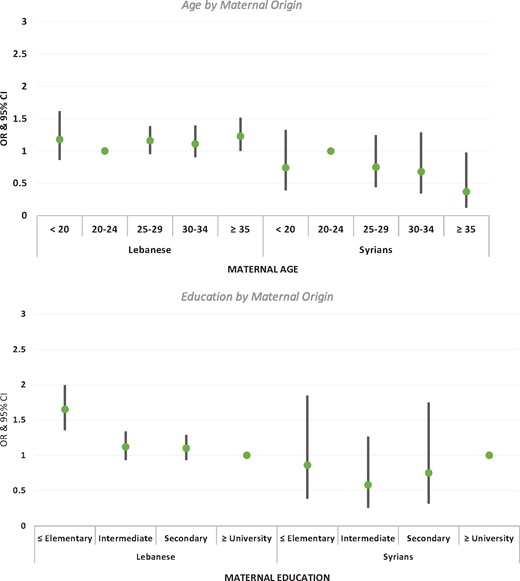
Adjusted odds ratios of LBW for maternal age and education by maternal origin (all analyses adjusted for gestational age, sex of the neonate, parity, maternal BMI, and smoking during pregnancy).
After adjusting for gestational age, sex of the neonate, parity, maternal BMI and smoking during pregnancy, Syrian women had 20% higher odds of delivering a LBW neonate compared with Lebanese women (OR = 1.20; 95% CI = 0.97-1.48) (Table 3). Maternal education showed a threshold association whereby the odds of delivering a LBW neonate were higher only for the lowest educated women (illiterate/elementary) compared with those with ≥university education (OR = 1.58; 95% CI = 1.33-1.88). Compared with neonates born to 25–29-year-old mothers, those born to mothers younger than 20 and 35 or older did not have higher odds of LBW.
Association between LBW and maternal origin, education and age in unadjusted and adjusted models (the following confounders were included in the adjusted model: gestational age, sex of the neonate, parity, maternal BMI and smoking during pregnancy)
| Unadjusted model | Adjusted model | |||||
|---|---|---|---|---|---|---|
| OR | 95% CI | P-value | OR | 95% CI | P-value | |
| Maternal origin | ||||||
| Lebanese | 1.0 | 1.0 | ||||
| Syrian | 1.12 | 0.99-1.27 | 0.060 | 1.20 | 0.97-1.48 | 0.097 |
| Maternal education | ||||||
| University+ | 1.0 | 1.0 | ||||
| Secondary/technical | 1.08 | 0.97-1.21 | 0.129 | 1.09 | 0.95-1.26 | 0.221 |
| Intermediate | 1.09 | 0.98-1.22 | 0.114 | 1.10 | 0.94-1.28 | 0.246 |
| Illiterate/elementary | 1.74 | 1.56-1.94 | <0.001 | 1.58 | 1.33-1.88 | <0.001 |
| Maternal age | ||||||
| 25-29 | 1.0 | 1.0 | ||||
| <20 | 1.40 | 1.18-1.65 | <0.001 | 1.01 | 0.77-1.31 | 0.968 |
| 20-24 | 1.04 | 0.93-1.16 | 0.457 | 0.93 | 0.79-1.31 | 0.355 |
| 30-34 | 1.01 | 0.91-1.12 | 0.829 | 0.95 | 0.82-1.10 | 0.516 |
| ≥35 | 1.09 | 0.97-1.23 | 0.142 | 1.03 | 0.88-1.22 | 0.680 |
Figure 4 and Supplementary Table S2 show the results of multivariate analyses testing the interaction between maternal origin and education, and maternal origin and age. Syrian women with ≥university education exhibited twice the odds of delivering a LBW neonate compared with Lebanese women (OR = 2.02; 95% CI = 0.98-4.16); otherwise, Syrian and Lebanese women in the three lower education categories had similar LBW odds. As to maternal age, only the 20–24-year-old Syrian women had higher LBW odds compared with 20–24-year-old Lebanese women (OR = 1.70; 95% CI = 1.22-2.36). Otherwise, Syrian women of all other age groups did not exhibit higher LBW odds compared with Lebanese women.
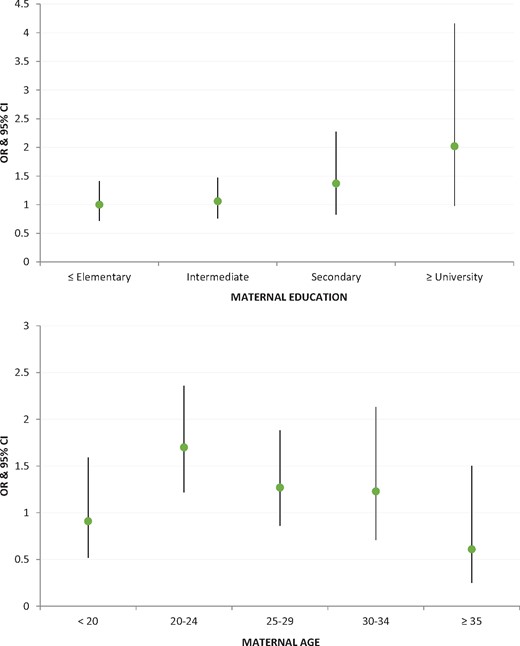
Adjusted odds ratios of LBW for Syrian relative to Lebanese neonates by maternal education and age (all analyses adjusted for gestational age, sex of the neonate, parity, maternal BMI and smoking during pregnancy).
Discussion
The Sustainable Development Goals call on states to protect all people who reside within their national borders irrespective of their citizenship status.46 With the rise of forced migration and the increasing number of refugees worldwide, systematic study of the birth outcomes of non-citizen women (including those who are forcibly displaced) should be an integral part of assessing maternal and child health in a given state. The large number of Syrian births in Lebanon highlights the need to systematically examine the social and health profile of Syrian mothers and their neonates, and to develop strategies to protect the maternal and neonatal health of this displaced population. The findings of our empirical study show that Syrian-origin women exhibit a clearly disadvantaged SES profile compared with Lebanese women. The younger age distribution is to be expected as early marriage, which leads to early pregnancy, was high in Syria before 201147 and has been reported to be much higher among Syrian refugee women compared with Lebanese women (27% versus 4%).48 The disadvantaged educational profile may reflect the fact that large segments of Syrians displaced into Lebanon since the onset of the crisis in 2011 came from historically neglected governorates and rural areas in Syria where females in particular had poor access to education.39
Given the dramatic increase in the number of Syrian births in Lebanese hospitals since 2011, it is safe to assume that the majority of Syrian-origin women in our study were forcibly displaced. They had experienced acute stress due to war and displacement, and continue to experience chronic stress as they live under strenuous socioeconomic conditions in Lebanon, particularly with respect to insecure and poor-quality housing.49 Whereas these conditions suggest that Syrian mothers would be more likely to give birth to a LBW neonate, our study findings show that the Syrian LBW rate is only marginally higher than the Lebanese rate, 6.2% compared with 5.6% (P = 0.059); it is also lower than the rate of 10% in Syria before the crisis.40 Maternal education and age do not associate with LBW for Syrians; in fact, having ≥university education and giving birth between 20 and 24 years of age were not protective. It is the most advantaged Syrian mothers (the 20–24=year=olds and those with ≥university education) who have higher LBW odds compared with Lebanese mothers of the same education and age groups.
Although our findings do not provide solid evidence in support of the epidemiological paradox, they are nonetheless provocative. The results that Syrian LBW is only marginally higher compared with Lebanese LBW and is lower than one would expect given Syrian mothers’ disadvantaged SES profile and exposure to war and forced migration, are unexpected and deserve further exploration. The international literature on the epidemiological paradox has provided two main hypotheses as to why some immigrant groups in high-income countries exhibit better birth outcomes compared with native-born populations–selective migration and attachment to origin culture.29 As the majority of Syrian-origin women are forced, not economic, migrants, the hypothesis that those who are healthier or who have more social resources and networks select to migrate, leaving the more vulnerable behind, does not provide a reasonable explanation in this case. Although we do not have data on social networks, the SES profile of Syrian mothers shows a clear disadvantage, with the majority (83.4%) having only intermediate education or less. Moreover, although Syrian culture may be more traditional than Lebanese culture, both share similar pro-natalist values that emphasize the role of women as mothers and invest in their well-being during pregnancy and childbirth.
Alternative explanations for our findings among forcibly displaced Syrian women deserve careful attention. It is plausible that the only marginally higher LBW among Syrian neonates, despite their mothers’ clearly disadvantaged SES, is due to access to health services during pregnancy. In particular, UNHCR’s coverage of four antenatal consultations may help identify and address LBW risks (e.g. fetal growth retardation due to inadequate nutrition). In Lebanon, Palestinian refugees show birth outcomes that are similar to those of citizens, and it has been argued that primary health care services provided by the United Nations Relief and Works Agency for Palestine Refugees (UNRWA) counter the deleterious impact of poverty and exclusion on maternal and newborn outcomes of this refugee group.50
Other explanations for our results focus on measurement, in light of evidence that LBW may not be the best outcome measure in refugee studies, as it is not sensitive enough to the deleterious effects of acute psychosocial stress due to war and forced migration. In a study that compared perinatal outcomes of refugees and non-refugees in Greece, the authors argued that stillbirth, a rare event, may be a more sensitive outcome in gauging the impact of displacement stress compared with LBW.51 Whereas we did not examine stillbirth, our results showed that the proportion of small-for-gestational-age was much higher among Syrian compared with Lebanese newborns. We suggest conducting further nuanced analyses to disentangle the different components of LBW (e.g. preterm and small-for-gestational-age), as has been done by Buekens and colleagues who found that lower LBW among Mexican Americans compared with non-Hispanic Whites in the USA was masked by a higher preterm birth rate.52
On the other hand, LBW is more sensitive to chronic than acute stress in non-conflict settings53; as such, it is still legitimate to use in a study among Syrian women, given the protracted nature of their displacement in Lebanon. In this case, acute stress due to war and displacement gave way to chronic stress as displaced Syrian women (and their families) continued to confront poverty, insecurity and the constant threat of eviction and deportation.54 These chronic stressors undoubtedly influence physiological processes during pregnancy.
Acknowledging the importance of considering outcome measurement and the differential impact of acute versus chronic stress, we argue that, in response to traumatic experiences—including oppression, violent conflict or forced migration—a community may devise a collective response to protect the well-being of its progeny to ensure survival. We draw on interpretations offered in some demographic research on fertility patterns, suggesting that populations who perceive themselves to be under threat may proactively maintain certain fertility patterns in order to improve their reproductive health outcomes. Geronimus,55 for example, argues that early fertility and childbearing among African American women in the USA is a collective response to weathering (rapid declines in health with age due to the chronic stress of structural racism). Khawaja and Randall, on the other hand, found that marriage and fertility increased during the first Palestinian Intifada of 1987 and suggested that this is ‘a response to political oppression and a perceived need to increase the number of Palestinians’.56 We propose that populations that experience war and its traumatic consequences may proactively over-invest in the well-being of pregnant women to optimize the health of the newborns. In the case of Syrian-origin women in Lebanon, the only marginally higher Syrian LBW, despite the clearly disadvantaged SES, may be an outcome of this collective response to protect the health of newborns as a way of recovering from loss and death.
As with all research that relies on secondary data, our study has both strengths and limitations. Using hospital-based records, one of the main strengths of our study is the availability of standardized, valid and almost complete data on LBW and other medical risk factors. On the other hand, one of the main limitations is the fact that maternal origin data were collected without attention to refugee status. Because the number of Syrian births in Lebanese hospitals increased 10-fold between 2011 and 2013, we feel confident in stating that the majority of Syrian-origin women in our sample were forcibly displaced to Lebanon after 2011; however, we cannot confirm the exact proportion. Despite this limitation, the study makes a significant contribution to the literature on the birth outcomes of refugees. It is the first to test the epidemiological paradox among a displaced population in a middle-income country. Although the results do not show strong evidence for the paradox, they nonetheless highlight that, despite the disadvantaged SES profile of Syrian mothers and the acute and chronic stress they experience, Syrian LBW is only marginally higher compared with Lebanese LBW. Future studies on this group and others in the Middle East region, which hosts one of the largest refugee populations in the world, stand to contribute to the international literature on birth outcomes of immigrants and refugees.
Funding
Throughout the conceptualization and write-up of the manuscript, S.A. and Z.B. were supported by a grant from the International Development Research Center-Canada. Data collection, management and analysis for this manuscript were funded by the ‘Maymouna Suad Sawwaf Research Fund’.
Conflict of interest: None declared.
References
United Nations. Sustainable Development Goals: 17 Goals to Transform Our World.
World Health Organization.
UNICEF & WHO.
World Health Organization.
World Bank. World Bank Open Data.
UNHCR. Syria Regional Refugee Response: Inter-Agency Information Sharing Portal.
United Nations Children's Fund. Syrian Arab Republic Multiple Indicator Cluster Survey 2006. Central Bureau of Statistics, Pan-Arab Project for Family Health/League of Arab States, United Nations Children's Fund;
United Nations High Commissioner for Refugee. Health access and utilization survey among Syrian refugees in Lebanon.
Save the Children.
Government of Lebanon, UN Resident and Humanitarian Coordinator for Lebanon.
United Nations High Commissioner for Refugees (UNHCR) & United Nations Human Settlements Programme (UN-Habitat). Housing, Land & Property Issues in Lebanon: Implications of the Syrian Refugee Crisis. Geneva: UNHCR,
Human Rights Watch. Our Homes Are Not for Strangers. Mass Evictions of Syrian Refugees by Lebanese Municipalities,
Author notes
Senior author.

