


Abstract
Aircraft anti-icers and pavement deicers improve the safety of airport operations during winter precipitation events. Runoff containing these products can contribute elevated biochemical oxygen demand (BOD) to receiving streams. We monitored runoff from Milwaukee Mitchell International Airport at one upstream site, three outfall sites, and one downstream site from 2005 to 2022 for BOD, chemical oxygen demand (COD), and freezing point depressants used in deicing and anti-icing fluids to determine the primary sources of BOD and COD in the receiving stream. The greatest concentrations of BOD, COD, and freezing point depressants occurred at the primary outfall, which drains the main terminal area, and the secondary outfall, which drains cargo operations. The greatest loadings occurred at the primary outfall; loadings were an order of magnitude less at the secondary outfall due to a small drainage area with relatively low flow volumes. At the three outfalls, median concentrations of five-day BOD (BOD5) and COD were 100–1,300 mg L−1 and 200–2,100 mg L−1 respectively. Apportionment computations indicated that propylene glycol from aircraft deicers and anti-icers was responsible for at least half of the BOD5 and COD concentrations and loadings. Acetate from pavement deicers contributed another 7%–15% at each site. These findings suggest that management actions in the primary outfall drainage area that target propylene glycol–containing deicers have the greatest potential to decrease BOD5 in airport runoff. This work demonstrates the usefulness of BOD and COD apportionment for identifying the deicing products and locations within an airport to prioritize for reduction or recovery and treatment.
Introduction
Winter precipitation events pose safety risks at airports; ice and snow can obstruct runways and accumulate on aircraft surfaces. To maintain safe operations, airports and airlines apply deicing and anti-icing products (hereafter, referred to as deicing products) to pavement and aircraft surfaces that melt ice and snow at temperatures below freezing. Airports face several challenges in managing runoff containing deicing products. Because aircraft are sensitive to corrosion from chloride salts typically used as a freezing point depressant on roads (Federal Aviation Administration, 2020), airports use alternative freezing point depressants, including but not limited to propylene glycol- and ethylene glycol-based formulations for aircraft and acetate- and formate-based organic salts for pavement. These low-molecular-weight organic compounds are degraded rapidly by heterotrophic microorganisms in the environment. However, rapid degradation of freezing point depressants used in deicing products exerts substantial oxygen demand, leading to concerns about potential depletion of oxygen in soils and waters receiving runoff from deicing operations. Deicing products also contain a variety of proprietary additives to increase viscosity, inhibit corrosion, and reduce surface tension, leading to concerns about potential toxicity (Corsi et al., 2006; Ferguson et al., 2008; Hartwell et al., 1995). To address these concerns, airports are required to take measures to manage impacts of deicing products in runoff to adjacent streams (U.S. Environmental Protection Agency, 2012).
Airport deicing products are categorized into aircraft deicers or anti-icers and pavement deicers. Aircraft deicers and anti-icers are fluids applied directly to aircraft to remove ice and prevent additional ice accumulation on aircraft prior to and during takeoff. Aircraft deicers are sometimes heated prior to application to aid in snow and ice removal. Pavement deicers are applied to runways and other paved surfaces in liquid form as potassium acetate or potassium formate or in solid form as sodium acetate or sodium formate (Corsi et al., 2009). Liquid pavement deicers help melt snow and ice present on runways and other paved areas as well as act as a pretreatment to prevent adhesion of ice to pavement. Solid pavement deicers are primarily used to melt ice and are generally followed by application of liquid pavement deicers to maintain ice-free surfaces (Switzenbaum et al., 2001). During snowfall and freezing rain events, deicer containment becomes one of many logistical problems airports are balancing simultaneously. Airports expend substantial efforts to contain and collect aircraft deicers and anti-icers for eventual treatment or recycling, but given the frequently stormy weather conditions and potentially large areas over which they are applied, portions of spent deicer products often reach receiving waters through various routes (Freeman et al., 2015). Of the product that is not contained, some infiltrates soil through cracks or over the sides of pavement, some flows to storm drains before recovery efforts can collect it, some is transported and lost while taxiing, and the remainder is sheared off the aircraft during takeoff. Pavement deicers are comparatively difficult to contain because they are applied widely to taxiways and runways, in addition to terminal areas, where many airports focus their deicer recovery efforts.
Several decades of research have sought to understand how to best address environmental impacts of aircraft deicers (Betts, 1999; Schulz & Comerton, 1974; Shi et al., 2017; Sulej-Suchomska et al., 2024; Switzenbaum et al., 2001). These efforts have yielded changes including but not limited to shifts in freezing point depressants used in pavement deicers (phase out of urea, exploration of agrochemicals), shifts in performance-enhancing chemicals in deicers, technological advances in high efficiency application of aircraft deicers, and construction of treatment wetland systems and anaerobic flow through reactors that can handle intermittent high biochemical oxygen demand (BOD) waste at low temperatures (Fay & Shi, 2012; Freeman et al., 2015; Olds et al., 2022; Switzenbaum et al., 2001; Turnbull & Bevan, 1995). The effectiveness of strategies to mitigate deicer impacts is unique to each airport, depending on factors like airport size, winter climate, operating and funding constraints, and other site-specific characteristics (ACRP, 2009). When creating a deicer management strategy, airport managers typically first quantify deicer collection versus release in stormwater, then explore and evaluate potential strategies, including source reduction, containment, and treatment. This process can be impeded by a lack of information on dominant deicers in runoff (aircraft deicers compared with pavement deicers) and how this varies spatially across the airport. For example, aircraft deicers are applied in relatively concentrated locations at terminals, whereas pavement deicers are applied broadly to cover runways. Runoff from both types of deicers is mixed on the pavement and in storm drain systems, and both are contributors to five-day BOD (BOD5) and chemical oxygen demand (COD). If aircraft deicers contribute most to runoff, management strategies could focus on collection and treatment designed for glycol-rich waste, whereas if pavement deicers contribute the majority, strategies could prioritize source reduction or on-site treatment approaches, including green infrastructure, to treat runoff (Shi et al., 2017; Sulej-Suchomska et al., 2024). Insufficient monitoring data at most airports is a challenge to understanding which deicer formulations contribute the greatest impacts to airport runoff. Although freezing point depressants of aircraft deicers (primarily propylene glycol and ethylene glycol), BOD5, and COD are commonly monitored, freezing point depressant components of pavement deicers (acetate, formate, and potassium) are not commonly monitored. Monitoring of all these deicer product components is necessary to determine the proportion of BOD5 and COD that is contributed by each deicer type and to inform management of deicer-recovery operations.
In this study, we investigate the contributions of four freezing point depressants (propylene glycol, ethylene glycol, acetate, and formate) to BOD5 and COD in five sites adjacent to or downstream from Milwaukee Mitchell International Airport (MKE) in Milwaukee, WI, United States. Each freezing point depressant contributes a specific BOD5 and COD per unit mass, and certain freezing point depressants are applied to pavement whereas others are applied to aircraft. Apportioning BOD5 and COD to freezing point depressants provides a chemical signature for each site showing which deicers contributed most to elevated oxygen demand. This apportionment approach can inform how airports prioritize management strategies for specific products and locations.
Methods
Study area
The MKE covers 2,386 acres and supported 70,000–220,000 flights annually during the time period of this study (2005–2022), including air carrier, military, and general passenger flights (Airport Information, 2024). Sampling took place at five locations within or adjacent to MKE: Wilson Park Creek Infall to MKE (infall), three outfall sites (primary, secondary, and tertiary), and one receiving stream site (receiving, Figure 1, Table 1). The infall is located upstream from most airport operations; however, airport runoff occasionally enters this site due to its proximity to an Air National Guard base and a section of runway. The primary outfall is the largest discharge of runoff influenced by airport terminal operations and enters Wilson Park Creek. The secondary outfall drains a small area mainly dedicated to cargo operations into the Holmes Avenue Creek tributary to Wilson Park Creek. The receiving stream site is 5.5 km downstream from the airport and just upstream from the confluence of Wilson Park Creek and the Kinnickinnic River. The tertiary outfall is located on the opposite side of the airport from the primary and secondary outfalls, and primarily drains runways but not aircraft application zones. Runoff from this site enters a tributary of Oak Creek.
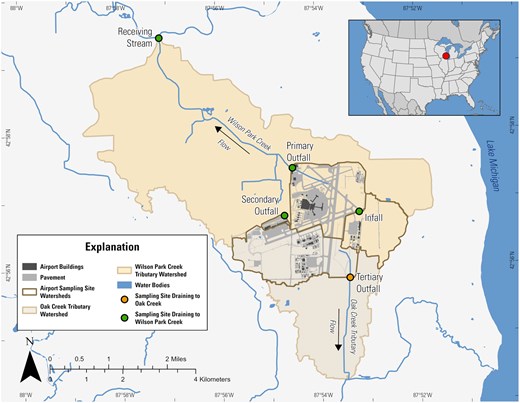
Site map showing the five sites monitored in or near Milwaukee Mitchell International Airport in Milwaukee, WI; drainage areas to each site; and areas of pavement within the airport.
Identifiers and characteristics for the five monitoring sites in or near Milwaukee Mitchell International Airport (MKE) in Milwaukee, WI.
| Site name | USGS site ID | Site location | Characteristics |
|---|---|---|---|
| Infall | 40871473 | Wilson Park Creek at MKE infall | Upstream of most airport runoff |
| Primary outfall | 40871475 | Wilson Park Creek at MKE outfall #7 | Outfall encompassing main terminal |
| Secondary outfall | 40871476 | Holmes Ave Creek tributary at MKE outfall #1 | Outfall encompassing cargo area |
| Receiving stream | 40871488 | Wilson Park Creek at St. Luke's Hospital | Downstream of the airport 6 km |
| Tertiary outfall | 40872015 | Oak Creek tributary at MKE outfall #3 | Outfall that drains southern runways and taxiways |
Sample collection
Samples used in this study (n = 249) were collected from 2005 to 2022, including 32 at the infall site, 72 at the primary outfall, 56 at the secondary outfall, 31 at the tertiary outfall, and 58 at the receiving stream site (see online supplementary material Table S1). An average of four winter precipitation events were sampled each year and were coordinated with airport personnel to ensure that sampling occurred during time periods of significant deicing operations. The methods for sample collection have been described elsewhere (Corsi et al., 2001, 2009) but will be briefly summarized here. Flow-weighted samples were collected during winter precipitation events using a refrigerated automatic sampler (Teledyne ISCO, Lincoln, NE). Water was pumped from the stream at each site through Teflon-lined tubing into refrigerated bottles. Bottles were retrieved within three days of sampling and analyzed for BOD, COD, propylene glycol, ethylene glycol, acetate, and formate. The tertiary outfall did not have an autosampler, so all samples were collected manually by dipping triple-rinsed polypropylene bottles in the center of the stream. The tertiary outfall was not instrumented for discharge either, but the other four sites were instrumented with bubbler-type pressure transducers (Sutron Accubar, Sutron Corporation, Sterling, VA) to measure changes in water level. Discharge at the four sites (infall, primary, secondary, and receiving) were then calculated from water stage (Rantz, 1982).
Sample analysis
All samples were analyzed at the Wisconsin State Laboratory of Hygiene (Madison, WI). Traditional BOD5 was analyzed using method 5210B in Standard Methods for the Examination of Water and Wastewater (Bridgewater et al., 2017). The COD was analyzed using method ASTM D1252-06B (American Society for Testing and Materials International, 1993). Propylene glycol and ethylene glycol concentrations were quantified with gas chromatography according to U.S. Environmental Protection Agency (USEPA) method 8015C (U.S. Environmental Protection Agency, 2007). Acetate and formate concentrations were quantified with ion chromatography using a DIONEX AS15 separator column and AG15 guard column (Corsi et al., 2009). Quality assurance included field blanks (See online supplementary material Table S2), as well as laboratory duplicates, and matrix spike recoveries. Of 57 lab blanks analyzed, 19 had detections of BOD, COD, ethylene glycol, or propylene glycol. Detections of BOD (n = 4) ranged from 2 to 6.5 mg L−1 whereas detections of COD (n = 11) ranged from 8.5 to 63 mg L−1 but were mostly less than 20 mg L−1. Ethylene glycol and propylene glycol were detected twice each and always 20 mg L−1 or less. Concentrations of these blank detections are not great enough to be considered to have an impact on study results. Duplicates met laboratory quality control limits 0%–30% relative SD for propylene glycol and ethylene glycol, 0%–15% for acetate and formate, 0%–20% for COD, and 0%–25% for BOD. Matrix spike recoveries met laboratory quality control limits and fell within 70%–130% for propylene glycol, ethylene glycol, acetate, and formate and within 85%–115% for BOD5 and COD.
Data analysis
Water chemistry data and flow used in analysis are available through the U.S. Geological Survey National Water Information System (U.S. Geological Survey, 2024). Water chemistry data are also provided in the supporting information for convenience (See online supplementary material Table S1). All subsequently described calculations were performed on BOD5 and COD data but are illustrated through discussion of BOD5 alone hereafter. Apportionment of BOD5 used laboratory-determined BOD5 of each freezing point depressant as pure substance (Corsi et al., 2012). The quantified BOD5 of propylene glycol differed slightly for aircraft deicing product formulations (Type I vs. Type IV), so an average BOD5 of the two formulations was used for the current study (Table 2). For each site and precipitation event, the concentrations of freezing point depressants in runoff were multiplied by the corresponding freezing point depressant BOD5 values to estimate BOD5 in water samples originating from each compound. The BOD was apportioned to four freezing point depressants and an additional source category for other BOD-containing compounds present in streams. Apportionment of BOD5 to other sources was calculated by subtracting the sum of BOD5 apportioned to the four freezing point depressants from the total measured BOD5. The percentage of BOD5 contributed by each compound was calculated by normalizing each compound’s apportioned BOD5 to the total measured BOD5. Event loads of oxygen demand were calculated by multiplying the flow-weighted BOD5 and COD concentrations by total event runoff. Results were aggregated over time.
Five-day biochemical oxygen demand (BOD5) and chemical oxygen demand (COD) for ethylene glycol and propylene glycol were determined for both Type I and Type IV anti-icer formulations in Corsi et al. (2012); values presented here are an average of the two. Acetate BOD5 and COD were determined for both liquid potassium acetate and solid sodium acetate pavement deicers in Corsi et al. (2012); values presented here are an average of the two. —, BOD5 results were not reliable for sodium formate.
| Freezing point depressant | Typical application | COD (mg/L) | BOD5 (mg/L) |
|---|---|---|---|
| Ethylene glycol | Aircraft | 1,285,000 | 526,000 |
| Propylene glycol | Aircraft | 1,645,000 | 1,105,000 |
| Acetate | Pavement | 1,030,000 | 823,500 |
| Formate | Pavement | 373,000 | — |
| Freezing point depressant | Typical application | COD (mg/L) | BOD5 (mg/L) |
|---|---|---|---|
| Ethylene glycol | Aircraft | 1,285,000 | 526,000 |
| Propylene glycol | Aircraft | 1,645,000 | 1,105,000 |
| Acetate | Pavement | 1,030,000 | 823,500 |
| Formate | Pavement | 373,000 | — |
Approximately 30% of measurements were censored, primarily because concentrations of compounds were below detection limits. Over 80% of ethylene glycol and formate samples were left-censored, which precluded using censored estimation techniques in summarizing concentrations (Helsel, 2012). Instead, left-censored values were reported at the detection limit. Fifteen BOD5 results were right-censored, so we used the relationship between COD and BOD5 to estimate BOD5 in these samples (See online supplementary material Figure S1). However, when computing apportionment, samples with censored BOD5 and COD (n = 30, n = 1, respectively) were excluded. Additionally, we required that all four freezing point depressants were collected and analyzed, and at least one freezing point depressant was detected per site sample. Most samples with censored BOD5 or COD had detectable freezing point depressant concentrations, but concentrations typically were low. Freezing point depressants below detection limits were set to zero under the assumption that their contribution to BOD5 and COD was negligible. In cases when the sum of apportioned BOD5 from freezing point depressants exceeded measured BOD5, the value of “other” sources of BOD5 would be negative. In these cases, we instead set the values to zero to represent the negligible influence of other compounds on stream BOD5. For event loads, right-censored BOD5 were estimated from COD whereas left-censored BOD5 and COD were set to the detection limit. Using the detection limit for left-censored values biases the summarized concentrations and loads high; the supporting information provides a more detailed comparison of concentrations and loads with left-censored data reported as zero and as the detection limit to show how the summaries are influenced by using the highest and lowest potential values for left-censored data (See online supplementary material Table S3).
We tested for differences in concentrations, apportioned BOD5 and COD, and loads by site and by freezing point depressant using Dunn’s test, which is a rank sum approach that compares the medians of two or more groups and identifies which, if any, medians are different (Dunn, 1964). Data were analyzed using the Dunn.test R package and reported differences were evaluated at 5% significance level (Dinno, 2024).
Results
Concentrations
Median concentrations of deicer-related parameters BOD5, COD, and propylene glycol were greater in samples from the primary and secondary outfalls than the other three sites (p < .05, Figure 2). Concentrations of all deicer-related parameters were lower in samples from infall than the primary and secondary outfalls (p < .05, Figure 2) but were not significantly different from concentrations at the receiving stream site and the tertiary outfall (p > .05). Median concentrations of acetate were greatest in samples from airport outfall sites (primary, secondary, and tertiary outfalls), followed by samples from the receiving stream, and lowest in samples from the infall (p < .05). Ethylene glycol and formate were not commonly used at MKE during the study period and samples for these parameters resulted in lower concentrations than other deicer-related parameters.
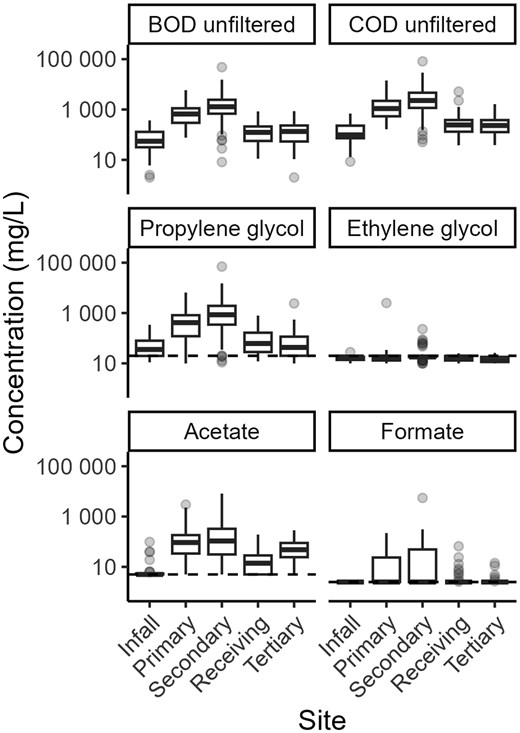
Concentrations of five-day biochemical oxygen demand (BOD5), chemical oxygen demand (COD), and freezing point depressants used at Milwaukee Mitchell International Airport from 2005 to 2022. The sample size for each site is as follows: infall, n = 25; primary outfall, n = 63; secondary outfall, n = 43; receiving stream, n = 51; tertiary outfall, n = 27. Horizontal dashed lines indicate the most common detection limit for each parameter (propylene glycol, 20 mg L−1; ethylene glycol, 20 mg L−1; acetate, 5 mg L−1; formate, 2.5 mg L−1). Censored measurements are included as the detection limit. Boxes, 25th to 75th percentiles; dark line, median; whiskers, data within 1.5 times the interquartile range (IQR); circles, values outside 1.5 times the IQR.
Apportionment of BOD5 and COD to freezing point depressants
At all sites, propylene glycol was the freezing point depressant that contributed most to BOD5 and COD concentrations, contributing a median of 68% of measured BOD5 across all sites for BOD5 and 50% for COD (p < .05; Figure 3). Ethylene glycol and formate contributed little to no BOD5 and COD concentrations. Acetate and other sources contributed medians of 10%–15% each for BOD5. Acetate contributed a median of 7% to COD concentrations whereas other sources contributed a median of 33%.
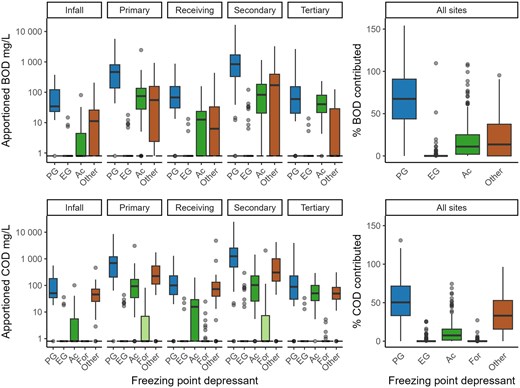
Estimated five-day biochemical oxygen demand (BOD5) and chemical oxygen demand (COD) concentrations attributed to aircraft and pavement deicer freezing point depressants (FPDs) in samples from monitoring sites near Milwaukee Mitchell International Airport, 2005–2022, and percent of measured BOD5 and COD concentrations. The contribution of non-FPD (“other”) compounds at each site was calculated by subtracting the sum of BOD5 or COD contributed by all FPDs from the measured BOD5 or COD. The dashed line represents values that were not detected and are assumed to be zero. If other contributions to BOD5 or COD were negative, these values were set to zero to represent their minimal influence to BOD5 and COD. Formate was not included in estimates for BOD5 because toxicity to bacteria in the formate-containing product prevented measurements of BOD5. The number of samples apportioned for each site were as follows: infall, n = 25; primary outfall, n = 63; secondary outfall, n = 43; receiving stream, n = 51; tertiary outfall, n = 27. Two outliers for % COD contributed and 11 outliers for % BOD5 contributed (greater than 150%) were included in boxplot calculations but were excluded by scale limits to provide easier interpretation of most of the data. PG = propylene glycol; EG = ethylene glycol; Ac = acetate; For = formate. Boxes, 25th to 75th percentiles; dark line, median; whiskers, data within 1.5 times the interquartile range (IQR); circles, values outside 1.5× the IQR.
Median contribution of acetate to BOD5 concentration was negligible at the infall; 7%–14% at the primary outfall, secondary outfall, and receiving stream; and about 42% at the tertiary outfall (p < .05, Figure 3). The COD concentration apportionment indicated less contribution by acetate at the tertiary outfall with only 17% estimated from acetate; however, acetate’s contribution to COD concentration at the tertiary outfall was still 2–3 times higher than its contribution at the primary outfall, secondary outfall, and receiving stream (p < .05).
In most samples, only acetate and propylene glycol were detected and used in apportionment. Only 20 samples used three freezing point depressants in apportionment for BOD5 and COD, and only three samples used all four freezing point depressants in apportionment for COD. Formate was not included in source apportionment for BOD5 because BOD5 values were not available for pure formate due to toxicity of formate to the inoculum used in laboratory testing for determination of BOD5 (Corsi et al., 2012). In addition, formate had very little contribution to COD with median concentrations below the detection limit. Likewise, ethylene glycol occasionally contributed to BOD5 and COD, but given that the median concentration was below the detection level, contributions were not considered to be consequential. The remaining BOD5 and COD was attributed to sources other than deicer components and was estimated to be 0%–25% for BOD5 and 30%–40% for COD. The sum of apportioned BOD5 and COD by freezing point depressant was greater than measured BOD5 and COD in 35% and 9% of samples, respectively, highlighting the cumulative uncertainties in measurement of the freezing point depressant concentrations as well as BOD5 and COD.
Event loadings
The BOD5 and COD loads were calculated for each sampling event (Figure 4). The tertiary outfall was not instrumented for runoff, so load computation was not possible for that site. The BOD5 and COD loads were greatest at the primary outfall and the receiving stream and were about two orders of magnitude lower at the infall and secondary outfall (p < .05). Low loads at the secondary outfall were primarily due to the small catchment area and substantially lower runoff (p < .05) at this site compared with others. The summation of loads from the primary and secondary outfalls was not significantly different than loads at the receiving stream for BOD5 and COD.
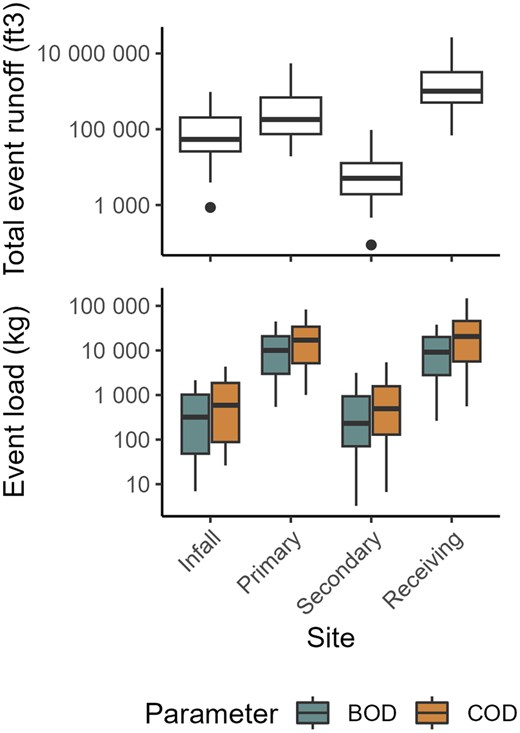
Total event runoff (ft3) and estimated loads (kg) of five-day biochemical oxygen demand (BOD5) and chemical oxygen demand (COD) sampled during precipitation events at four sites near Milwaukee Mitchell International Airport, 2005–2022. Data were not available for the tertiary outfall because runoff was not measured at this site. Boxes, 25th to 75th percentiles; dark line, median; whiskers, data within 1.5 times the interquartile range (IQR); circles, values outside 1.5 times the IQR.
Discussion
Propylene glycol contributed more BOD5 and COD to runoff than any other freezing point depressant. Acetate’s contribution to BOD5 and COD was of similar magnitude to propylene glycol at the tertiary outfall, but otherwise was 5–10 times lower at the rest of the sites and usually lower than the “other” sources attributed to compounds that are not identified as freezing point depressants. The low contribution of acetate compared to propylene glycol was noteworthy because propylene glycol is typically applied to aircraft in areas that have opportunity for recovery at the site of application, whereas acetate is used as a pavement deicer on runways and is not practical to recover at MKE. However, the finding that propylene glycol contributes the majority of BOD5 and COD to runoff is consistent with a past study at five airports in the northeastern United States, which found 56%–113% COD from glycol (Schoenberg et al., 1999).
The distribution of freezing point depressants among sites was consistent with each site’s location in relation to airport deicing operations. The lowest BOD5, COD, and freezing point depressant concentrations were observed at the infall. This site is not a true upstream control site because it is adjacent to an Air National Guard base that occasionally uses deicing products. In addition, a small section of runway drains to the channel upstream from the infall. As such, propylene glycol was sometimes detected in water entering the airport. Samples from the primary and secondary outfalls consistently had the greatest concentrations of freezing point depressants, BOD5, and COD. A major difference between these two sites is the amount of runoff exiting into receiving streams; despite the secondary outfall’s high concentrations of freezing point depressants and BOD5, this site drains a small area and loads of BOD5 and COD from this site were not significantly higher than loads entering the airport from the infall. In contrast, loads of BOD5 and COD from the primary outfall were approximately 100 times greater than loads coming from the infall. Flowing to the south as a tributary to Oak Creek, the tertiary outfall primarily drains runways that receive some residual aircraft deicers while taxiing and during takeoff and drainage from pavement deicing operations. During the study duration, there were occasional periods when aircraft were deiced within the watershed draining to the tertiary outfall, but this was not common practice. Accordingly, acetate’s contribution to BOD5 was relatively greater and propylene glycol’s contribution was relatively lower compared to the primary and secondary outfalls.
Downstream of the primary and secondary outfalls, samples from the receiving stream had lower BOD5, COD, and freezing point depressant concentrations, but BOD5 and COD loads were of similar order of magnitude to the sum of the primary and secondary outfalls, which both contribute to the receiving stream (Figure 1). The decrease in concentrations was a result of dilution by runoff from the urban areas of Wilson Park Creek downstream from MKE. A lack of decreased loading in the receiving stream compared with the summation of the primary and secondary outfalls indicated that there was little or no degradation of freezing point depressants during transport from outfalls to the downstream site and this finding is consistent with past research in this stream system that observed no correlation between BOD5 and dissolved oxygen (Corsi et al., 2001). This decoupling of BOD5 and dissolved oxygen is likely a result of cold temperatures reducing the activity of microorganisms that metabolize the freezing point depressants (Corsi et al., 2012), short travel times from MKE to the receiving stream site, which are commonly less than 12 hr (Nott et al., 2017), and relatively high reaeration rates (Corsi et al., 2001). However, a positive correlation between deicer-induced COD and the abundance of filamentous heterotrophic biofilms was demonstrated in this receiving stream (Nott et al., 2020). Excessive growth of filamentous biofilms is stimulated by organic-rich wastewater and can degrade streams by coating streambeds. Although deicers in runoff do not substantially deplete stream dissolved oxygen in this system, high biofilm volumes during winter months indicate impacts to biological processes.
Our approach assumed that the difference between the sum of apportioned BOD5 and the measured BOD5 represented other sources of BOD5 in the stream, including naturally derived organic matter and degradation products from glycol-based deicers. Propylene glycol can decompose to several products, depending on whether degradation occurs under aerobic or anaerobic conditions, including lactic acid, pyruvic acid, n-propanol, propionate, and acetate (Seok & Komisar, 2003; Switzenbaum et al., 2001). Additionally, ethylene glycol degradation can form acetaldehyde, ethanol, and acetate (Dwyer & Tiedje, 1983). These degradation products contribute oxygen demand of a similar order of magnitude to the freezing point depressants discussed in this article (Heukelekian & Rand, 1955). Estimating BOD5 and COD from concentrations of freezing point depressants may actually underestimate BOD5 and COD from glycol-based aircraft deicers because most degradation products are not accounted for in apportionment. Contributions from acetate-based pavement deicers could be overestimated because acetate is one degradation product of glycols. These caveats do not change the conclusion of this study, because evidence suggests that propylene glycol currently contributes substantially more to BOD5 and COD in runoff than acetate, but apportionment at other airports may consider how degradation products may bias findings.
Despite the omission of degradation products in apportionment, the sum of apportioned BOD5 and COD exceeded measured BOD5 and COD for some sampling time points in this study. The overestimation of BOD and COD from apportionment in a few samples is likely from error compounding through each step of apportionment. Analytical uncertainty exists at three major steps of apportionment: in quantification of concentrations of freezing point depressants in runoff, in quantification of BOD5 and COD measurements in runoff, and in the determination of BOD5 and COD of each freezing point depressant. We described the analytical laboratory’s acceptable bounds of uncertainty for each freezing point depressant concentration and BOD5 and COD tests in the methods (see Sample analysis section) and we describe further here how those uncertainties are likely to affect the apportionment results. First, analytical uncertainty compounds with the number of freezing point depressants used in apportionment, but in most events sampled for this study, only propylene glycol and acetate were detected. Propylene glycol measurements had the highest acceptable relative SD for duplicates and matrix spike recoveries, indicating that it may be the largest source of uncertainty in apportionment. Second, the analyte with the next highest analytical uncertainty is BOD5; correspondingly, apportioned BOD5 exceeded measured BOD5 more frequently (33%) than apportioned COD exceeded measured COD (9%) despite using the same freezing point depressant concentrations in apportionment. COD analysis uses a strong oxidant to oxidize organic matter completely whereas BOD5 analysis relies on microorganism metabolism and does not consume organic matter entirely, which typically introduces greater variability in the latter measurement (Corsi et al., 2012). Apportionment may have less uncertainty when using COD compared with BOD5, but there is a tight correlation between the two measurements in runoff samples from MKE (See online supplementary materialFigure 1) and we observed similar conclusions about which products contributed most to oxygen demand using both types of oxygen demand measurements. Finally, the BOD5 and COD of each freezing point depressant was previously determined by the same analytical laboratory used in this study (Corsi et al., 2012). Additionally, these values fell within the ranges reported previously for BOD5 and COD of freezing point depressants, lending additional confidence to these values (Switzenbaum et al., 2001; U.S. Environmental Protection Agency, 2000).
Many samples contained censored values for concentrations of freezing point depressants and BOD5. The predominance of censored values means that methods to handle censored values can vary the apportioned BOD5 and COD estimates substantially. We chose to set censored values for concentrations of freezing point depressants to zero in apportioning BOD5 and COD. This assumption may result in underestimating contributions from freezing point depressants, especially ethylene glycol and formate that were frequently not detected. However, given that in many cases, the sum of apportioned BOD5 exceeded measured BOD5, the assumption that censored values are near zero seems more likely than assuming censored values are near detection limits. For example, ethylene glycol has a detection limit of 20 mg L−1; if censored values were assumed to be at the detection limit, each censored value would contribute an estimated 10.5 mg L−1 BOD5. For reference, samples taken in August 2013 at all sites (to represent stream BOD5 during seasons in which deicers are not applied) were below 10 mg L−1 BOD5. Additionally, freezing point depressants have different detection limits, so setting censored values to detection limits or proportional to detection limits would overestimate glycols (20 mg L−1) relative to acetate and formate (5 mg L−1, 2.5 mg L−1).
Despite some nuance required in apportioning BOD5 and COD to freezing point depressants, this approach provided quantitative insight into which specific deicer products contributed to downstream oxygen demand and how that varied across an airport by drainage and deicer practices. Further, because propylene glycol is the most likely contributor to deicer degradation products that contribute BOD5, reduction in propylene glycol application or increased glycol recovery may also lower the concentrations of BOD5 from what has been defined here as other sources beyond the freezing point depressants quantified in this study. Beyond impacts on oxygen demand, identification of the portion of contributions from propylene glycol and acetate are important because most formulated glycol-based deicers and anti-icers contain additives that have high toxicity to aquatic organisms (Cancilla et al., 2003; Pillard, 1995; Pillard & DuFresne, 1999), whereas toxicity of acetate-based deicers stems primarily from acetate (Corsi et al., 2009).
For MKE, this apportionment exercise indicated that the greatest oxygen demand loading was contributed from the primary outfall drainage area. Secondary outfall’s BOD5 and COD loadings were far less than loadings at the primary outfall due to secondary outfall’s relatively smaller drainage area and corresponding lower flow. The high concentrations and small drainage area of the secondary outfall may be an opportunity for efficient capture of spent deicers, but to reduce the overall loading of oxygen demand from MKE to receiving streams, the most substantial reductions would likely need to be achieved from the primary outfall drainage area.
Future deicer management planning may benefit from consideration of the magnitude of BOD5 and COD loading at each site compared with the effort needed to capture a larger percentage of spent deicers. Currently, the infrastructure for recovering spent deicers at MKE includes deicing pads and glycol recovery vehicles. Deicing pads are specified areas where pavement is contoured for drainage to a location with underground storage where runoff is collected and eventually transported to a wastewater treatment facility (Switzenbaum et al., 2001). Glycol recovery vehicles are vehicles that use high-powered suction to collect spent deicers in areas where deicing activities occur outside of deicing pads (Switzenbaum et al., 2001). Spent deicers are then shipped to nearby waste treatment facilities. Some airports have tested on-site treatment options, including anaerobic fluidized reactor beds, lagoons, and constructed treatment wetlands (Adeola et al., 2009; Branchu et al., 2014; Higgins et al., 2011; Shi et al., 2017). Finding available space to place these facilities is a major challenge with on-site treatment. Some on-site treatment options, particularly treatment lagoons or wetlands, also have to overcome low removal rates at the low operating temperatures and increased chances of aircraft collisions with birds. Airports can avoid these challenges and the capital investments of constructing on-site facilities by shipping waste to nearby waste treatment facilities, but the high BOD of airport runoff requires intensive treatment and is therefore also costly. When weighing these management options, airports could also consider how changing precipitation patterns under climate change are likely to affect the magnitude and type of winter precipitation an airport will need to handle. For example, Milwaukee has experienced a 20% increase in winter precipitation from 1950 to 2020 and is predicted to have an additional 10% increase by 2050 (Wisconsin Initiative on Climate Change Impacts, 2021). Greater amounts of freezing rain may require different management strategies than snowstorms of the past few decades. Some tools have been developed to help airports navigate planning infrastructure and operations, including deicing activities, for future climate scenarios (ACRP Report 147, 2015).
Although our findings are specific to MKE, BOD5 apportionment is a viable exercise at any airport that monitors concentrations of BOD5, COD, and freezing point depressants in runoff. A study from five airports in the northeastern United States that quantified BOD5, COD, glycol concentrations, and percentage of COD from glycols found that glycol contributed nearly all of the COD at all five airports (Schoenberg et al., 1999). At the time of this study, we are not aware of other apportionment analyses performed on deicers at airports, but a similar concept is used in modeling the contributions of land cover/land use to freshwater BOD5 at continental scales (e.g., Vigiak et al., 2019). In addition to better understanding sources of BOD and COD, apportionment can provide insight into the types of products that are released into runoff and the associated environmental impacts that might accompany the oxygen demand impacts in receiving waters, such as toxicity or phosphorus loading from additives (Corsi et al., 2009; Pillard, 1995; Stefaniak et al., 2023).
Conclusion
Considering 2005–2022 data, propylene glycol was the freezing point depressant at MKE that contributed most to BOD5 in runoff exiting the airport and in receiving waters downstream. Other sources, which may include natural compounds and glycol degradation products, contributed more to BOD5 than acetate. Although the secondary outfall discharged the highest concentrations of freezing point depressants, the relatively low discharge from this site resulted in relatively low loads of BOD5. Instead, the primary outfall draining the main terminal contributed the greatest loads of BOD5 to receiving waters. Apportionment of BOD5 can provide insight to airport managers exploring options related to specific deicing compounds or locations within an airport as they provide safe airport operations while reducing impacts to downstream waters.
Supplementary material
Supplementary material is available online at Integrated Environmental Assessment and Management.
Data availability
Data and metadata are provided in the supporting information of the article and can be found online at https://waterdata.usgs.gov/nwis.
Author contributions
Sophia LaFond-Hudson (Formal analysis, Visualization, Writing—original draft, Writing—review & editing), Steven R. Corsi (Conceptualization, Funding acquisition, Methodology, Project administration, Supervision, Writing—review & editing), and Troy Rutter (Data curation, Investigation)
Funding
This study was financially supported by Milwaukee Mitchell International Airport and the United States Geological Survey (USGS) under cooperative agreement #23NKJFA049.
Conflicts of interest
None declared.
Disclaimer
Any use of trade, product, or firm names is for descriptive purposes only and does not imply endorsement by the U.S. Government.
Acknowledgments
The authors gratefully acknowledge the field and research assistance of USGS personnel Hayley Olds, Peter Lenaker, James Romano, and Kathryn Johncock. The authors thank Graham Anderson and Erin Mani for analytical support and guidance. The authors also thank Matt Pronschinske for creating a site map. The authors also wish to thank Aaron Porter and the anonymous reviewers, whose comments improved the quality of the manuscript.
