


Abstract

The purpose of this study was to develop a score to predict the complexity of video-assisted thoracoscopic surgery (VATS) lobectomies preoperatively.
One hundred and thirty-nine consecutive patients undergoing VATS lobectomy operated on by a single surgeon as the first operator were included. Complex operations were defined as: operation time >180 min (corresponding to the 75th percentile) or a conversion to thoracotomy. Several patient-related baseline and radiological variables were tested for a possible association with surgical complexity by logistic regression analysis. An aggregate score was created by weighing the regression estimates of the significant predictors. Patients were then grouped in classes of risk according to their scores. Finally, the score was validated in an external population of 154 VATS lobectomy patients.
Twenty-nine VATS lobectomies (21%) were classified as complex. The following variables were found to be significantly associated with a complex operation and were used to calculate the risk score in each patient (1 point each): male (P = 0.006), presence of thick pleura (P = 0.003), presence of emphysema (P = 0.001), enlarged hilar nodes (P = 0.003). Patients were grouped in 4 classes showing an incremental incidence of complex operations (P < 0.0001): score 0, 7.4%; score 1, 18%; score 2, 27%; score >2, 67%. In the external validation set, the score confirmed its association with the incidence of complex operations (P < 0.001): score 0, 7.3%; score 1, 10%; score 2, 16%; score >2 50%.
The complexity score appeared to be reproducible in an external setting and can be used to preoperatively identify appropriate candidates for VATS lobectomies to improve the efficiency and safety of the training phase.
INTRODUCTION
Video-assisted thoracoscopic surgery (VATS) for non-small-cell lung cancer is now the recommended approach for the surgical treatment of early stage lung cancer [1]. However, the adoption of this technique is still slow and only 18% of all lobectomies registered in the european society of thoracic surgeons (ESTS) database were performed by VATS [2].
There are many possible reasons for this finding. Operations are technically challenging and require both cognitive and technical expertise with a completely different anatomic perspective compared to the open approach [3]. Acquisition of this technique requires a carefully planned training, which can be organized in different ways depending on the level and experience of the surgeon, the availability of institutional resources and the time constraints of individual or institutional practices. In general, a stepwise approach is recommended with an initial proctorship and a sufficiently large exposure to procedures to achieve competency [4].
However, recent evidences have shown that competency cannot be acquired simply by increasing the volume of cases (i.e. to greater than 50 individual VATS lobectomies), owing to variations in patient- or disease-related characteristics, which are difficult to standardize [5]. Being able to reliably quantify the potential complexity of a VATS lobectomy case could assist in the stepwise planning of the training phase and to select the most appropriate patients in whom to apply the competence assessment tools [5]. In addition, the objective grading of the surgical complexity may assist during operating room scheduling by allocating the patient to the most appropriate surgeon based on their competence level (i.e. more complex cases to more experienced and competent surgeons), thereby improving the efficiency of the operating team and patient safety.
Therefore, the objective of the present study was to develop and validate a scoring system [based on patient-related characteristics and computed tomography (CT) scan findings] to stratify the complexity of a VATS lobectomy procedure in order to assist in the planning of operating room schedule and in the training of surgeons in their early stages of the learning curve.
PATIENTS AND METHODS
Patients
This is a retrospective analysis on 139 consecutive VATS lobectomy patients operated by a single surgeon as the first operator (April 2014–September 2017) in a single centre. Sublobar resections and operations performed by a supervised trainee were excluded for the sake of consistency and to obtain a homogeneous set of patients operated on with a standardized surgical procedure. Data were retrieved for the analysis from a prospectively maintained institutional clinical database. The study was reviewed by the Research and Innovation Department of the hospital and classified as service evaluation not requiring review by a NHS Research Ethics Committee.
All patients were selected for pulmonary resection according to current functional guidelines and after discussion during a multidisciplinary tumour board meeting [6]. VATS lobectomies in the derivation set were performed using a 2-port anterior approach, including a 3.5 cm utility incision and another 1.5 inferior port. All patients received a systematic lymph node dissection during the operation according to the European guidelines [7]. The surgeon had an experience of more than 200 VATS lobectomies as the first operator before this series, and had performed 75% of anatomic lung resections for lung cancer by VATS.
Personal contraindications for VATS were as follows: centrally located tumour larger than 5 cm, neoadjuvant chemotherapy for cN2 disease and positron emission tomography-positive hilar nodes.
The postoperative management was performed according to the institutional enhanced recovery pathway, which has been previously described [6]. Definition of risk factors and complications were defined and standardized at the database’s outset [8].
Statistical analysis
Complex operations were defined as: operation time >180 min, representing the 75% percentile of the operation time in this series, or operations converted to thoracotomy. The following patient and surgical variables were tested for a possible association with the complexity of the operation: age, gender, forced expiratory volume in 1 s, diffuse capacity in the lung for carbon monoxide, body mass index (BMI), coronary artery disease, cerebrovascular disease, diabetes mellitus, side and site of the lobectomy.
In addition, the following chest CT findings were analysed for a possible association with complexity of surgery: percentage of interlobar fissure visible at CT scan (the mean value of the estimations performed by the 2 independent investigators was calculated), presence of thick fissure or parietal pleura, presence of pleural plaques, radiological evidence of pleural adhesions, radiological presence of bullous/centrilobular emphysema, central tumours (within the lobar hilar structures or visible at bronchoscopy), presence of a large tumour (>3 cm), presence of hilar or interlobar lymph nodes visible on CT scan, distance from rib cage to tracheal carina (size of pleural space) and from skin to rib cage at the level of the tip of the scapula (mm). Chest CTs were independently reviewed and graded by 2 investigators. Discrepancies were resolved by discussing the individual cases with a third independent investigator. The tumour was categorized as large when its size was greater than 3 cm according to the threshold between T1 and T2 based on the tumour, node and metastasis (TNM) system. In general, tumours larger than 5 cm were operated on through an open approach and we believe that this numerical cut-off was justified for the purpose of this investigation (the development of an aggregate score).
The normal distribution of numeric variables was first assessed by the Shapiro–Wilk normality test. Numeric variables with normal distribution were tested by the unpaired Student’s t-test, and those without by the Mann–Whitney test. Categorical variables were tested by the χ2 test or the Fisher’s exact test. Univariable analysis was used to screen variables before logistic regression. Only variables with a P-value lower than 0.1 were included in stepwise logistic regression analyses with backwards elimination (P for retention in the model lower than 0.1). Independent predictors in the final model were proportionally weighed according to their odds ratio. Each patient was assigned a score derived from the sum of the points. Patients were then grouped into classes of risk according to their scores reflecting a similar incidence of complex operations.
The risk score was validated using 154 external consecutive VATS lobectomy patients operated on in another hospital over 12 months (in 2017). The VATS approach used in the validation set was a 3-port anterior approach. The surgical complexity was recalibrated according to the median operating time observed in the validation set (>75th percentile corresponding to 150 min) or the occurrence of conversion to open surgery. The score was calculated for each patient and the incidence of complex operation assessed in each class of risk. The χ2 test (or Fisher’s exact test) was used to assess differences among classes of risk in both the development and validation sets.
No correction for multiple testing was performed. All the statistical tests were 2-sided and P-values of 0.05 or less were considered statistically significant. Statistical analysis was performed with the statistical software Stata 15.0 (StataCorp, LP, College Station, TX, USA).
RESULTS
Baseline characteristics of the patients
Table 1 shows the characteristics of the patients in the derivation set. Median duration of the operation was 150 min [interquartile range (IQR) 120–180]. Twenty-four operations (17%) lasted longer than 180 min (upper quartile). Ten operations (7.2%) were converted to thoracotomy due to oncological reasons (n = 4), technical reasons (n = 4) or complications (n = 2). Five (3.6%) cases were converted to open surgery and lasted longer than 180 min. Therefore, a total of 29 VATS lobectomies (21%) were classified as complex operations.
Patient characteristics in the derivation set
| Variables | All patients (n = 139) | Complex (n = 29) | Non-complex (n = 110) | P-value |
|---|---|---|---|---|
| Age (years) | 70 (65–76) | 70.0 (65–74) | 69.9 (65–76) | 0.61 |
| Male gender | 51 (37) | 17 (59) | 34 (31) | 0.006 |
| BMI (kg/m2) | 26 (23–30) | 26 (23–29) | 27 (24–31) | 0.21 |
| DM | 15 (11) | 2 (6.9) | 13 (12) | 0.73 |
| CAD | 15 (11) | 5 (17) | 10 (9.1) | 0.31 |
| CVD | 9 (6.5) | 2 (6.9) | 7 (6.4) | 1 |
| FEV1 (%) | 91 (74–102) | 85 (70–95) | 92 (74–103) | 0.21 |
| DLCO% | 69 (58–81) | 65 (58–76) | 70 (58–82) | 0.31 |
| Side of resection (right) | 89 (64) | 21 (72) | 68 (62) | 0.39 |
| Site of resection | 0.15 | |||
| Upper | 88 (63) | 22 (76) | 66 (60) | |
| Middle | 11 (7.9) | 0 | 11 (10) | |
| Lower | 40 (29) | 7 (24) | 33 (30) |
Results are expressed as median and IQR for numeric variables and as count and percentages for categorical ones.
BMI: body mass index; CAD: coronary artery disease; CVD: cerebrovascular disease; DLCO%: carbon monoxide lung diffusion capacity; DM: diabetes mellitus; FEV1: forced expiratory volume in 1 s; IQR: interquartile range.
Cardiopulmonary complications occurred in 27 patients (19.4%), but we were not able to find any differences between complex and non-complex operations (n = 7, 24% vs n = 20, 18%, P = 0.44). Nevertheless, the incidence of air leaks longer than 5 days (PAL) was 59% in the complex group compared to 25% in the non-complex group (P = 0.001). Thirty-day mortality in this series was 0.7% (1 patient in the complex group). There was no significant difference between the 2 groups (0.7% vs 0%, P = 0.47). Median length of postoperative stay was 2.5 day longer in the complex group (7 days, IQR 5–9 vs 4.5 days, IQR 3–7, P = 0.002). Among the patient-related characteristics, only the male sex was associated with complexity of the operation (P = 0.006). Age, BMI, forced expiratory volume in 1 s, diffuse capacity in the lung for carbon monoxide, other comorbidities, the site and side of resections were not significantly different between the 2 groups (Table 1).
Chest computed tomography findings
Table 2 shows the radiological characteristics of the patients in the derivation set. The following radiological variables were found to be significantly associated with a complex operation after univariable analysis: presence of thick pleura (P = 0.003), presence of bullous or centrilobular emphysema (P = 0.001), presence of hilar nodal tissue (P = 0.003) and the size of the pleural space measured at the level of the carina (P = 0.019). Other findings were not significantly associated with the complexity of the operation at univariable analysis.
Chest CT findings in the derivation set
| Radiological variables | All patients (n = 139) | Complex (n = 29) | Non-complex (n = 110) | P-value |
|---|---|---|---|---|
| Quantitative completeness of the fissure (%), median (IQR) | 68 (45–87) | 63.8 (41–85) | 71.3 (45–87) | 0.84 |
| Fissure complete for more than 90% of its length, n (%) | 32 (23) | 4 (14) | 11 (10) | 0.51 |
| Presence of thick fissure, n (%) | 14 (10) | 4 (14) | 10 (9.1) | 0.49 |
| Presence of thick pleura, n (%) | 37 (27) | 14 (48) | 23 (21) | 0.003 |
| Presence of pleural plaques, n (%) | 2 (1.4) | 0 | 2 (0.2) | 1 |
| Radiological evidence of pleural adhesions, n (%) | 83 (60) | 20 (69) | 63 (57) | 0.25 |
| Presence of bullous/centrilobular emphysema, n (%) | 35 (25) | 14 (48) | 21 (19) | 0.001 |
| Central tumour (within the lobar hilar structures), n (%) | 14 (10) | 4 (14) | 10 (9.1) | 0.49 |
| Tumour >3 cm, n (%) | 48 (35) | 13 (45) | 35 (32) | 0.19 |
| Presence of hilar or interlobar lymph nodes visible at CT scan, n (%) | 26 (19) | 11 (38) | 15 (14) | 0.003 |
| Distance from the rib cage to carina (mm), median (IQR) | 115 (107–123) | 121.5 (110–128) | 114.5 (105–120) | 0.019 |
| Distance from the skin to the rib cage (mm), median (IQR) | 48 (40–58) | 48 (39–52) | 48.3 (40–59) | 0.36 |
CT: computed tomography; IQR: interquartile range.
Development of the complexity scoring system
Table 3 shows the final regression model. Post-estimation tests showed a good calibration (Hosmer–Lemeshow P = 0.81). The risk score was generated by weighing the variables according to their regression coefficients. All 4 predictors remained in the final model (male, pleural thickness, presence of bullous or centrilobular emphysema, presence of hilar nodal tissue) and were weighted 1 according to their similar regression odds ratio. Each patient was assigned a score derived from the sum of the individual points. The total score ranged from 0 to 4. Finally, the patients were grouped in classes of risk according to their scores. Patients with a score of 3 or 4 were grouped in the same class due to small numbers. Figures 1–3 are provided as references for the 3 radiological features included in the final model. The incidence of complex VATS lobectomies increased proportionally with the score in the derivation set: 4 of 54 (7.4%) for a score of 0 (class A), 7 of 40 (18%) for a score of 1 (class B), 8 of 30 (27%) for a score of 2 (class C), 10 of 15 (67%) for a score greater than 2 (class D + E) (P < 0.0001) (Fig. 4).
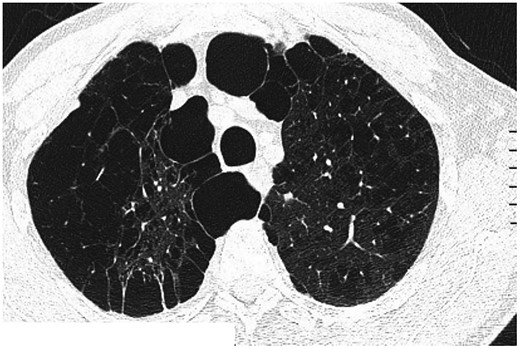
Computed tomography findings of centrilobular and bullous emphysema.
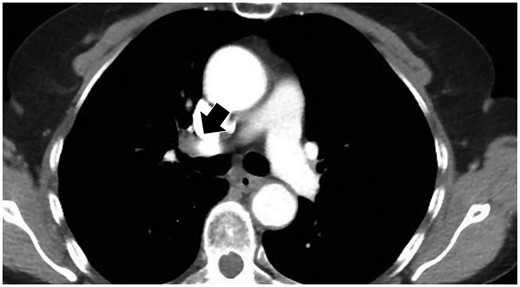
Computed tomography findings of visible hilar lymph nodes located along the main-stem bronchi (black arrow).

Computed tomography findings of thickened pleura. (A) Thick pleura is evident bilaterally at the apex in pulmonary window setting (black arrows). (B) The white arrow indicates pleural thickness in mediastinal window setting.
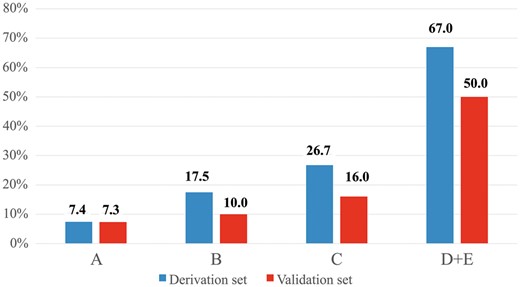
Incidence of complexity of video-assisted thoracoscopic lobectomy according to the classes of risk in the derivation and validation sets. Numbers in the y-axis indicate patients with complex video-assisted thoracoscopic lobectomies.
Results of the stepwise logistic regression analysis
| Predictors | Odds ratio | SE | P-value | 95% CI | Score |
|---|---|---|---|---|---|
| Male gender | 2.3 | 0.47 | 0.077 | 0.9–5.7 | 1 |
| Presence of hilar or interlobar lymph nodes visible at CT scan | 2.9 | 0.51 | 0.040 | 1.0–7.8 | 1 |
| Presence of thick pleura | 2.4 | 0.48 | 0.075 | 0.9–6.0 | 1 |
| Presence of bullous/centrilobular emphysema | 2.7 | 0.48 | 0.038 | 1.1–6.9 | 1 |
Only the final model is displayed (P for retention <0.1). Goodness of fit Hosmer–Lemeshow P-value = 0.81 (derivation set); c-index 0.76 (derivation set), 0.72 (validation set).
CI: confidence interval; CT: computed tomography; SE: standard error.
External validation
The score was validated in an external population of 154 consecutive patients operated on with VATS lobectomy over 12 months (in 2017) at another unit. The characteristics of these patients are shown in Table 4. All patients operated on during that period by all 4 surgeons in that unit were included in the validation set to test generalizability of the score. Forty-three (27.9%) patients were operated on by surgeons with a prior experience of less than 50 VATS lobectomies, 111 (72.1%) were operated on by surgeons with a prior experience of at least 50 VATS lobectomies.
Characteristics of the patients in the validation set (154 patients)
| Variables | |
|---|---|
| Age (years) | 67 (61–72) |
| Male gender | 98 (64) |
| BMI (kg/m2) | 26.7 (24.0–29.3) |
| DM | 30 (19) |
| CAD | 8 (5.2) |
| CVD | 6 (3.9) |
| FEV1 (%) | 90.5 (75–109) |
| DLCO% | 83 (71–99) |
| Side of resection (right) | 106 (69) |
| Site of resection | |
| Upper | 82 (53) |
| Middle | 18 (12) |
| Lower | 54 (35) |
| Presence of hilar or interlobar lymph nodes visible at CT scan | 38 (25) |
| Presence of bullous/centrilobular emphysema | 26 (17) |
| Presence of thick pleura | 28 (18) |
Results are expressed as median and IQR for numeric variables and as count and percentages for categorical ones.
BMI: body mass index; CAD: coronary artery disease; CT: computed tomography; CVD: cerebrovascular disease; DLCO%: carbon monoxide lung diffusion capacity; DM: diabetes mellitus; FEV1: forced expiratory volume in 1 s; IQR: interquartile range.
The definition of complex cases was calibrated to the median duration of surgery in the validation set (upper quartile 150 min). Twenty-four (15.6%) patients experienced cardiopulmonary complications while no mortality was observed. The incidence of complications was similar between complex and non-complex operations (4 of 25 patients vs 20 of 129, P = 1.0). The length of hospital stay was also similar between patients with and without complex operations (median 5 days, IQR 4–6 vs 5, IQR 4–6, P = 0.46).
When tested in the entire population, the regression model derived in the derivation set had a satisfactory discrimination (c-index 0.72). Moreover, an increasing complexity score correlated with an incremental increase in incidence of complex cases (P < 0.001): score 0 (3/41: 7.3%), score 1 (6/60: 10%), score 2 (5/32: 16%), score 3 and 4 (10/20: 50%) (Fig. 4). When the analysis was restricted to patients operated on by experienced surgeons, a high complexity score remained associated with a progressively higher number of complex cases: score 0 (2/27: 7.4%), score 1 (5/46: 11%), score 2 (2/25: 8%) and score >2 (5/12: 42%), P-value = 0.040. The association of increasing risk score with an increasing incidence of complex operations was confirmed also when it was tested on patients operated on by the less experienced surgeons (previous experience of less than 50 VATS lobectomies): score 0 (1/14: 7.1%), score 1 (1/14: 7.1%), score 2 (3/7: 43%) and score >2 (5/8: 63%), P-value = 0.005.
DISCUSSION
Background and rationale of the study
Despite the fact that VATS is the recommended approach for performing lobectomy in early stage lung cancer patients [1], its widespread adoption remains slow [2] and variable, independently of patient or tumour characteristics and is more related to provider discretion [9].
Several factors may explain this lag in the adoption of VATS, including difficulties or reluctance in organizing proper training due to individual or institutional logistical or financial constraints. VATS lobectomy entails a completely different set of skills compared to open surgery, including a different visual and physical orientation for the surgeon and a cognitive understanding of 2-dimensional view of the surgical field [10]. In addition, several modifications of the anterior approach have been popularized by several groups and practised in different centres, each one of these modifications entailing specific surgical steps. Different training models have been proposed recently to streamline the safe adoption of VATS lobectomy [11–14].
In addition, specific instruments for competency assessment have been proposed in an attempt to monitor the progress in the acquisition of the necessary knowledge and skills to safely perform VATS lobectomy [5, 10, 15]. Certainly, variation in competency still exists, even among surgeons with vast experience [5] and it is mainly explained by the variability in patient and disease characteristics, which are difficult to standardize in the real practice and outside a simulator environment.
In an attempt to overcome this problem, we sought to develop an instrument to stratify the technical complexity of VATS lobectomy. The objective was to develop and validate a score based on patient-related characteristics and preoperative chest CT imaging, which could identify patients at risk of a complex procedure. This tool may serve the purpose of streamlining the VATS lobectomy learning curve during the mentorship-proctorship phase and ensuring both patient safety and a fairer assessment of competency.
Main findings
We were able to develop an aggregate scoring system including both patient and radiological characteristics, which correlated to the complexity of the procedure performed by a single surgeon at 1 institution. The score retained its correlation to the surgical complexity, even when tested in an independent external set of patients operated on in another centre by different surgeons. In brief, when no risk factor is present, there was a 93% probability that the operation would not be complex. On the other hand, when 3 or more risk factors are present, the risk that the VATS lobectomy would be a complex case ranged from 50% to 67% (validation and derivation sets, respectively). Reassuringly, we could not identify any differences in outcomes (complication and mortality) between complex and non-complex cases.
The choice of developing the score using a population of patients operated on by a single surgeon was made to minimize biases derived from variations in surgical approach, surgical experience, operative steps and attitude towards conversion.
The other caveat of this study is the arbitrary definition of a complex operation. We chose a composite end point combining prolonged operation time and the occurrence of a conversion to open surgery. Both outcomes have face validity. The operation time has recently been found to be associated with increased rate of mortality after VATS lobectomy [16] and appeared to be a logical surrogate for surgical complexity. It was also found to be associated with increased operating room occupancy and hospital costs. Conversion rate in this study (7%) was similar to a recently reported study [17], although only 20% of conversions were due to intraoperative major complications as opposed to 50% in previous studies [17].
We identified 4 significant factors associated with complex operations, including male gender, pleural thickness, the presence of bullous or centrilobular emphysema and the presence of radiologically visible hilar or interlobar lymph nodes. All these factors had the same independent impact on the outcome when tested with a multivariable regression analysis (similar regression coefficients and odds ratio) and they were all assigned the same weight in the scoring system.
The risk factors may have contributed to increase technical complexity due to a combination of reasons but were mainly related to a more difficult dissection caused by parenchymal inflammatory changes and dense hilar tissue as a result of cancer or chronic disease. In males for instance, these features may be linked to a higher prevalence of smoking or dust-related chronic disease compared to females. Operations in patients with emphysema may be more complex due to parenchymal and peribronchial inflammatory changes and to chronic airways disease. Pleural thickening may also be caused by a variety of asbestos- or non-asbestos-related pathologies that may be associated with some extent of pleural adhesions, or with the presence of inflammatory or calcified lymph nodes. Lastly, the significance of visible hilar or interlobar lymph nodes is consistent with previous reports [18, 19].
To date, many authors have tested clinical or imaging factors in order to determine an association with conversions [18–20]. Surgeon experiences [17], pleural adhesions, calcified and enlarged lymph nodes, rare anatomy and technical errors have been identified. In particular, presence of calcified lymph nodes was the most frequently reported cause of conversion due to complicated vascular dissection or vessel injury [19]. However, Puri et al. [18] reported that no specific imaging variables (granulomatous disease on CT scan, clinical stage N1, prior cardiothoracic surgery etc.) could predict conversion.
Limitations
This study has potential limitations. Firstly, as discussed above, there may be inherent limitations for the selection of the sample size and the choice to limit the derivation set to patients operated on by a single experienced surgeon. The choice was made to minimize variations in surgical practice among different surgeons, which we thought to be important in the development phase of the model. For this reason, we cannot rule out the fact that the same factors may correlate differently with the outcome, when tested in a population operated on by less experience surgeons. Nevertheless, we then validated the score in a heterogeneous set of patients operated on in another centre by several surgeons with different levels of experience. The score maintained its predictive ability.
Second, our definition of complex VATS lobectomy, albeit logical and practical, is arbitrary. For instance, the choice of 180 min as a threshold to define a prolonged surgical time is not supported by evidence. However, this threshold was selected as it represented the upper quartile in the derivation set and will need to be tested in future studies as this may translate in different absolute time values in different centres. In fact, operative time may reflect a given surgeon’s technique for VATS lobectomy and may be influenced not only by anatomical features but also by other technical aspects, such as the extent of lymphadenectomy. With respect to the latter, although the number of harvested nodes was not available for this study, all patients in the study received a systematic standardized lymph node dissection [7]. Similarly, the decision to convert to open surgery is often surgeon-dependent and affected by experience and attitude. For this reason, although the score was externally validated, future studies will be needed to assess its reliability in larger multicentre populations.
Third, this score has yet to be tested by trainees or surgeons in the very early stages of their VATS lobectomy learning curve. Although the role of the supervising surgeon is expected to be more intense in this phase and could overcome part of the technical challenges in complex cases, the end point can be adapted by including, for instance, the proportion of operation performed by the trainee or the number of active interventions of the supervisor.
The score was derived from a population operated on by a surgeon performing approximately 75% of lobectomies by VATS. This may correspond to a longer operating time as more complex cases are included compared to centres with less experience or lower proportion of patients approached by VATS.
Another potential limitation is the small sample size and the possible under-representation of some rare variables. For instance, pleural plaques were present in less than 1% of patients. In addition the small number of events in the derivation set may have affected the output of the regression analysis, raising concerns of model overfitting. Nevertheless, the performance of the model was satisfactory in both the derivation and validation set.
Finally, the radiological factors were not reviewed or graded by a radiologist. They were assessed and interpreted by thoracic surgeons. This was chosen on purpose as we wanted to create a practical score including variables, which could be easily derived from the preoperative CT by every thoracic surgeon in their daily clinical practice.
CLINICAL IMPLICATIONS AND CONCLUSION
In conclusion, we were able to develop and validate a simple aggregate score aimed at preoperatively stratifying the complexity of VATS lobectomy. This score appeared to be reproducible in an external setting and can be used to preoperatively identify appropriate candidates for VATS lobectomies in order to improve the efficiency and safety of the training phase. In addition, it may represent a useful tool to minimize variation in the competency assessment of VATS lobectomy curricula. The score was not created with the intention of selecting patients for VATS approach. However, in units with surgeons with different levels of VATS experience and competency, the score can assist in appropriately allocating more complex cases to more experienced surgeons in order to improve surgical efficiency and patient safety and minimize the risk of major intraoperative complications [17].
Conflict of interest: none declared.
Acknowledgement
Presented at the 26th European Conference on General Thoracic Surgery, Ljubljana, Slovenia, 27–30 May 2018.
