


Abstract

In patients with pulmonary atresia with an intact ventricular septum (PA/IVS), there are no reports about the impact of sinusoidal communication (SC) on left ventricular (LV) performance after a Fontan operation; therefore, the purpose of this study was to fill this gap in the literature.
We performed a single-centre, retrospective study of 46 patients with PA/IVS. Nineteen patients who underwent the Fontan procedure were enrolled and divided into 2 groups: those with SC (SC group) and those without SC (N group). The 2 groups were compared in terms of postoperative cardiac function.
Thirteen patients were in the SC group (4 patients with right ventricle-dependent coronary circulation) and 6, in the N group. Although 2 of the patients with right ventricular (RV)-dependent coronary circulation showed focal asynergy of the LV wall, others showed no findings of myocardial infarction. The patients' preoperative age and age during the observation period after the Fontan operation did not differ. There was no difference in LV ejection fraction, cardiac index and RV and pulmonary artery pressure before and after the Fontan operation. Preoperative RV volume in the N group was greater than that in the SC group. Brain natriuretic peptide levels were higher in the SC group after the Fontan operation. On ventricular efficacy analysis, contractility was lower (1.8 ± 0.32 vs 2.5 ± 0.40 mmHg/ml/m2, P = 0.001) and ventricular efficacy was worse (1.0 ± 0.15 vs 0.86 ± 0.11, P = 0.046) in the SC group during the postoperative period.
Compared to patients with PA/IVS without SC, patients with PA/IVS with SC had a low cardiac contractility and decreased cardiac output efficiency after the Fontan procedure.
INTRODUCTION
In patients with pulmonary atresia and an intact ventricular septum (PA/IVS), various coronary abnormalities are common. Previous researchers have reported that sinusoidal communication (SC) is present in 32–75% and right ventricular-dependent coronary circulation (RVDCC) is found in 9–40% of patients with PA/IVS [1–4]. Ischaemic symptoms appear even in non-RVDCC, similar to that in patients with high blood flow SC, because of the low diastolic pressure after a systemic-to-pulmonary artery shunt procedure (SP shunt) [1–5]. Therefore, even if coronary blood flow reduction due to right ventricular (RV) decompression does not occur, deterioration of left ventricular (LV) function due to coronary ischaemia is a concern.
Tanoue et al. [6] reported that LV performance after the Fontan operation in patients with PA/IVS was inferior to that in patients with tricuspid atresia. However, there are no reports on the influence of SC on the LV performance of patients with PA/IVS after the Fontan operation. Therefore, the objective of this study was to fill this gap in the literature.
PATIENTS AND METHODS
Written informed consent for the use of patient records was obtained from the legal guardian of each patient.
Patients
We performed a single-centre, retrospective study to review the records of 46 patients who were admitted with the diagnosis of PA/IVS and treated at our institution between April 1990 and March 2017. Nineteen patients underwent the Fontan procedure and postoperative cardiac catheterization, and these patients comprised the study population. We tried RV decompression for biventricular or a one-and-one-half ventricular repair in patients with PA/IVS. Our criterion for RV decompression was a right ventricle end-diastolic volume (RVEDV) index that was more than 60% of normal or a z score for the tricuspid valve diameter that was greater than −3 without RVDCC and tricuspid valve dysplasia. Although RV decompression was performed for a biventricular or a one-and-one-half ventricular repair, 7 patients did not meet the criteria for a biventricular or a one-and-one-half ventricular repair and underwent the Fontan operation. We divided the patients into 2 groups according to whether they had SC: the SC group (n = 13, with SC) and the N group (n = 6, without SC). Both groups were compared in terms of perioperative cardiac function.
Data collection
Medical records, echocardiograms and angiograms were reviewed. As Cheung et al. [2] previously reported, RVDCC was defined as a confirmed or strong suspicion of stenosis in 2 or more main coronary arteries or any presence of atresia in the proximal portion of the main coronary artery.
Patients underwent cardiac catheterization before the bidirectional Glenn (BDG) procedure and before and after the Fontan procedure. Cardiac catheterization was performed under sedation, and the data were collected with 40 ± 2 mmHg PaCO2. Catecholamine was not administered during the examination. Cardiac catheterization provided the following data: LV end-diastolic volume index, LV end-diastolic pressure, left ventricular ejection fraction (LVEF), right ventricular end-diastolic volume index (RVEDVI), right ventricular end-diastolic pressure, mean pulmonary artery pressure and the pulmonary artery index [7]. Approximation of the cardiac index was based on the Fick principle. Follow-up coronary angiographic findings were compared with those from the first angiogram to evaluate the change in the morphology of the coronary artery and the SC. The grade of mitral regurgitation and the Tei Index of the LV were examined by ultrasound cardiography before the BDG and before and after the Fontan procedure. Furthermore, brain natriuretic peptide levels were checked at each catheterization and outpatient examination, and the latest data were compared.
Calculation of afterload (Ea), contractility (Ees) and ventricular efficiency (Ea/Ees) was performed on the basis of pressure and volume data obtained from cardiac catheterization by the approximation method. Calculations were performed retrospectively during the study period. Approximation of Ea and Ees devised by Tanoue et al. [6] was as follows: Ea = mean arterial pressure/minimal LV volume and Ees = maximal LV pressure/(maximal LV volume − minimal LV volume). The ventricular volume was normalized with the body surface area. Ea/Ees represented the ventriculoarterial coupling between the LV and the arterial system [6, 8, 9].
Statistical analyses
Statistical analyses were performed using PASW Statistics version 18 (SPSS Inc., Chicago, IL, USA). Data were described as mean ± standard deviation. Categorical variables were analysed using the Fisher exact test, as appropriate. Continuous variables with a normal distribution and continuous variables with non-normal distributions were analysed using the Student's t-test and the Mann–Whitney U-test, respectively. Statistical significance was set at a P-value of <0.05.
RESULTS
Thirteen patients were in the SC group (4 patients with RVDCC) and 6 patients were in the N group. Two of the patients with RVDCC in the SC group showed a change in electrocardiographic findings (abnormal Q wave) from birth. LV wall asynergy in the region corresponding to RVDCC was observed on echocardiography after the Fontan operation. In the remaining 2 cases, no myocardial infarction was observed before or after the Fontan surgery. RV decompression was performed in 3 patients in the SC group (2 Brock operations and 1 RV outflow tract reconstruction with a transannular patch) and in 4 patients in the N group (1 Brock operation, 2 RV outflow tract reconstructions with a transannular patch and 1 percutaneous transluminal pulmonary valvuloplasty) (P = 0.13). In 1 patient with RVDCC in the SC group, a BDG procedure was performed at 3 months as an initial surgery to avoid decompression of the RV without performing an SP shunt procedure. There was no difference between the 2 groups in terms of the palliative operation undertaken before the Fontan surgery. We did not create fenestration in any of the cases. In 4 patients with RVDCC in the SC group, an arterial perfusion cannula was inserted into the right atrium (RA) to conduct a venovenous bypass during the BDG procedure. During the Fontan procedure, 2 patients with RVDCC in the SC group required perfusion of the RA with oxygenated blood. In other cases, the Fontan procedure was performed under total extracorporeal circulation because no electrocardiogram changes due to draining systemic venous blood were observed. There were no intraoperative complications. No patients were diagnosed with complete or advanced AV block, and no patients needed a pacemaker implanted during the study period. The age at the last follow-up cardiac catheterization was 5.6 ± 5.9 years for the SC group after the Fontan operation and 6.3 ± 4.6 years for the N group (P = 0.71). The postoperative observation period after the Fontan procedure was 8.6 ± 5.5 years in the SC group and 10.6 ± 6.6 years in the N group (P = 0.47) (Tables 1 and 2). All patients in both groups survived during the study period.
Patient characteristics
| SC group | N group | P-value | |
|---|---|---|---|
| Total number of patients | 13 | 6 | |
| Male, n | 6 | 5 | 0.33 |
| RVDCC | 4 | 0 | 0.26 |
| Abnormal Q waves at birth | 2 | 0 | 1.0 |
| RV decompression | 3 | 4 | 0.13 |
| Systemic-pulmonary artery shunt | 12 | 6 | 1.0 |
| BDG operation | 11 | 3 | 0.26 |
| Arterial cannulation into RA at BDG | 4 | 0 | 0.26 |
| Age at Fontan operation (years), (range) | 4.9 ± 3.6 (2.7–7.4) | 4.1 ± 1.8 (2.1–7.4) | 0.77 |
| Fontan type | 0.22 | ||
| Lateral tunnel TCPC (intra-atrial baffle) | 1 | 3 | |
| Extracardiac TCPC | 12 | 3 | |
| Arterial cannulation into the RA at Fontan operation | 2 | 0 | 1.0 |
| ECC time (min) | 206 ± 74 | 253 ± 96 | 0.25 |
| Cross-clamp time (min), (range) | 20 ± 25 (33–70, n = 6) | 51 ± 40 (28–110, n = 5) | 0.052 |
| Procedures requiring cross-clamp | |||
| ASD enlargement | 4 | 2 | |
| Intra-atrial baffle | 1 | 3 | |
| PV closure | 1 | – | |
| Duration from Fontan operation to the last catheter (years) | 5.6 ± 5.8 | 6.3 ± 4.6 | 0.71 |
| Follow-up period (years) | 8.6 ± 5.5 | 10.6 ± 6.6 | 0.47 |
Continuous data are presented as mean ± standard deviation; categorical data are shown as the number of observations.
ASD: atrial septal defect; BDG: bidirectional Glenn; ECC: extracorporeal circulation; N: no sinusoidal communication; PV: pulmonary valve; RA: right atrium; RV: right ventricle; RVDCC: right ventricle-dependent coronary circulation; SC: sinusoidal communication; TCPC: total cavopulmonary connection.
Patient characteristics
| Patient | RVDCC | At first catheterization | ||||||||
|---|---|---|---|---|---|---|---|---|---|---|
| BW (kg) | BSA (m2) | TVD (mm) | Z score | RVEDV (%N) | PAI (mm2/m2) | RV decompression | BDG | |||
| 1 | SC | + (LAD interruption) | 3.1 | 0.19 | 4.1 | −6.2 | 42 | 270 | − | + |
| 2 | SC | + (RCA interruption) | 3.1 | 0.18 | 6.6 | −3.3 | 6 | 204 | − | + |
| 3 | SC | + (RCA, LAD proximal stenosis) | 3.3 | 0.19 | 5.0 | −4.6 | 23 | 144 | − | + |
| 4 | SC | + (LAD interruption) | 2.6 | 0.18 | 7.6 | −2.2 | 28 | 129 | − | + |
| 5 | SC | − | 2.5 | 0.17 | 6.8 | −3.0 | 38 | 191 | Transannular patch | + |
| 6 | SC | − | 2.5 | 0.17 | 5.5 | −3.8 | 23 | 130 | − | − |
| 7 | SC | − | 2.6 | 0.18 | 8.9 | −1.3 | 44 | 119 | Brock, PTPV | + |
| 8 | SC | − | 2.7 | 0.18 | 5.0 | −4.4 | 18 | 89 | − | + |
| 9 | SC | − | 3.1 | 0.19 | 4.8 | −4.8 | 15 | 150 | − | + |
| 10 | SC | − | 3.5 | 0.21 | 6.8 | −3.5 | 21 | 136 | − | − |
| 11 | SC | − | 2.8 | 0.18 | 7.4 | −2.6 | 28 | 182 | − | + |
| 12 | SC | − | 5.7 | 0.26 | 7.5 | −3.4 | 23 | NA | Brock | + |
| 13 | SC | − | 3.3 | 0.19 | 7.4 | −2.4 | 30 | 365 | − | + |
| 1 | N | − | 3.7 | 0.22 | 6.0 | −4.3 | NA | 138 | Transannular patch | − |
| 2 | N | − | 3.2 | 0.19 | 6.2 | −3.4 | 29 | 219 | Transannular patch | + |
| 3 | N | − | 4.0 | 0.20 | 4.4 | −5.9 | NA | 231 | − | + |
| 4 | N | − | 3.5 | 0.20 | 7.2 | −3.0 | 44 | 148 | PTPV | − |
| 5 | N | − | 3.2 | 0.21 | 8.8 | −1.9 | 80 | 201 | Brock | + |
| 6 | N | − | 2.7 | 0.18 | 8.7 | −1.7 | 45 | 158 | − | + |
Approximation of RVEDV was as follows: 94.8*BSA1.42 [10].
%N: % of normal; BDG: bidirectional Glenn; BSA: body surface area; BW: body weight; LAD: left anterior descending; NA: not assessed; PAI: pulmonary artery index [7]; PTPV: percutaneous transluminal pulmonary valvuloplasty; RCA: right coronary artery; RV: right ventricle; RVDCC: right ventricle-dependent coronary circulation; RVEDV: right ventricular end-diastolic volume; SC: sinusoidal communication; TVD: tricuspid valve diameter.
There was no difference between the 2 groups in terms of LVEF, cardiac index and mitral regurgitation grade both before and after the operation and in LV end-diastolic pressure and LV Tei Index after the Fontan operation. The LV end-diastolic volume index was significantly larger in the N group before the operation and in the SC group after the operation. There was no significant difference in right ventricle end-systolic pressure and right ventricular end-diastolic pressure between the 2 groups, but preoperative RVEDVI was significantly larger in the N group (SC group 15 ± 9 vs N group 27 ± 5 ml/m2, P < 0.01). With respect to the chronological change of SC, the SC of 5 of 13 patients disappeared after the Fontan operation. However, in 4 patients with RVDCC, SC did not disappear. In 5 of 8 patients, coronary artery dilatation and meandering were observed during the long-term follow-up period (Fig. 1). Brain natriuretic peptide levels were also significantly higher in the SC group (25.6 ± 25.3 vs 8.6 ± 4.2 pg/ml, P = 0.046) at the latest follow-up catheter examination (Table 3).
Cardiac function and laboratory data
| SC group (n = 13) | N group (n = 6) | P-value | |
|---|---|---|---|
| LVEDVI (ml/m2) | |||
| Pre | 114 ± 24 | 165 ± 30 | <0.01* |
| Post | 96 ± 23 | 78 ± 7 | <0.01* |
| LVEDP (mmHg) | |||
| Pre | 6.8 ± 2.1 | 10.2 ± 1.7 | <0.01* |
| Post | 7.8 ± 2.0 | 8.3 ± 3.0 | 0.69 |
| LVEF (%) | |||
| Pre | 57 ± 5 | 58 ± 4 | 0.54 |
| Post | 57 ± 5 | 59 ± 4 | 0.40 |
| Tei index | |||
| Post | 0.37 ± 0.08 | 0.32 ± 0.11 | 0.45 |
| MR grade (≧mild) | |||
| Pre | 1 | 1 | 1.0 |
| Post | 2 | 0 | 1.0 |
| CI (ml/min/m2) | |||
| Pre | 3.9 ± 1.1 | 4.7 ± 0.9 | 0.081 |
| Post | 3.3 ± 0.6 | 3.7 ± 1.4 | 0.98 |
| RVEDVI (ml/m2) | |||
| Pre | 15 ± 9 | 27 ± 5 | <0.01* |
| RVESP (mmHg) | |||
| Pre | 105 ± 52 | 67 ± 61 | 0.18 |
| RVEDP (mmHg) | |||
| Pre | 9.1 ± 3.1 | 10.2 ± 3.2 | 0.44 |
| mPAP (mmHg) | |||
| Pre | 11 ± 2.5 | 13 ± 1.6 | 0.092 |
| Post | 9.5 ± 1.5 | 11 ± 2.8 | 0.37 |
| PA index (mm2/m2) | |||
| Pre | 294 ± 145 | 280 ± 100 | 0.96 |
| Post | 234 ± 94 | 195 ± 79 | 0.59 |
| BNP (pg/ml) | |||
| Post | 25.6 ± 25.3 | 8.6 ± 4.2 | 0.046** |
Continuous data are presented as mean ± standard deviation; categorical data are shown as the number of observations.
P-value <0.01.
P-value <0.05.
BNP: brain natriuretic peptide; CI: cardiac index; LVEDP: left ventricle end-diastolic pressure; LVEDVI: left ventricle end-diastolic volume index; LVEF: left ventricle ejection fraction; mPAP: mean pulmonary artery pressure; MR: mitral regurgitation; N: no sinusoidal communication; PA: pulmonary artery; post: post-Fontan operation; pre: pre-Fontan operation; RVEDP: right ventricle end-diastolic pressure; RVEDVI: right ventricle end-diastolic volume index; RVESP: right ventricle end-systolic pressure; SC: sinusoidal compression.
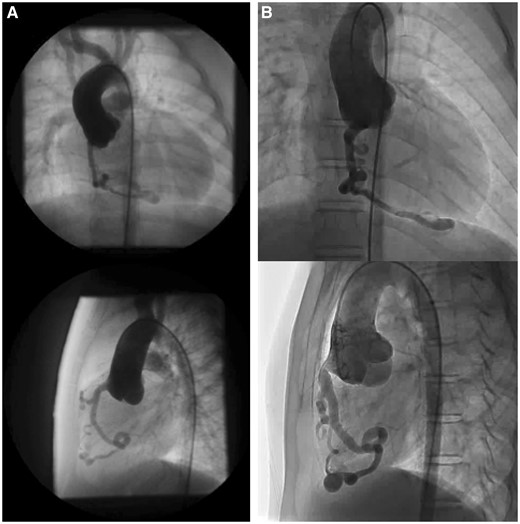
Coronary artery dilatation and meandering. Coronary angiograms (top row: frontal view; bottom row: lateral view) before the Fontan operation (A) and 10 years after the Fontan operation (B).
Results of the ventricular efficacy analysis are shown in Fig. 2. Ea tended to be higher in the SC group before the Fontan procedure (1.4 ± 0.30 vs 1.1 ± 0.31 mmHg/ml/m2, P = 0.058), and the Ea in the N group was significantly higher in the postoperative period (1.8 ± 0.30 vs 2.1 ± 0.16 mmHg/ml/m2, P = 0.046). There was no significant difference in Ees between the 2 groups before surgery (1.4 ± 0.36 vs 1.1 ± 0.29 mmHg/ml/m2, P = 0.18), and Ees in the SC group was significantly lower in the postoperative period (1.8 ± 0.32 vs 2.5 ± 0.40 mmHg/ml/m2, P = 0.001). Although there was no significant difference in the Ea/Ees before the Fontan procedure (1.0 ± 0.25 vs 0.95 ± 0.15, P = 0.42), the Ea/Ees in the SC group was significantly higher in the postoperative period (1.0 ± 0.15 vs 0.86 ± 0.11, P = 0.046). Even if we excluded 2 patients with RVDCC in the SC group who had findings indicative of myocardial infarction, the postoperative Ees in the SC group was significantly lower (1.9 ± 0.25 vs 2.5 ± 0.40, P = 0.002), and Ea/Ees tended to be higher (1.0 ± 0.15 vs 0.86 ± 0.11, P = 0.098).
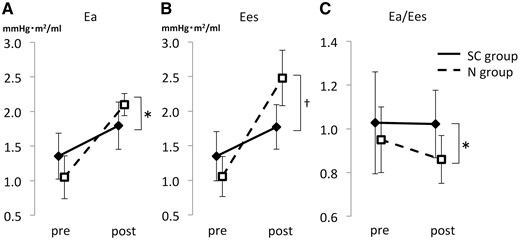
Comparison of Ea, Ees and Ea/Ees. (A) The increment in afterload Ea values after the Fontan operation was larger in the N group than in the SC group. (B) The increment in contractility Ees values after the Fontan operation was larger in the N group than in the SC group. (C) The ventricular efficacy (arterial elastance) Es/Ees value in the SC group was more than 1.0 and larger than that in the N group. The solid line shows the SC group, and the dotted line indicates the N group. *Means <0.05, and †means <0.01. Ea/Ees: ventricular efficiency; Ea: afterload; Ees: contractility; N: patients without sinusoidal communication; SC: sinusoidal communication.
DISCUSSION
In 19 patients with PA/IVS who underwent a Fontan operation at our hospital, no significant differences were found in LVEF and cardiac index with or without SC, but cardiac contractility (Ees) was significantly lower and LV arterial coupling (Ea/Ees) was significantly poorer in patients with SC.
In the SC group, LV cardiac contractility (Ees) was significantly lower and brain natriuretic peptide levels were higher in the N group. A coronary artery abnormality was considered the cause of lower LV contractility. For patients with PA/IVS with SC, coronary artery ischaemia was prevented by postponing RV decompression in patients with RVDCC and by not performing an SP shunt procedure in patients with high blood flow SC [11]. However, venous blood not only flows to the coronary artery before the Fontan procedure, but the coronary perfusion pressure is high even after the Fontan procedure, and turbulence of blood at the sinusoid and coronary artery junctions causes damage to the coronary artery intima. There is concern about stenosis due to intimal hyperplasia, and it is thought that the chronic reduction in coronary flow is one of the causes of a decrease in LV contractility [3, 5, 12].
Several methods for preventing a reduction in coronary blood flow have been reported. At our hospital, in patients with RVDCC, RV decompression was avoided by using a concomitant venovenous bypass with insertion of an arterial perfusion cannula into the RA [11]. In recent years, in the case of RVDCC, to prevent decreased diastolic blood pressure by performing the SP shunt procedure, prostaglandin E1 was administered to maintain ductal patency without performing the SP shunt procedure. Compared with the SP shunt, the patent ductus arteriosus has less shunt flow and less reduction in diastolic pressure under appropriate management with prostaglandin infusion. For patients with RVDCC, to maintain the patent ductus arteriosus with prostaglandin E1, continuous infusion is recommended for prevention of cardiac ischaemia until the BDG operation. Then, we performed the BDG procedure at age 3 months as the first palliation. As a result, no ischaemic change was observed in the perioperative period. These methods prevented cardiac function deterioration due to perioperative coronary blood flow reduction. In 17 patients, except for 2 in whom an abnormal Q wave and focal asynergy were observed, there were no findings indicative of myocardial infarction during the follow-up period. The SC had disappeared in 5 of 13 in the SC group, but in 5 of 8 of the remaining patients with SC, the coronary artery was dilated and meandered during the follow-up period, showing progression of stenosis on the peripheral side.
Conversely, the influence of the RV pressure and volume cannot be excluded from the difference in the LV function. Although RVEDVI in the SC group was significantly smaller, it is not known how the difference in volume influenced LV function. With regard to the RV pressure, no significant difference in the number of cases was found in which RV decompression was performed in 3 patients in the SC group and 4 in the N group. No significant differences were found in right ventricle end-systolic pressure and right ventricular end-diastolic pressure after the BDG procedure. Moreover, no significant difference was noted in the Tei Index of the LV after the Fontan procedure, and it could not be asserted that the RV pressure had a significant effect on the diastolic function of the LV. Afterload increases after the Fontan procedure by adding pulmonary vascular resistance to systemic vascular resistance. An Ea/Ees greater than 1 was regarded as an indicator of a decrease in cardiac output efficiency [6, 8, 9, 13]. In the SC group, Ea/Ees was significantly poorer, and Ees was significantly lower in the N group. Thus, compensatory LV contractility was considered insufficiently increased in response to a rise in afterload due to the Fontan procedure; it was considered to be in a state of contractility-afterload mismatch. Increased afterload is expected due to lifestyle-related diseases, such as hypertension at long-term follow-up after the Fontan procedure. Strict afterload control was required in the SC group, which already exhibited contractility-afterload mismatch. Therefore, reduction of afterload is necessary to obtain a good Fontan circulation by regulating lifestyle habits and taking medicine, such as angiotensin-converting enzyme inhibitors.
The approximation of Ees and Ea [6, 8, 9, 13] in this study was inherently limited and did not amount to the measurement obtained with a conductance catheter. Because the amount of oxygen consumed used in the Fick method was not an actual measurement value but was based on an estimation generated using the LaFarge–Miettinen formula [14], measurement error was a concern.
Limitations
Furthermore, this study was limited by its retrospective, single-centre design, small sample size (i.e. number of patients in each group) and short follow-up period. Therefore, future prospective, multicentre studies with a larger sample are warranted to validate our conclusions. In addition, evaluation by a treadmill test is also necessary to see how the decrease in cardiac output efficiency affects exercise tolerance.
CONCLUSION
Compared with patients with PA/IVS without SC, patients with PA/IVS with SC had low cardiac contractility and decreased cardiac output efficiency after the Fontan procedure.
ACKNOWLEDGEMENTS
The authors like to thank ‘Editage’ (www.editage.jp) for English language editing.
Conflict of interest: none declared.
