


Although a decrease in psoas muscle area (PMA) has been reported as a risk factor for survival in several malignancies, there have been few studies regarding its prognostic value in oesophageal cancer. We investigated the prognostic role of PMA and its F-18 fluorodeoxyglucose uptake in patients who had surgically treated oesophageal cancer.
From 2004 to 2013, 131 patients who underwent surgical resection and complete lymph node dissection for oesophageal cancer were retrospectively reviewed. The PMA and mean standardized uptake value (SUVmean) of the psoas muscle were measured at the L3 spine level on preoperative positron emission tomography/computed tomography images.
The mean age was 63.38 ± 8.47 years and male patients were 125 (95.4%). The pathological stage I, II and III were 38 (29.0%), 41 (31.3%) and 52 (39.7%), respectively. The mean body mass index (BMI), PMA and SUVmean of the psoas muscle were 59.50 ± 10.14, 14.42 ± 4.30 and 1.51 ± 0.27, respectively. Operative mortality occurred in 7 (5.3%) patients. The BMI and PMA were lower in patients with operative mortality than in patients who survived. The median follow-up time was 32.52 months. A multivariate analysis revealed that PMA was an adverse risk factor for overall survival (OS) (hazard ratio, HR = 0.930; P= 0.004), whereas BMI was related to OS. The 3-year OS rates were 64.9% in high-PMA (≥15.8) patients; however, it was only 37.1% in low-PMA (less than 15.8) patients (P= 0.002). Akaike information criterion was the lowest by including PMA in the multivariate model.
Decreased PMA was an adverse significant prognostic factor for OS in patients with oesophageal cancer.
INTRODUCTION
Oesophagectomy for oesophageal cancer is a very invasive procedure and is associated with high morbidity and mortality rates [1]. Also, preoperative weight loss and malnutrition due to an obstructive tumour is frequent in oesophageal cancer patients [2]. Because oesophageal resection for oesophageal cancer involves extensive reconstruction of the upper gastrointestinal tract, it also carries a risk of postoperative malnutrition with significant digestive problems, such as anastomotic strictures and gastro-oesophageal reflux [3]. In addition to these digestive problems, the invasive oesophageal surgery itself may eventually lead to a non-malignancy death related to malnutrition, pneumonia or cardiovascular disease, even in long-term survivors [4]. Thus, case selection for oesophagectomy has to be done carefully, considering the patient's underlying medical conditions to improve the long-term outcomes after oesophagectomy.
Malnutrition had been thought to be related to poor surgical outcomes and survival after the operation [5]. Sarcopenia is a recently suggested concept that can reflect malnutrition. Sarcopenia is a syndrome characterized by progressive and generalized loss of skeletal muscle mass and strength with a risk of adverse outcomes, such as physical disability, poor quality of life and even death [6]. Among the characteristics of sarcopenia, loss of skeletal muscle mass has been reported as a poor prognostic factor not only for patients with various cancers [7] but also for patients with liver cirrhosis and liver transplantation [8, 9]. In particular, the psoas muscle has been studied as a representative muscle, reflecting the status of the skeletal muscles of the whole body [10]. We hypothesized that preoperatively decreased psoas muscle area (PMA) might be related to poor survival after oesophagectomy in oesophageal cancer patients. Additionally, F-18 fluorodeoxyglucose positron emission tomography (18F-FDG PET) has been reported to be a valuable tool in monitoring age-related metabolic changes of skeletal muscles in a previous study [11], so we also hypothesized that the mean standardized uptake value (SUVmean) of the psoas muscle could be related to survival after oesophagectomy. Thus, this study was performed to investigate the prognostic value of PMA and SUVmean of the psoas muscle in patients with oesophageal cancer who underwent surgical treatment.
MATERIALS AND METHODS
Patients
The Institutional Review Board approved this retrospective study (AJIRB-MED-MDB-16-049). From 2004 to 2013, 131 patients who underwent transthoracic oesophagectomy and complete lymph node dissection for oesophageal cancer were retrospectively reviewed at the Ajou University School of Medicine. We analysed the medical records and pathological data, chest and abdominal computed tomography (CT) and PET/CT data retrospectively. Pathological stages were determined by the American Joint Committee on Cancer (AJCC) criteria (7th edition) [12]. After the operation, chest and abdominal CT scans were obtained at 6-month intervals, and PET/CT scans were obtained annually. Loco-regional recurrence was defined as recurrence at an anastomosis site, the mediastinum or the abdomen, where the dissections were performed. Distant recurrences were defined as those occurring outside the operative fields. The recurrence was diagnosed based on the PET/CT and chest CT scan results, and tissue biopsies were taken of suspected recurrent lesions if possible. Operative mortality was defined as in-hospital mortality after the initial operation. The adjuvant chemotherapy was performed in the presence of nodal metastasis. Adjuvant radiotherapy was performed in T3 or T4 lesion, or in case of R1 resection. Adjuvant chemoradiation therapy was performed in both cases. During the follow-up periods, we did not perform the nutritional interventions based on nutritional status or psoas muscle volume.
F-18 fluorodeoxyglucose positron emission tomography/computed tomography protocol
18F-FDG PET images were obtained using a Discovery ST or STE PET/CT scanner (GE Healthcare, Milwaukee, WI, USA). All patients were fasted at least 6 h and blood glucose concentration was measured before the administration of 18F-FDG. About 370 MBq of 18F-FDG was injected intravenously to patients whose blood glucose concentration was less than 150 mg/dl. After a rest at bed for 60 min in dimly lighted rooms, patients took 500 ml of water immediately before starting acquisition. At first, non-contrast CT images were acquired from skull base to upper thigh using the following parameters: 120 kV, 60 mA, 7.5 mm/rotation, tube rotation time = 1 s/rev, scan length = 867 mm, acquisition time = 60.9 s. Immediately after CT scanning, emission PET images of torso were obtained with a scan time of 3 min/frame and reconstructed using a CT attenuation map (field of view = 600 mm, slice thickness = 3.27 mm, OSEM with two iterations and 30 subsets). For quantitation, the patient's body weight and the injected dose were used to calculate SUV (g/ml).
Measurement of the psoas muscle area and mean standardized uptake value of psoas muscle
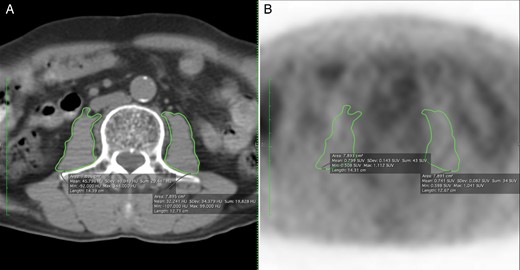
Representative cases of measuring the psoas muscle area. (A) The total psoas muscle area was 15.791 cm2. (B) The mean SUV was 7.892 in the same area. SUV: standardized uptake value.
Statistical analysis
Statistical analyses were performed using the open source ‘R’ (http://www.R-project.org). The continuous variables were described as means ± standard deviation, and categorical variables as frequencies (%). Overall survival (OS) was calculated from the operation to the date of any death or to the last follow-up. The ‘maxstat’ package in R for maximally selected rank statistics was used to find the optimal level of PMA. Survival curves were estimated using the Kaplan–Meier method, and survival differences between the groups were compared by the log-rank test. The Cox proportional hazard model was used to detect the independent prognostic factors. The parameters were included in the Cox proportional hazard model if the P-value was less than 0.2 on the univariate model or if it was a previously proven risk factor. All of the tests were two-sided, and P-values less than 0.05 were considered as statistical significance. The Akaike information criterion (AIC) was applied to compare the several statistical models. AIC was defined as AIC = −2 log (maximum likelihood) + 2 × (number of parameters in the model) and a smaller AIC value indicates a more desirable model for predicting survival.
RESULTS
General patient characteristics and early operative outcomes
General characteristics of patients
| Age (years) | 63.38 ± 8.47 |
| Gender (male/female) | 124 (95.4%)/6 (4.6%) |
| Body weight (kg) | 59.50 ± 10.14 |
| Body mass index (kg/m2) | 21.52 ± 3.00 |
| Psoas muscle area (cm2) | 14.42 ± 4.30 |
| SUVmean of psoas muscle (g/ml) | 1.51 ± 0.27 |
| Pathology | |
| Squamous cell carcinoma/others | 124 (94.7%)/8 (5.3%) |
| Location | |
| Upper | 15 (11.5%) |
| Mid | 70 (53.4%) |
| Lower | 46 (35.1%) |
| Pathological stage | |
| I II III | 38 (29.0%) 41 (31.3%) 52 (39.7%) |
| Differentiation | |
| Well differentiated | 11 (8.4%) |
| Moderately differentiated | 87 (66.4%) |
| Poorly differentiated | 22 (16.8%) |
| Not determined | 11 (8.4%) |
| Adjuvant therapy | 50 (38.2%) |
| Operative mortality | 7 (5.3%) |
SUVmean: mean standardized uptake value.
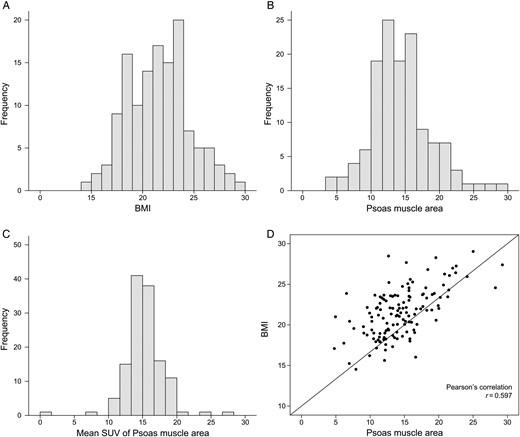
Histogram of BMI and core muscle area. (A) Histogram of BMI. (B) Histogram of psoas muscle area. (C) Histogram of SUVmean. (D) Correlation of BMI and psoas muscle area. BMI: body mass index; SUVmean: mean standardized uptake value.
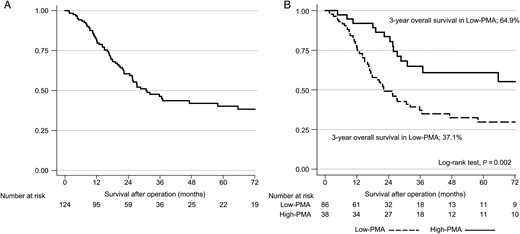
Survival curves. (A) Overall survival of all patients. (B) Survival differences according to the level of psoas muscle area.
Survival analysis and risk factors for overall survival
Among the 124 patients, univariate analyses revealed that pathological stage, adjuvant therapy, BMI and PMA were risk factors for OS (Table 2). The SUVmean of the psoas muscle was not a risk factor for OS in a univariate model; thus, SUVmean was not included in further multivariate models.
Cox proportional hazard models for predicting risk factors of overall survival in oesophageal cancer patients
| Univariate analysis | Multivariate analysis | |||||||
|---|---|---|---|---|---|---|---|---|
| Model 1 | Model 2; BMI model | Model 3; Muscle area model | ||||||
| HR (95% CI) | P-value | HR (95% CI) | P-value | HR (95% CI) | P-value | HR (95% CI) | P-value | |
| Age | 1.018 (0.989–1.047) | 0.220 | 1.023 (0.990–1.057) | 0.171 | 1.021 (0.988–1.056) | 0.214 | 1.012 (0.977–1.048) | 0.522 |
| Gender (male versus female) | 1.251 (0.455–3.444) | 0.664 | 1.201 (0.429–3.366) | 0.728 | 1.100 (0.387–3.124) | 0.858 | 0.725 (0.232–2.263) | 0.580 |
| Pathological stage | – | – | ||||||
| II (versus I) | 2.042 (0.949–4.396) | 0.068 | 2.050 (0.940–4.471) | 0.071 | 1.881 (0.856–4.135) | 0.116 | 2.003 (0.917–4.373) | 0.081 |
| III (versus I) | 6.045 (2.961–12.340) | <0.001 | 6.698 (3.034–14.788) | <0.001 | 6.033 (2.690–13.531) | <0.001 | 6.397 (2.878–14.222) | <0.001 |
| Adjuvant therapy | 1.845 (1.126–3.022) | 0.015 | 0.871 (0.485–1.567) | 0.646 | 0.922 (0.502–1.694) | 0.795 | 0.912 (0.502–1.657) | 0.762 |
| BMI | 0.904 (0.833–0.981) | 0.016 | – | – | 0.939 (0.858–1.028) | 0.171 | – | – |
| Muscle area | 0.928 (0.877–0.981) | 0.008 | – | – | – | – | 0.930 (0.868–0.997) | 0.040 |
| SUVmean of psoas muscle | 0.696 (0.293–1.657) | 0.413 | – | – | – | – | – | – |
| AIC | – | 529.92 | 530.21 | 527.47 | ||||
HR: hazard ratio; BMI: body mass index; SUVmean: mean standardized uptake value; AIC: Akaike information criterion; CI: confidence interval.
Several multivariate models were produced. Model 1 (age, gender, stage and adjuvant therapy) showed that pathological stage was a risk factor for OS (III versus I, hazard ratio, HR = 6.698; P< 0.001). In multivariate model 2 (age, gender, stage, adjuvant therapy and BMI), pathological stage (HR = 6.033; P< 0.001) was a risk factor for OS, whereas BMI was not (HR = 0.939; P= 0.171). In multivariate model 3 (age, gender, stage, adjuvant therapy and PMA), pathological stage (HR = 6.397; P< 0.001) and PMA (HR = 0.930; P= 0.04) were risk factors for survival. The AICs of Models 1, 2 and 3 were 529.92, 530.21 and 527.47, respectively. The AIC of Model 3 was slightly lower than that of Model 1, which means that the multivariate model with PMA can predict survival better than the model without PMA. The AIC of Model 2 was slightly higher compared with that of Model 1, which means that the multivariate model with BMI did not predict survival better than the model without PMA.
The optimal PMA cut-off value was 15.8, according to the maximally selected rank statistics; thus, the 124 patients were divided into low-PMA (86 patients, 69.4%) and high-PMA (38 patients, 30.6%) groups. The 3-year OS rates were 37.1% in the low-PMA group and 64.9% in the high-PMA group (Fig. 3B, P = 0.002).
DISCUSSION
This study showed that decreased PMA was associated with poor survival after the surgical treatment of oesophageal cancer, whereas BMI and SUVmean of the psoas muscle were unrelated to survival. Regarding short-term outcomes, BMI and PMA were significantly lower in patients with operative mortality than in patients without.
Sarcopenia is characterized by a lower skeletal muscle quantity, more fat accumulation in the muscle, lower muscle strength, lower physical performance and changes in circulating biological markers [6, 13]. Although sarcopenia has been regarded as being related to natural ageing, it is also relevant to the diminished homeostatic reserve seen in chronic illnesses and organ failure [14]. According to the definition of The European Working Group on Sarcopenia in Older People (EWSGSP), the diagnosis of sarcopenia is defined based on the documentation of low muscle mass with low muscle strength or low physical performance [6]. For a retrospective study, low muscle mass can be diagnosed from preoperative CT, although information on muscle strength and physical performance has to be obtained in a prospective manner. Thus, several retrospective studies have focused only on the loss of muscle area, especially in the psoas muscle. There are several rationales for selecting the psoas muscle in evaluating muscle area. First, changes in the size of muscles of the trunk are thought to best reflect global health and long-term chronic illness [13], and the psoas muscle is a core muscle that is relatively uninfluenced by deliberate weight training and exercises. Second, it is not surrounded by other muscles or bony anatomy that would obscure isolation of the muscle from structures of similar radiodensity [10]. The loss of skeletal muscle mass has been identified as a poor prognostic factor not only for patients with various cancers [7] but also for those with liver cirrhosis and liver transplantation [8, 9]. Regarding oesophageal cancer, Sheetz et al. [10] reported that lean PMA appeared to be an independent predictor of both OS and disease-free survival, and was as significant as tumour stage, in patients who underwent transhiatal oesophagectomies. Ida et al. [15] analysed 23 patients who underwent neoadjuvant chemoradiotherapy followed by oesophagectomy and reported that changes in body composition parameters, including skeletal muscles, were possible predictive markers of postoperative complications after oesophagectomy. Our data also showed that low PMA was a poor prognostic factor for OS after oesophagectomy. Although our data were similar to these two previous reports, there were also several differences. Sheetz et al. [10] mainly analysed patients who received neoadjuvant therapy (71.4%) with oesophageal adenocarcinomas (89.1%), whereas our patients mainly had oesophageal squamous cell carcinomas and did not receive neoadjuvant therapy. In the report by Ida et al., all patients received neoadjuvant therapy, whereas we analysed neoadjuvant-naïve patients. In our study, BMI was not a significant prognostic factor in multivariate models, consistent with a previous report by Grotenhuis et al. [16]. They analysed 556 patients who underwent oesophagectomies and concluded that BMI was not of prognostic value with regard to short- or long-term outcome in patients who underwent oesophagectomies for cancer. We consider that muscle area is a more important factor than body weight or BMI. For example, body weight and BMI could be normal or increased even though the muscle volume is decreased in the case of sarcopenic obesity.
Possible explanations regarding the relationship between muscle area and survival may include the following. As described earlier, changes in the size of muscles of the trunk are thought to best reflect global health and long-term chronic illness [13]. The muscle area decreases with the ageing process, but it is also reduced in cases of chronic disease, malignancies and malnutrition. Especially in oesophageal cancer, the decreased skeletal muscles might reflect such preoperative malnutrition. Furthermore, skeletal muscle was recently identified as an endocrine organ [17]. It has therefore been suggested that cytokines and other peptides are produced, expressed and released by muscle fibres. These myokines have been suggested to play an important role in, or to be related to, several diseases, such as metabolic diseases, cancer, hypertension and atherosclerosis [18]. Decreased muscle volume and myokines might lead to the development of concurrent disease in patients with oesophageal cancer.
FDG is actively transported into the intracellular space by glucose transporter (GLUT) and then phosphorylated to FDG-6-phosphate by hexokinase. Many types of tumours express GLUT1 and hexokinase II, which enables 18F-FDG PET/CT to be used in the detection of the primary tumour and recurrences, staging, treatment monitoring and prognostic evaluation [19]. In human skeletal muscles, three isotypes of GLUT (GLUT1, GLUT3 and GLUT4) are expressed during the gestational period. After birth, only GLUT4 is distributed at a significant level and plays an important role in glucose metabolism [20]. Skeletal muscles show low 18F-FDG uptake unless they are simulated by exercise or involved in cancer/inflammation [21]. To date, few studies have provided evidence that 18F-FDG PET was useful to evaluate glucose metabolism of skeletal muscles. The changes in glucose transport and phosphorylation in skeletal muscles as a response to an insulin stimulus can be assessed by 18F-FDG uptake [22]. 18F-FDG PET is a valuable tool for monitoring age-related metabolic changes in skeletal muscles [11]. It has also been shown that it is feasible to use 18F-FDG PET to detect and quantify changes in the metabolic activity of skeletal muscles after chemotherapy [23]. Moreover, skeletal muscle glucose metabolism assessed by 18F-FDG has minimal variability under basal conditions and the SUV was reproducible [24]. Thus, in the current study, we investigated whether 18F-FDG uptake by skeletal muscle had prognostic significance in oesophageal cancer. However, unlike our initial hypothesis, preoperative SUVmean of psoas muscles showed no relationship with OS in oesophageal cancer. This result is consistent with the previous outcome of a murine adenocarcinoma model; glucose uptake in muscle, revealed by 18F-FDG, was unaffected by cachexia [25]. While 18F-FDG uptake in tumour, brain and lung was significantly increased in the cachectic model, 18F-FDG uptake in muscle was largely unaltered. It is also possible to ascribe the failure of SUVmean in predicting the survival of oesophageal cancer to represent a technical limitation in drawing the ROI. The psoas muscle exhibits normally low 18F-FDG uptake, whereas adjoining organs, such as the bowels and ureter, have higher 18F-FDG uptake. We modified ROIs and consequently removed spillover activity from the ureter. However, in some cases, this was not performed ideally because bowel activity was poorly delineated.
This study had several limitations. First, we measured only one component of sarcopenia. Decreased skeletal muscle does not actually reflect the whole definition of sarcopenia. However, measurement of muscle mass by preoperative CT is simple, although information on muscle strength and physical performance requires additional efforts. Second, future work will need to assess other attributes of muscle deterioration, such as fat infiltration and fibrosis of the muscle. A lower muscle density indicates a higher intramuscular fat content, which may be detrimental for muscle function [13]. Finally, we report on a relatively small cohort of patients from a single centre. Future studies should include a larger sample size and multiple institutions. Especially, the small differences in the AIC between multivariate models 1 and 3 may be a result of the small numbers of patients. In spite of these limitations, this study can suggest the needs of perioperative nutritional therapy for sarcopenia patients. Nishigori et al. [26] reported that sarcopenia was associated with a high adjusted risk of one or more pulmonary complications after oesophagectomy for oesophageal cancer for Thoracic Esophageal Cancer. In their paper, they performed preoperative nutritional therapy for 20 patients (10%) in the sarcopenia group. Among the 20 patients, 3 (15%) who received nutrition therapy developed pulmonary complications, whereas 44 out of 129 patients (34%) who did not receive nutrition therapy developed complications (RR: 0.44, 95% CI: 0.15–1.28, P= 0.09) [26]. This preliminary data showed that preoperative nutritional therapy for sarcopenia patients might improve the surgical outcomes, even though this result has to be verified in prospective setting. We think that perioperative nutritional therapy might improve the OS after oesophagectomy.
CONCLUSION
In conclusion, decreased PMA was associated with poor survival after the surgical treatment of oesophageal cancer, whereas BMI and the SUVmean of the psoas muscle were unrelated to survival. In patients with decreased preoperative PMA, postoperative care has to be done carefully, not only in the immediate postoperative period but also in the long-term follow-up period.
Funding
This work was supported by the new faculty research fund of Ajou University School of Medicine.
Conflict of interest: none declared.
REFERENCES
APPENDIX. CONFERENCE DISCUSSION
Dr A. Baram(Sulaymaniyha, Iraq): Why is the psoas muscle used? Why not the pectoralis muscle, or the gluteus maximus muscle, for example?
Dr Park: There is actually no gold standard for diagnosing sarcopenia. Some papers use the psoas muscle area because it is not influenced by exercise, and it can be evaluated very precisely because it has very well defined adjacent organs.
Dr T. Lerut(Leuven, Belgium): It is a very intriguing study. It is not so new, actually. I remember that Mark Orringer did a similar study some years ago.
My question relates to the use of the psoas muscle, because your typical population is a population aged over 65, and that is an age at which a number of people will have vertebral column problems, like discus hernias, and thus will be handicapped and therefore less mobile, which may affect the morphology of the psoas muscle. Did you look at this in your population, how many patients did have low back pain problems, discus hernias and so on?
Dr Park: Actually we did not check those points.
Dr Lerut: Maybe you should.
Dr Park: Yes.
Dr M. Ferguson(Chicago, IL, USA): In the West we are finding good correlations, with regard to complications, between lean muscle area, low density muscle area, overall muscle area, subcutaneous fat area, visceral fat area, and cortical density of the vertebral bodies.
Have you looked at any of those individual factors to see if they correlate better with the outcomes in these patients?
Dr Park: We saw some papers about what you mentioned, but we didn't undertake the analysis.
Dr Ferguson: Ultimately this is going to be an automated process that we could use for prognostication in some of our patients.
Author notes
Presented at the 24th European Conference on General Thoracic Surgery, Naples, Italy, 29 May–1 June 2016.
