


Abstract
Plasma troponins, measured by fourth-generation assays, are associated with increased mortality and morbidity after cardiac surgery. They also offer predictive information in addition to EuroSCORE, a widely used risk model after cardiac surgery. However, preoperatively measured troponin has provided no additional information to postoperative values. Whether these facts hold true also for the high-sensitivity fifth-generation troponin assay and the better calibrated risk model, EuroSCORE II, is unknown. We hypothesized that preoperative and/or postoperative high-sensitivity troponin T (hs-TnT) would increase the predictive value of EuroSCORE II.
Consecutive coronary artery bypass grafting (CABG) and other cardiac surgical patients were prospectively enrolled in a university hospital. Plasma samples and EuroSCORE II variables were collected. The primary and secondary end-points were 180-day mortality and any major adverse event within 30 days, and 961-day mortality. The data were analysed by Kaplan–Meier survival curves, regression analyses, receiver operator characteristic curves and decision curve analysis.
Mortality rates in 180 days were 3.5% (15/428) in CABG and 6.4% (14/220) in other cardiac surgical patients. Survival curves differed only in patients with not only high postoperative hs-TnT value (>500 ng/l), but also high preoperative hs-TnT value (>14 ng/l), compared with patients with both hs-TnT values low. Adding hs-TnT to EuroSCORE II improved the prediction of 180-day mortality in other cardiac surgical patients (maximum net benefit of 1.5%), but not in CABG patients. Regarding major adverse events, adding hs-TnT to EuroSCORE II improved the prediction in both CABG patients and other cardiac surgical patients (maximum net benefits of 3 and 7%).
Elevated postoperative hs-TnT was predictive of mortality only when combined with elevated preoperative hs-TnT. Hs-TnT measurements added information to the EuroSCORE II regarding major adverse events in all cardiac surgical patients and regarding 180-day mortality in non-CABG patients.
INTRODUCTION
Release of troponin T (TnT) into the plasma both pre- and postoperatively, measured by fourth-generation assays, has been associated with increased morbidity and mortality after cardiac surgery [1–5]. Preoperative TnT has not provided any additional predictive value to postoperative TnT values [4]. However, after percutaneous coronary intervention, preoperative troponins, especially with very low cut-off value, have shown greater importance than postoperative values [6]. Currently, most European laboratories are using the fifth-generation high-sensitivity TnT assay (hs-TnT), which permits detection of minor myocardial injury. Detection of low-grade TnT release before cardiac surgery may provide additional predictive information to that obtained from postoperative values.
EuroSCORE has been a widely used risk model in cardiac surgery [7]. Previously, TnT has been reported to provide additional predictive information to EuroSCORE [8]. However, due to changes in patient profiles and advances in treatment, the EuroSCORE overestimates mortality and, therefore, a new better calibrated EuroSCORE II was launched in 2011 [9].
Accordingly, we aimed to assess clinical usefulness of hs-TnT sampling by evaluating, firstly, whether preoperative hs-TnT provides incremental predictive information to postoperative hs-TnT and, secondly, whether either preoperative or postoperative hs-TnT provide incremental predictive information to EuroSCORE II regarding 180-day mortality and 30-day major adverse events (MAEs) in cardiac surgical patients.
METHODS
Study design
This FINNAKI-HEART was a prospective observational study to evaluate the predictive value of myocardial biomarkers. It was a single-centre sub-study of a prospective observational multicentre FINNAKI study [10] concentrating on the kidney. The Ethics Committee in Helsinki University Hospital approved the study. Informed consent was obtained from each patient or their next of kin.
Patients
This study consists of two cohorts of cardiac surgical patients—due to presumably different biomarker profiles: (i) consecutive coronary artery bypass grafting (CABG) patients from 1 September 2011 to 20 June 2012 (a 10-month period), and (ii) consecutive other cardiac surgical patients, except transplantations, implantation of ventricular assist devices and trans-femoral valve implantations, from 1 September 2011 to 31 January 2012 (a 5-month period). Exclusion criteria for both groups were refusal of transfusions, permanent residency abroad or insufficient local language skills, not admitted to intensive care unit (ICU) and no informed consent.
CABG was defined as coronary surgery with no other procedure, except pulmonary vein isolations for selected patients. Other cardiac surgery included all the other procedures performed on patients included in the study.
Biomarkers
We obtained blood samples from artery cannulas before anaesthesia induction and in the first postoperative morning. Plasma was separated, stored in −80°C and shipped on dry ice to Akershus University Hospital for analyses. Hs-TnT levels were determined on an auto-analyser (Cobas e 411) by the commercial assay (Roche Diagnostics, Penzberg, Germany). The lower detection limit is 3 ng/l, and the 99th percentile value with <10% coefficient of variance in healthy subjects is 14 ng/l. The MB fraction of creatinine kinase (CK-MBm) was routinely analysed on the first postoperative morning.
End-points
The primary end-point was all-cause death within 180 days after surgery. By the time we received the 1-year mortality figures for the main FINNAKI study, these sub-study patients were only followed for 6 months. The secondary end-point was any MAE (defined as any cardiac, or neurological complication in the ICU, or renal complication within 5 days, or death, or readmission in the ICU within 30 days after surgery). Cardiac complications comprised postoperative low cardiac output defined as inotropes and/or assist device after the first postoperative morning, or rhythm disturbances demanding treatment other than haemodynamically stable atrial fibrillation. Neurological complications included stroke, transient ischaemic attack or delirium delaying transfer to the ward. Renal complication was defined as KDIGO stage 2–3 acute kidney injury, by either urine output or creatinine, or both criteria [11]. Baseline creatinine was defined as previously published [10].
Data collection
Routine demographic and physiological data were prospectively collected to the Finnish Intensive Care Consortium database (Tieto Ltd, Helsinki, Finland). Mortality within 180 days was obtained from Population Register Centre. For clinical variables we used an additional study-specific case report form, as well as electronic anaesthesia and intensive care patient data management system (PICIS, Wakefield, MA, USA, and Dräger Medical, Lübeck, Germany) and electronic case histories.
We performed the study sample size calculation based on logistic regression analysis of three variables (EuroSCORE II, pre- and postoperative hs-TnT) and 180-day mortality (5% in 2005) after CABG (the primary study population). There should be at least eight primary end-points (i.e. deaths) for each variable [12]. Thus, we estimated that 480 CABG patients (24 deaths) would be adequate. Additionally, to increase the number of end-points, we used a secondary longer follow-up (∼2.5 years).
Statistical analysis
Variables are expressed as medians and interquartile ranges. For comparisons of continuous variables we used the Mann–Whitney U-test, and for categorical data, the χ2 test or Fisher's exact test, when appropriate. Two-sided P value of <0.05 was considered significant.
Firstly, we explored the association of hs-TnT with outcome by Kaplan–Meier plots comparing groups by the Breslow test. For these analyses, we divided patients into four groups according to preoperative (Low/High) and postoperative (Low/High) hs-TnT values. The threshold for preoperative values was the 99th percentile upper reference limit (URL) of the current assay (14 ng/l). For postoperative values, we used a threshold of 500 ng/l that has previously been predictive of mortality [13]. Then, we repeated the analysis using another previously suggested higher postoperative threshold of 1400 ng/l (100 × URL) [14].
Secondly, we analysed pre- and postoperative hs-TnT and EuroSCORE II as covariates (as continuous variables) by logistic regression using separately 180-day mortality and 30-day MAEs as the end-points.
Thirdly, we calculated areas under the curve of receiver operator characteristics (AUROC) of EuroSCORE II, pre- and postoperative hs-TnT, and postoperative CK-MBm. Fourthly, we created several logistic regression models: EuroSCORE II was recalibrated to predict separately 180-day mortality and MAEs in our data set by using EuroSCORE II as the only covariate in the analyses, and combined models were created by using EuroSCORE II with pre- and postoperative hs-TnT, and with postoperative CK-MBm as covariates (as continuous variables). Fifthly, we report cut-off points for troponins at negative predictive values of 90% when appropriate.
Sixthly, AUROCs were explored by non-parametric pair-wise comparisons. Seventhly, to overcome the insensitivity of the comparison between AUROCs, and to assess the clinical utility of the information gained by combined models, we used decision curve analysis [15]. Eighthly, all the analyses were repeated with the 2.5-year (961-day) mortality as the end-point. As a sensitivity analysis, Kaplan–Meier curves and AUROCs were re-analysed after exclusion of patients with atrial ablation procedures.
Statistical analyses were made by IBM SPSS Statistics 22, MedCalc Statistical Software 13.0 (MedCalc Software bvba, Ostend, Belgium); and R 3.1.0 (R Development Core Team, Vienna, Austria).
RESULTS
During the study period, 428 CABG patients and 220 other cardiac surgical patients were included (Fig. 1). Of the other cardiac surgical patients, 140 (63.6%) had only valve surgery, 53 (24.1%) had valve and coronary surgery, 16 (7.3%) had surgery on the thoracic aorta and 11 (5.0%) had other procedures. Demographic and perioperative variables are presented in Table 1. The predetermined preoperative threshold value (14 ng/l) for hs-TnT was exceeded in 225/416 (54%) of CABG patients, and in 100/209 (48%) of other cardiac surgical patients. In 165/423 (39%) of CABG patients and in 130/212 (61%) of other cardiac surgical patients the postoperative hs-TnT exceeded the predetermined primary threshold (500 ng/l).
Patient characteristics and perioperative variables in numbers (percentage) and medians [interquartile range]
| Coronary artery bypass grafting | Other cardiac surgery | |
|---|---|---|
| Patient characteristics | ||
| No. of patients | 428 | 220 |
| Age (years) | 68 [61–75] | 67 [58–78] |
| Female sex | 86 (20.1) | 76 (34.5) |
| Body mass index | 27.7 [24.6–31.0] | 25.6 [23.4–29.4] |
| Hypertension | 294 (68.7) | 124 (56.4) |
| LVEF (>50, 31–50, 21–30, <20) | 291, 114, 20, 3 (68.0, 26.6, 4.7, 0.7) | 181, 33, 5, 1 (82.3, 15.0, 2.3, 1.0) |
| Peripheral vascular disease | 84 (19.6) | 24 (10.9) |
| Chronic obstructive pulmonary disease | 46 (10.7) | 18 (8.2) |
| Insulin-dependent diabetes mellitus | 51 (11.9) | 13 (5.9) |
| GFR/ml/min (Cockcroft-Gault) | 83 [66–111] | 79 [60–102] |
| NYHA class 1–4 | 16, 114, 165, 133 (3.7, 26.6, 38.6, 31.1) | 1, 30, 84, 70 (0.5, 13.6, 38.2, 31.8) |
| CCS class 4 | 186 (43.5) | 16 (7.3) |
| Active endocarditis | 0 (0) | 11 (5.0) |
| Poor mobility | 8 (1.9) | 6 (2.7) |
| Prior cardiac surgery | 3 (0.7) | 20 (9.1) |
| Urgency (elective, urgent, emergency, salvage) | 215, 185, 27, 1 (50.2, 43.2, 6.3, 0.2) | 169, 29, 21, 1 (76.8, 13.2, 9.5, 0.5) |
| Cardiogenic shock | 7 (1.6) | 9 (4.1) |
| Intra-aortic balloon pump | 13 (3.0) | 7 (3.2) |
| Preoperative hs-TnT (ng/l) | 15 [8–71] | 13 [8–28] |
| EuroSCORE II | 2.2 [1.2–4.3] | 2.6 [1.5–6.6] |
| Perioperative variables | ||
| Aortic occlusion time (min) | 59 [45–74] | 90 [64–122] |
| Cardiopulmonary bypass time (min) | 84 [65–102] | 132 [96–171] |
| Postoperative variables | ||
| Postoperative hs-TnT (ng/l) | 364 [224–806] | 603 [379–1124] |
| Postoperative CK-MBm | 14 [9–26] | 23 [16–42] |
| Complications | ||
| Cardiac in the ICU | 68 (15.9) | 65 (29.5) |
| Neurologic in the ICU | 31 (7.2) | 19 (8.6) |
| Renal in 5 days | 29 (6.8) | 28 (13.2) |
| Readmission in the ICU in 30 days | 24 (5.6) | 3 (3.2) |
| Major adverse event in 30 days | 108 (25.2) | 86 (39.1) |
| 30-day mortality | 7 (1.6) | 7 (3.2) |
| 180-day mortality | 15 (3.5%) | 14 (6.4%) |
| 961-day mortality | 34 (7.9%) | 28 (12.7%) |
CCS: Canadian Cardiovascular Society Angina Scaling Score; CK-MBm: MB fraction of creatine kinase; GFR: glomerular filtration rate; hs-TnT: high-sensitivity cardiac troponin T; ICU: intensive care unit; LVEF: preoperative left ventricular ejection fraction; NYHA: New York Heart Association Functional Classification of Heart Failure Symptoms.
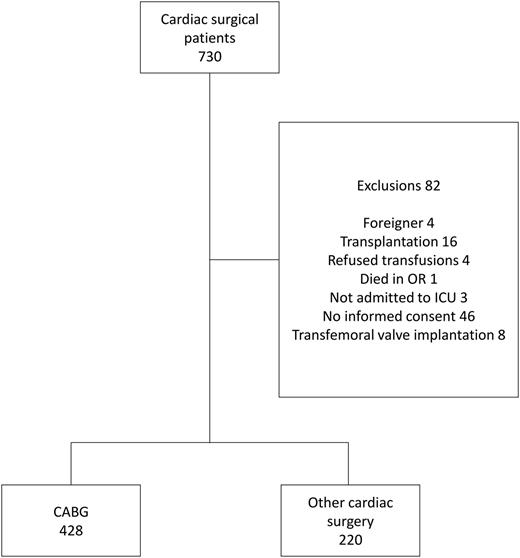
Flow chart. OR: operating room; ICU: intensive care unit; CABG: coronary artery bypass grafting.
One hundred and eighty-day (and 30-day) mortality
During 180 days, 15/428 (3.5%) of CABG patients and 14/220 (6.4%) of other cardiac surgical patients died (Table 1). The causes of death after CABG were ischaemic heart disease for 11/15 (73.3%) patients, and peripheral vascular disease, abdominal vascular disease, intracranial haemorrhage and accidental death under the influence of alcohol, each for 1/15 (6.7%) patients. Patients undergoing other cardiac surgery died of ischaemic heart disease [7/14 (50.0%)], of heart disease related to the aortic valve [4/14 (28.6%)], and of the remaining 3 patients, [1/14 (7.1%)] each died of the following reasons: stroke, sepsis after long ICU stay and pneumonia after diagnosis of renal cancer. The 30-day mortality rates were 1.6 and 3.2%, and mean expected in-hospital mortality rates according to EuroSCORE II were 4.8 and 6.1%, respectively.
The Kaplan–Meier plots are presented in Fig. 2. Only the High–High hs-TnT group had higher mortality than the Low–Low hs-TnT group with regard to both CABG (10/113 vs 1/141, Breslow test P = 0.002) and other cardiac surgical patients (9/62 vs 1/45, Breslow test P = 0.03). Medians of postoperative hs-TnT did not differ between the Low–High and High–High groups (in CABG 950 vs 1051 ng/l, P = 0.73; in other cardiac surgery 865 vs 917 ng/l, P = 0.86). These results remained despite changing the cut-off value for postoperative hs-TnT (1400 ng/l), except that also the High–Low hs-TnT group differed from the Low–Low hs-TnT group (P = 0.035) with regard to CABG patients.
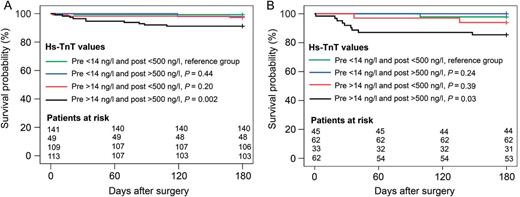
Kaplan–Meier survival curves in 180 days for CABG (A) and other cardiac surgical (B) patients. Groups were formed according to preoperative and postoperative hs-TnT values, and compared with the Low–Low hs-TnT group by the Breslow test. We omitted cases due to missing troponin values: 3.7% (16/428) in the CABG group and 8.2% (18/220) in the other cardiac surgery group. hs-TnT: high-sensitivity troponin T; CABG: coronary artery bypass grafting.
By multivariable logistic regression, of EuroSCORE II (per percentage) and pre- and postoperative hs-TnT (per 10 ng/l), only EuroSCORE II [odds ratio (OR) 1.069, 95% confidence intervals (95% CI) 1.028–1.112, P = 0.001] was independently associated with 180-day mortality in CABG patients. In other cardiac surgical patients both EuroSCORE II (OR 1.071, 95% CI 1.020–1.126, P = 0.006) and preoperative hs-TnT (OR 1.021, 95% CI 1.003–1.041, P = 0.026) were independently associated with 180-day mortality.
According to AUROCs (Table 2), EuroSCORE II, preoperative and postoperative hs-TnT predicted mortality in CABG patients, whereas CK-MBm did not. In other cardiac surgical patients, all the markers predicted mortality, but EuroSCORE II and preoperative hs-TnT were superior predictors. The models with EuroSCORE II and biomarkers had comparable AUROCs with EuroSCORE II alone.
Areas under the curve of EuroSCORE II, troponins and CK-MB, and combined models of EuroSCORE II and biomarkers regarding 180-day mortality
| Predictor for 180-day mortality | Coronary artery bypass grafting | Other cardiac surgery | ||
|---|---|---|---|---|
| AUROC | 95% CIs | AUROC | 95% CIs | |
| EuroSCORE II versus biomarkers | ||||
| EuroSCORE II | 0.788* | 0.745–0.826 | 0.887**,*** | 0.834–0.927 |
| Preoperative hs-TnT | 0.768**** | 0.724–0.808 | 0.891*****,****** | 0.839–0.931 |
| Postoperative hs-TnT | 0.750******* | 0.705–0.791 | 0.691**,***** | 0.622–0.755 |
| Postoperative CK-MBm | 0.521*,****,******* | 0.471–0.570 | 0.714***,****** | 0.646–0.776 |
| EuroSCORE II versus combined models | ||||
| EuroSCORE II | 0.788 | 0.745–0.826 | 0.887 | 0.834–0.927 |
| EuroSCORE II + preoperative hs-TnT | 0.803 | 0.761–0.841 | 0.893 | 0.842–0.932 |
| EuroSCORE II + postoperative hs-TnT | 0.807 | 0.765–0.844 | 0.866 | 0.810–0.910 |
| EuroSCORE II + preoperative hs-TnT and postoperative hs-TnT | 0.808 | 0.766–0.845 | 0.885 | 0.833–0.926 |
| EuroSCORE II + postoperative CK-MBm | 0.783 | 0.740–0.822 | 0.868 | 0.813–0.911 |
We omitted cases due to missing troponin values: 3.7% (16/428) in the CABG group and 8.2% (18/220) in the other cardiac surgery group.
Pair-wise comparisons of AUROCs were performed, and P values of <0.05 are presented.
AUROC: area under receiver operator characteristic curve; CI: confidence interval; CK-MBm: MB fraction of creatine kinase; hs-TnT: high-sensitivity troponin T; CABG: coronary artery bypass grafting.
*P = 0.031.
**P = 0.023.
***P = 0.017.
****P = 0.026.
*****P = 0.015.
******P = 0.020.
*******P = 0.002.
In CABG patients, no difference was found between the net benefits of models with EuroSCORE II alone and the models combined with biomarkers, judged by decision curve analysis (Fig. 3A). In other cardiac surgery, the diagnostic net benefit was highest (maximum net benefit 1.5% compared with EuroSCORE II alone) for the model including EuroSCORE II and both troponins at threshold probabilities higher than 9% (Fig. 3B).
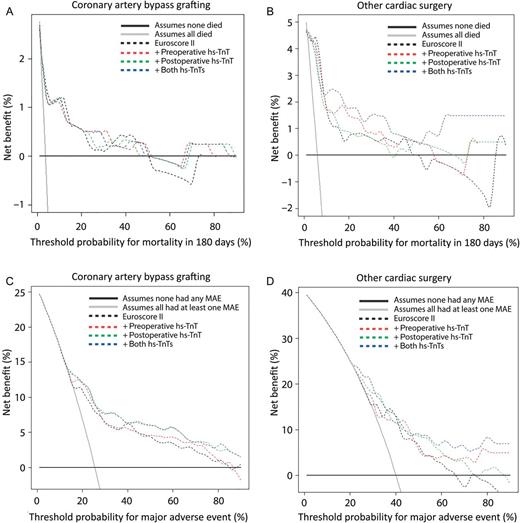
Decision curve analyses presenting net benefit in identifying patients who will die in 180 days (A and B) or will have at least one major adverse event (C and D) after surgery. Net benefits were assessed for prediction models of EuroSCORE II alone, and models of EuroSCORE II added with preoperative or postoperative, or both pre- and postoperative hs-TnT in CABG (A and C) and other cardiac surgical (B and D) patients. We omitted cases due to missing troponin values: 3.7% (16/428) in the CABG group and 8.2% (18/220) in the other cardiac surgery group. hs-TnT: high-sensitivity troponin T; CABG: coronary artery bypass grafting.
Thirty-day major adverse event
Of 428 CABG patients, 112 (26.2%) patients and 87 of the 220 (39.5%) other cardiac surgical patients had at least one MAE during 30 days. By multivariable logistic regression, only EuroSCORE II (OR per percentage increase 1.091, 95% CI 1.040–1.143, P < 0.001) and postoperative hs-TnT (OR per 10 ng/l increase 1.009, 95% CI 1.005–1.013, P < 0.001) were independently associated with MAEs in CABG patients. In contrast, both preoperative hs-TnT (OR 1.231, 95% CI 1.032–1.469, P = 0.021) and postoperative hs-TnT (OR 1.006, 95% CI 1.002–1.009, P = 0.003) independently predicted MAEs in other cardiac surgical patients.
In CABG patients, according to AUROCs (Table 3), CK-MBm was inferior in predicting MAEs compared with EuroSCORE II and hs-TnT, whereas in other cardiac surgical patients CK-MBm was inferior compared with postoperative hs-TnT. Of the combined models with EuroSCORE II and biomarkers predicting MAEs, only EuroSCORE II combined with preoperative hs-TnT in CABG patients predicted better compared with EuroSCORE II alone.
Areas under the curve of EuroSCORE II, troponins and CK-MB, and combined models of EuroSCORE II and biomarkers regarding major adverse event
| Predictor for major adverse events | Coronary artery bypass grafting | Other cardiac surgery | ||
|---|---|---|---|---|
| AUROC | 95% CIs | AUROC | 95% CIs | |
| EuroSCORE II versus biomarkers | ||||
| EuroSCORE II | 0.728* | 0.682–0.771 | 0.694 | 0.624–0.757 |
| Preoperative hs-TnT | 0.737** | 0.691–0.779 | 0.654 | 0.584–0.720 |
| Postoperative hs-TnT | 0.699*** | 0.651–0.743 | 0.665**** | 0.595–0.730 |
| Postoperative CK-MBm | 0.588*,**,*** | 0.539–0.637 | 0.593**** | 0.521–0.662 |
| EuroSCORE II versus combined models | ||||
| EuroSCORE II | 0.728***** | 0.682–0.771 | 0.694 | 0.624–0.757 |
| EuroSCORE II + preoperative hs-TnT | 0.750***** | 0.705–0.791 | 0.670****** | 0.600–0.735 |
| EuroSCORE II + postoperative hs-TnT | 0.750 | 0.705–0.791 | 0.716 | 0.648–0.777 |
| EuroSCORE II + preoperative + postoperative hs-TnT | 0.750 | 0.704–0.791 | 0.736****** | 0.669–0.796 |
| EuroSCORE II + postoperative CK-MBm | 0.756 | 0.711–0.797 | 0.697 | 0.628–0.760 |
We omitted cases due to missing troponin values: 3.7% (16/428) in the CABG group and 8.2% (18/220) in the other cardiac surgery group.
Pair-wise comparisons of AUROCs were calculated and P values of <0.05 are presented.
AUROC: area under receiver operator characteristic curve; CI: confidence interval; CK-MBm: MB fraction of creatine kinase; hs-TnT: high-sensitivity troponin T; CABG: coronary artery bypass grafting.
*P = 0.003.
**P < 0.001.
***P < 0.001.
****P = 0.025.
*****P = 0.048.
******P = 0.029.
According to the receiver operator characteristic analysis in CABG patients, negative predictive value (NPV) of 90% (95% CI 83–95%) for preoperative hs-TnT was reached at the cut-off of 9 ng/l. For postoperative hs-TnT the corresponding values were 89% (95% CI 77–97%) and the cut-off 159 ng/l. In other cardiac surgical patients, NPVs of 90% could not be verified.
In CABG patients, the net benefit of the models was highest (net benefit maximum 3% compared with EuroSCORE II alone) when either postoperative hs-TnT, or both pre- and postoperative hs-TnT were added (at threshold probabilities of 13% or higher) (Fig. 3C). In other cardiac surgery, the net benefit of the models was highest in the model with EuroSCORE II and both troponins (net benefit maximum 8% compared with EuroSCORE II alone, or assuming none experienced MAEs) at threshold probabilities higher than 40% (Fig. 3D).
Influence of atrial ablation
Those undergoing atrial ablation (8/428 (1.9%) in the CABG group and 17/220 (7.7%) in the other cardiac surgery group) had higher postoperative hsTnT (Supplementary Table 1). After exclusion of patients with atrial ablation, point estimates for AUROCs of hs-TnT and CK-MBm as separate variables predicting 180-day mortality in other cardiac surgery were better, but combined models remained the same (Supplementary Table 2). Point estimates for AUROCs of hs-TnT and CK-MBm predicting MAEs seemed worse after exclusions, and combined models remained essentially the same (Supplementary Table 3). Also, Kaplan–Meier curves did not change meaningfully either in coronary or other cardiac surgery.
2.5-year (961-day) mortality
Mortality rates approximately doubled between days 180 and 961 after surgery (Table 1). In Kaplan–Meier plots for 961-day mortality (Fig. 4) the High–Low groups approached the High–High groups, and in other cardiac surgery, the High–Low and High–High groups differed significantly from the Low–Low group. In logistic regression, assessing associations of EuroSCORE II, preoperative hs-TnT and postoperative hs-TnT with 961-day mortality, the results were similar to those for 180-day mortality. According to AUROCs, EuroSCORE II and preoperative hs-TnT predicted 961-day mortality, and also postoperative hs-TnT in CABG patients. All the combined models predicted 961-day mortality, although none of them rose above EuroSCORE II alone. According to decision curve analysis, no superior net benefit was gained from combined models compared with EuroSCORE II alone.
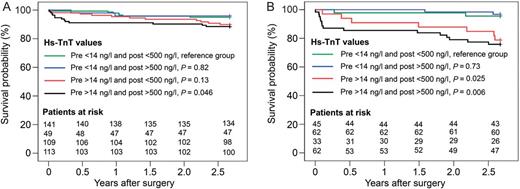
Kaplan–Meier survival curves in 2.5 years for CABG (A) and other cardiac surgical (B) patients. Groups were formed according to preoperative and postoperative hs-TnT values and compared with the Low–Low hs-TnT group by the Breslow test. We omitted cases due to missing troponin values: 3.7% (16/428) in the CABG group and 8.2% (18/220) in the other cardiac surgery group. hs-TnT: high-sensitivity troponin T; CABG: coronary artery bypass grafting.
DISCUSSION
In this prospective single-centre observational study of cardiac surgical patients, postoperative hs-TnT over 500 ng/l increased the risk of death within 180 days, and also within 961 days, only when combined with elevated preoperative hs-TnT exceeding 14 ng/l. However, EuroSCORE II was a strong predictor of 180-day mortality, and hs-TnT provided additional predictive information in non-CABG cardiac surgical patients only. Furthermore, we found that pre- and postoperative hs-TnT values improved the predictive ability of EuroSCORE II for MAEs.
Postoperative high-sensitivity troponin T
Previous studies have shown that TnT measured by prior generation assays improves the EuroSCORE-based prediction of mortality and major adverse cardiac events within one year [8]. Moreover, troponin I (TnI) increases the ability of EuroSCORE to predict combined major adverse cardiac events and in-hospital mortality [16], and also mortality within 5 years [2]. Our finding that hs-TnT fails to provide additional predictive information concerning 180-day mortality in CABG patients may be due to the improved predictive accuracy of EuroSCORE II compared with the old EuroSCORE [17]. The low mortality rate and the subsequently reduced statistical power among the CABG patients may also have contributed. Accordingly, in the higher risk non-CABG group, hs-TnT provided additional predictive information for 180-day mortality. Furthermore, the addition of hs-TnT to EuroSCORE II also improved the prediction of MAEs, which we included in secondary analysis as the previous version of EuroSCORE predicted also the length of stay and postoperative complications [18].
Preoperative high-sensitivity troponin T
In this study, preoperative hs-TnT provided additional predictive information concerning 180-day mortality to that obtained from postoperative hs-TnT levels. Previously, with a former generation assay, preoperative TnT has been found to predict myocardial infarction [19] and short- and long-term mortality [5], but not when evaluated in parallel with postoperative TnT [4]. Comparable findings apply to TnI and 5-year mortality [2] and TnI and adverse events [16]. However, after percutaneous coronary intervention, the value of postoperative TnT has yielded controversial results: preoperative TnT seems more important, especially with a sensitive cut-off value [6]. Our result regarding the influence of preoperative troponin may be explained by the new sensitive TnT analysis. Furthermore, recent results [20, 21] suggest that minor elevations of hs-TnT may also be attributed to myocardial remodelling, hypertrophy and replacement fibrosis, even in the absence of acute ischaemic event or ischaemic heart disease, thus identifying the patients at the highest risk after surgery. In our study, the effect of preoperative hs-TnT was more pronounced in the longer follow-up of 961 days and in other than CABG cardiac surgical patients, who are supposed to have more replacement fibrosis. Accordingly, at least part of the high preoperative hs-TnT levels seem to reflect advanced myocardial remodelling that may not be ameliorated by cardiac surgery. Also, reanalysis after exclusion of patients with atrial ablation procedures who may have high, partly meaningless noisy postoperative hs-TnT, failed to change the results, further supporting the true influence of preoperative hs-TnT over postoperative hs-TnT.
MB fraction of creatinine kinase
CK-MBm failed to predict mortality in CABG patients, and, furthermore, it was a poor predictor of MAEs. This is in contrast to previous findings [22, 23]. Our patients are one of the most recent patient populations studied in this context and changes in patient profiles and timing of treatment may have affected the results. Due to different kinetics, both pre- and postoperative hs-TnT values reflect the events starting from days before surgery, whereas CK-MBm reflects more recent events [24]. With regard to the most contemporary surgery, underlying illness, remodelling and fibrosis of the heart, and recent myocardial infarction may be of greater importance for long-term outcome than biomarker elevation related to surgery itself.
High-sensitivity troponin T values
Troponins were moderately strong predictors of MAEs in both study groups. Owing to large confidence intervals, a single best cut-off point is of limited value. For clinicians, however, predictive values would be most useful, and negative predictive values may guide the discharge of patients from the ICU. Of CABG patients, 83–95% with preoperative hs-TnT levels below 9 ng/l recovered without MAEs, and 77–97% with postoperative hs-TnT below 159 ng/l did not present with MAEs.
Decision curve analysis
Decision curve analysis represents the net benefit that we gain with prediction models compared with expecting all patients either to have or not to have the end-point. Interpretation of it depends on our threshold probability. The net benefit (portion of patients correctly classified as having the end-point minus portion of patients incorrectly classified as having the end-point) is plotted against the threshold probability (variable defining how we weigh relative harms of false positives and false negatives). For example, with regard to MAEs and CABG patients (Fig. 3C), in case extended ICU stay (false positives) were valued 1.5 times worse (60:40) than a too optimistic attempt to discharge from ICU (false negatives), this means that our threshold probability would be a 60% probability to experience MAEs. At that threshold, the model with hs-TnT and EuroSCORE II would have a 3% net benefit compared with EuroSCORE II alone, meaning 1 extra patient diagnosed per 33 patients with no extra false positives. Thus, hs-TnT seems to offer a net benefit on top of EuroSCORE II-based prediction for MAEs, but whether hs-TnT adds to our clinical evaluation should be assessed in additional studies.
Limitations of the study
We acknowledge some limitations of our study. Firstly, the mortality rate was slightly lower than we expected and, thus, the results regarding our primary end-point—180-day mortality—have to be interpreted cautiously. However, results from day 961 after surgery support the validity of our findings, especially the importance of preoperative hs-TnT. Secondly, according to previous trials, TnT samples taken 44–48 h postoperatively predict mortality best [4], but early sampling has also been successful [25]. We decided to draw the samples in the first postoperative morning to guide discharging patients from the ICU. Thirdly, treating physicians were not blinded to CK-MBm results, because CK-MBm is routinely analysed in our practice. However, troponins were not known to clinicians, and they were better predictors for both mortality and MAEs.
CONCLUSION
In conclusion, elevated postoperative hs-TnT was associated with increased mortality only in patients with also elevated preoperative hs-TnT, and troponins provided additional information to the EuroSCORE II for MAEs after cardiac surgery. However, EuroSCORE II was a strong predictor of 180-day mortality, and hs-TnT provided significant incremental predictive value in only non-CABG cardiac surgical patients. Our findings suggest that 180-day mortality after cardiac surgery seems to be determined by preoperative risk factors, whereas perioperative myocardial injury may contribute to MAEs within 30 days. In the future, more intensive perioperative care, and e.g. myocardial protection studies, should probably be targeted on patients with preoperatively elevated hs-TnT.
SUPPLEMENTARY MATERIAL
Supplementary material is available at ICVTS online.
Funding
This work was supported by the Academy of Finland, Helsinki University Central Hospital EVO (grants TYH 2011210, TYH 2013343, TYH 2013106 and T102010070), the Foundation of Urho Känkänen in Finnish Foundation for Cardiovascular Research.
Conflict of interest: Roche Diagnostics supported the study by providing reagents at a reduced price to Akershus University Hospital (TAH). The sponsor played no role in any of the following: design and conduct of the study, collection, management, analysis and interpretation of the data or preparation, review and approval of the manuscript. Torbjørn Omland reports grants, personal fees and non-financial support from Abbott Diagnostics; grants and non-financial support from Astra Zeneca; personal fees from Novartis and from Roche Diagnostics; and non-financial support from Thermo Fisher and from Biomedica, outside the submitted work. Helge Røsjø reports non-financial support from Thermo Fisher, Biomedica, HyTest and EuroDiagnostica, and personal fee from Novartis. Besides the above-mentioned funding, none of the other authors report any conflict of interest.
ACKNOWLEDGEMENTS
We thank the members of the FINNAKI study group in the Helsinki University Hospital, Meilahti ICUs: Sara Nisula, Anna-Maija Korhonen, Laura Nurminen, Sari Sutinen, Leena Pettilä, Helinä Laitinen, Heidi Syrjä, Kirsi Henttonen and Elina Lappi. We are grateful to Sasu Liuhanen and Kristian Andsten for the help with the PICIS and Weblab databases and to Susann Brunell, Division of Diagnostics and Technology, Akershus University Hospital, Lørenskog, Norway, for expert knowledge regarding hs-TnT measurements. We thank Tieto Healthcare and Welfare for database management.
REFERENCES
