


Abstract
To gain differential knowledge about the physiological compliance and wall strength of the different regions of the aorta, including the ascending aorta, arch and descending aorta in both the circumferential and longitudinal directions, and to generate a hypothesis on the pathophysiological mechanisms that lead to Type A aortic dissection.
Fresh tissue specimens from 22 ex vivo porcine aortas were analysed on a tensile tester. Regional and directional compliance, failure stress and failure strain were recorded.
Aortic compliance appeared as a linear function of the natural logarithm (ln) of wall stress. Compliance significantly decreased along the length of the aorta. In the ascending aorta, longitudinal compliance significantly (P = 0.003) exceeded circumferential compliance, and the outer curvature was more compliant than the inner curvature (P = 0.03). In the descending aorta, this relationship is reversed: the circumferential compliance exceeded the longitudinal compliance, and the outer aspect was more compliant (P = 0.003). The median circumferential failure stress of all aortic segments was in the range of 2000–2750 kPa, whereas the longitudinal failure stress in the ascending aorta and the arch had values of 750–1000 kPa, which were significantly lower (P < 0.05). Surprisingly, the longitudinal failure stress of the inner aspect of the descending aorta was extraordinarily high (2000 kPa). Failure strain, similar to compliance, was highest in the ascending aorta and decreased along the aorta.
The aorta appears to be a complex organ with distinct regional and directional differences in compliance and wall strength that is designed to effectively absorb the kinetic energy of cardiac systole and to cushion the momentum of systolic impact. Under normotensive conditions and a preconditioned physiological morphology, the aortic wall works in the steep part of the logarithmic strain–stress function; under hypertensive conditions and pathological morphology, the wall reacts in an non-compliant manner. The high longitudinal compliance and low failure stress of the ascending aorta and subsequent pathological changes may be the main determinants of the recurrent patho-anatomy of Type A aortic dissection.
INTRODUCTION
The physiological function of the ascending aorta depends on its elastic tissue reaction on wall stress, which in turn is a product of blood pressure and aortic diameter. Wall stress is a major pathogenetic factor in both aneurysm formation and dissection [1, 2], and ascending aortic transversal diameter is the only accepted morphological risk factor for Stanford type A aortic dissection (TAD) [3]. However, most TADs develop in undilatated aortas, and the process of dissection itself leads to significant morphological changes, i.e. aneurysm formation [4].
Paradoxically, if a disproportion between circumferential wall stress and strength were the predominant pathophysiological mechanism, a longitudinal (vertical) rupture in the aortic intima would be expected, which is usually not the case. Quite the contrary, the TAD entry usually runs in a horizontal direction [1, 5, 6]. These considerations led to the hypothesis that a longitudinal rather than a circumferential discrepancy between impacting stress and wall compliance and strength is responsible for this recurrent patho-anatomy. In theory, aortic elongation, analogous to circumferential aneurysm formation [7, 8], potentially leads to a loss of longitudinal elasticity and a risk of intimal rupture. However, knowledge about the regional and directional differences in aortic wall properties [9, 10] in both healthy and diseased aortas is limited.
The aim of this study was to gain differential knowledge about physiological properties of wall compliance and strength of the different regions of the aorta, including the ascending aorta, arch and descending aorta in both the circumferential and longitudinal directions.
MATERIALS AND METHODS
Preparation of aortas
Fresh porcine thoracic organs (n = 22) were purchased from a local butcher. No animals were sacrificed specifically for this study, as the organs were sourced from regularly slaughtered pigs. All animals were German Landrace of mixed gender, 6 months old and weighing ∼120 kg.
The aorta was dissected from the surrounding tissue, beginning at the aortic valve and extending to the thoraco-abdominal junction; adventitial tissue was not removed. Then the aortas were incised longitudinally at their anterior aspect between the inner and outer curvature extending across the entire length. Strips that were 15 mm wide and 30–50 mm long were stamped out of these preparations in either a longitudinal or transversal orientation by using a cutting device that consisted of two firmly interconnected razor blades. Tissue thickness was measured with a digital micrometre gauge (Helios-Preisser, Gammertingen, Germany). Only fresh specimens were tested, the latency between slaughter, aorta harvesting and mechanical testing was a maximum of 3 h, and probes were stored in saline (sodium chloride 0.9%) at 8°C without freezing.
In the ascending aorta, longitudinal probes extended from the sinotubular junction to shortly before the origin of the brachiocephalic trunk, circumferential probes were taken from the median ascending aorta. The probes from the outer curvature of the aortic arch were taken directly after the offspring of the subclavian artery. The probes from the inner curvature of the aortic arch encountered the tissue opposite the brachiocephalic trunk and the left subclavian artery.
The probes of the descending aorta were taken in the area around the sixth to ninth intercostal arteries.
Custom-made tensile tester
The aortic strips were fixed in a simple custom-made tensile tester on both ends by using surgical clamps suspended in U-shaped metal holdings (Fig. 1). Using a cable-pull mechanism and a tension spring balance, defined force (0–90 N) was applied to the aortic strips. The tissue strips had a width of 1.5 cm and a median thickness of 0.2 cm, which resulted in wall-stress values ranging from 0 to 3000 kPa. Stress was defined as force per original (undeformed) cross-sectional area (First Piola-Kirchhoff stress). A digital camera was mounted 40 cm perpendicularly above the strips. The measurements were stopped when the aortic strip ruptured (failure) or when 3000 kPa was reached. At each stress level, there was a pause of 30 s before the next higher stress level was applied. Photographs were taken at every step of the impacting stress. Engineering (infinitesimal) strain was defined as length gain divided by the original (undeformed) length (ΔL/L0). During stress testing, tissue pieces were hydrated in physiological saline (sodium chloride 0.9%) at room temperature. There were no preconditioning cycles with the rationale not to alter the ex vivo physiology.
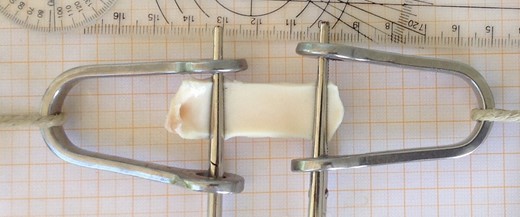
Aortic strips with a width of 15 mm were mounted in a custom-made tensile tester using surgical clamps. Force-dependent distension was measured optically.
Calculating the compliance of the aorta
The lengths of the aortic segments were measured digitally on the photographs using the Analyzing Digital Images software (freeware) (www.globalsystemsscience.org/software/download). The measurements were performed in a blinded manner; at the time of measurement, the impacting stress was unknown.
The stain values of the aortic strips were plotted against the impacting stress, as exemplified in Fig. 2, which reveals the logarithmic nature of the strain–stress curves.

Strain–stress diagrams of 11 longitudinally (full colour) and 11 circumferentially (light colour) tested outer curvatures of the ascending aorta.
A linear regression was performed with the natural logarithm (ln) of wall stress (kPa) as the independent and wall strain (ΔL/L0) as the dependent variable. The quality of the regressions was tested by calculating the ‘coefficient of determination’ (R2). A total of 132 regressions were performed. The median of the corresponding 132 R2 values was , with the smallest value being R2 = 0.78
In this formula, ε stands for strain (ΔL/L0), σ stands for stress (kPa) and the addend b represents the intersection of the curve with the 1 kPa abscissa.
Hence, in analogy to the Young's modulus, the slope c is a direct numerical measurement of the aortic compliance. The higher the numerical value of the slope c, the higher is the aortic compliance.
Statistical analysis and presentation
In 11 aortas, the circumferential compliance and in another 11 aortas the longitudinal compliance of the three different aortic regions, i.e. the ascending aorta, arch and descending aorta, were analysed.
A regression analysis was performed between the ln of the impacting stress and the resulting tissue strain by transforming the original data into a linear regression using the appropriate exponential function, then using the method of least squares for the regression analyses, and finally transforming the data back to logarithmic scaling.
The R2 was calculated to indicate the quality of the regressions. Continuous data were described as the median with the first (Q1) and third (Q3) quartiles and ranges (minimum and maximum) and were presented as box-and-whisker plots. For inference comparisons of continuous variables, the paired Wilcoxon signed-ranks test was used. All reported P-values were two-sided, and P-values of ≤0.05 were considered to indicate statistical significance.
The SSPS (SSPS 20.0, IBM Corp., Amonk, NY, USA) and Excel (MS Excel 2010, Microsoft, Redmond, WA, USA) software packages were used for all analyses and data presentation.
RESULTS
Relation between aortic strain and stress
Aortic compliance generally appears as a function of the natural logarithm (ln) of wall stress, regardless of the aortic region or the direction of distension. Figure 2 exemplarily shows the strain–stress diagrams of all 11 longitudinally (full colour) and 11 circumferentially (light colour) tested outer curvatures of the ascending aorta. Trend lines were computed by the medians of the strains at given stresses. The green trend line and its corresponding equation represent the longitudinal compliance and the purple trend line represents the circumferential compliance. The different compliances of the outer aspect of the ascending aorta depending on the direction of stress become obvious.
Thus, the compliance of the aortic regions can directly be compared by examining the slope c in the equations. The c = 0.3404 of the longitudinal strain–stress curve represents a steeper course compared with the c = 0.2361 of the circumferential curve. Furthermore, in Fig. 2, the median failure stress and strain values are marked by asterisks.
Circumferential aortic compliance
Figure 3 shows the circumferential compliance in the different aortic segments. The circumferential compliance of the outer curvature (blue box-plots) of the aorta decreases along its way. It is highest in the ascending and significantly decreases in the arch (P = 0.026) and the descending aorta (P = 0.044). With respect to the inner curvature (purple box-plots), the differences in compliance are smaller: the difference between the ascending aorta and the arch does not reach significance. However, the circumferential compliance in the inner descending aorta is significantly lower than that in the ascending aorta (P = 0.01).
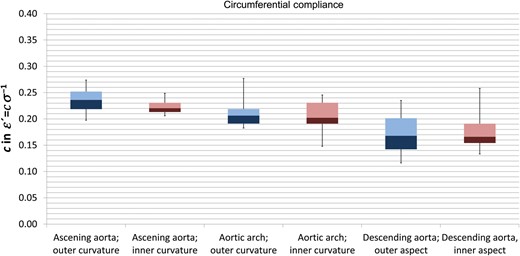
Circumferential compliance in the different aortic segments. Blue boxes represent the outer curvature and purple boxes the inner curvature of the aorta. Box-and-whisker plots present the median, first and third quartiles and range.
Longitudinal aortic compliance
Longitudinal compliance (Fig. 4) also decreases along the length of the aorta: the longitudinal compliance in the outer curvature (blue box-plots) of the ascending aorta significantly exceeded (P < 0.05) that of the outer arch and the descending aorta. With respect to the inner aspects of the aorta (purple box-plots), the longitudinal compliance in the inner descending aorta was significantly (P = 0.003) lower than those of both proximal sections.

Longitudinal compliance in the different aortic segments. Colours are analogous to Fig. 3.
Comparison of compliance in the inner and outer curvatures
With respect to circumferential compliance (Fig. 3), a significant difference between the inner and outer curvatures was only found in the ascending aorta (P = 0.041) but not in the arch and the descending aorta.
Longitudinal compliance (Fig. 4) in the outer curvature of the ascending aorta significantly (P = 0.03) exceeded that of the inner curvature, whereas in the arch, again, this difference was not significant (P = 0.09). In the descending aorta, the longitudinal compliance of the outer aspect (P = 0.003) exceeded that of the inner aspect.
Comparison of longitudinal and circumferential compliance
Longitudinal compliance in the ascending aorta significantly (P = 0.003) exceeded the circumferential compliance in both the outer curvature and the inner curvature.
In the aortic arch, there was no significant difference in longitudinal and circumferential compliance, neither in the outer nor in the inner curvature. Similarly, in the outer aspect of the descending aorta, there was no significant difference between longitudinal and circumferential compliance, whereas in the inner aspect of the descending aorta, the proportions reversed and the circumferential compliance significantly (P = 0.026) exceeded the longitudinal compliance.
Regional and directional differences in aortic failure stress
The median circumferential failure stress of all aortic segments (Fig. 5) was between 2000 and 2750 kPa, and the variance of circumferential failure stress within the individual aortic segments was strikingly large. We detected no significant differences in the circumferential failure stress between the different aortic segments. This, however, might have been due to methodological reasons because testing was terminated at a stress of 3000 kPa, even when rupture did not occur. Two ascending aortic probes and one arch and one descending aortic circumferential probe out of eleven probes each did not rupture at 3000 kPa. This potentially led to a slight underestimation but certainly not to an overestimation of circumferential failure stress. Additionally, we did not differentially test the failure stresses of the inner and outer curvatures.
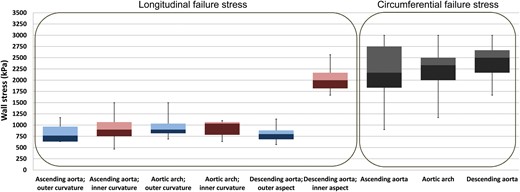
Failure stress in the different aortic segments, in longitudinal and circumferential directions. Blue boxes represent the outer curvature, and purple boxes represent the inner curvature of the aorta. Circumferential failure stress was not tested separately for the inner and outer curvatures; hence, boxes are represented in grey.
Longitudinal failure stress in both the ascending aorta and the arch showed values in the range of 750–1000 kPa, which were generally significantly lower (P < 0.05) than the circumferential failure stress of the respective aortic segments. In the longitudinal direction, failure stress in both the outer and inner aspects (encoded by the blue and purple colours) of the ascending aorta and arch showed no relevant differences, with one exception: the longitudinal failure stress of the inner descending aorta significantly (P < 0.05) exceeded both the longitudinal failure stress of the outer aspect of the descending aorta and that of the ascending aorta and the arch.
Regional and directional differences in aortic failure strain
The absolute differences in the failure strain values were relatively small; however, due to the small variance between the individual aortas, some of the differences were significant. The circumferential failure strain (Fig. 6) of the ascending aorta significantly exceeded the circumferential failure strain of the arch (P = 0.007) and descending aorta (P = 0.016). With respect to longitudinal failure strain, there was no difference between the outer and inner curvature of the ascending aorta; however, both values significantly (P < 0.05) exceeded the circumferential failure strain of the respective segment. Furthermore, longitudinal failure strain in the outer curvature of the ascending aorta (P = 0.003) exceeded that of the arch and the descending aorta.
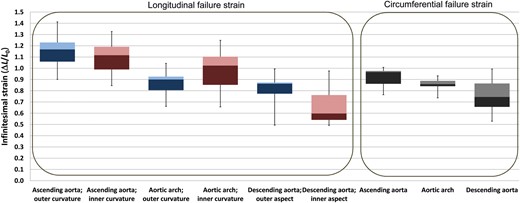
Failure strain in the different aortic segments, in longitudinal and circumferential directions. Circumferential failure strain was not tested separately for the inner and outer curvatures. Colours are analogous to Fig. 5.
In case of the inner curvature, longitudinal failure strain of the ascending aorta significantly exceeded that of the arch (P = 0.041). The longitudinal failure strain of the inner descending aorta was the lowest (P = 0.003).
In the aortic arch, we detected no differences between the circumferential and the longitudinal failure strains or between the longitudinal failure strains of the inner and outer curvatures.
In the descending aorta, failure strain in the outer aspect was significantly higher (P = 0.021) than that in the inner curvature; however, no significant differences were found between longitudinal and circumferential failure strains of the descending aorta.
DISCUSSION
Methodical considerations and limitations
The present study uses fresh ex vivo aortic tissue from regularly slaughtered pigs. Although pork is regularly used as a model in cardiovascular research and it is very probable that the results demonstrated herein are representative of the physiology of a juvenile human, the transferability of the results to humans merits further discussion [9]. The tissues tested herein are certainly not representative for aged and diseased aortas, which have different material properties [11]. Further, the static tensile testing method itself contains several limitations [12]. Though the wall stress is applied in very precise portions and with precise directions, which is a clear advantage of the method, the tissue specimens are allowed to narrow in the direction perpendicular to the impacting stress. Therefore, both the 3D impact of blood pressure and the 3D nature of the aorta are neglected. We tried to overcome these drawbacks by using a technique of entire aorta ex vivo perfusion, as presented in another study [13]. However, the latter method does not produce comparably precise data and thus cannot replace static tensile testing.
Twenty-two aortas were investigated. In 11 aortas, the circumferential compliance, and in the other 11 aortas the longitudinal compliance were studied. The investigation of both directions in one individual aorta was not possible because testing the tissues to their failure stress unavoidably leads to the destruction of the tissue pieces. Moreover, one single porcine aorta does not provide a sufficient quantity of representative tissue probes for multidirectional testing.
The quality of each individual experiment and each resulting regression was quantified by the R2, the median of those was , which indicates a precise measurement.
Aortic compliance, general considerations
Aortic compliance itself is stress- and, therefore, blood pressure-dependent. The relation between wall stress and strain is a function of the natural logarithm, as demonstrated in Fig. 2.
The higher the wall stress, the less compliant is the wall. The non-linear nature of aortic compliance precludes the designation of Young's elastic modulus, but the multiplicand c in the stain–stress equation and its derivative is a direct measure of the compliance depicted in detail above. Thus, this measure was used in the present work.
is adequate (where σ is wall stress, P is the internal pressure, S is the wall thickness and D is the diameter of the vessel).
The different multiplicand for wall thickness in the denominator of the formula entails that circumferential wall stress is always twice as high as longitudinal stress at a given internal pressure. This formula, as a note, is responsible for the everyday observation that pressurized vessels (i.e. steam boilers, gun barrels and cooked sausages) usually rupture in an axial/longitudinal direction. Off course, this formula would only be perfectly valid if the aorta is modelled as a perfect cylinder, and we disregard the effect of curvature and tapering, as well as the tethering of aorta by the surrounding tissues.
Nevertheless, in vivo, the actual aortic wall stress at a given internal pressure depends on the aortic geometry and dimensions: In an aorta of diameter 30 mm with a wall thickness of 3 mm [14, 15], the wall tension in the circumferential direction would be 80 kPa at 120 mmHg and 134 kPa at 200 mmHg, and the tension in the longitudinal direction would be half as high. An aorta of diameter 50 mm with a wall thickness of 2 mm, however, would be exposed to 200 kPa at 120 mmHg and to 337.5 kPa at 200 mmHg in the circumferential direction. In the longitudinal direction, the wall tension would again be half as high. If one compares these values with the strain–stress diagrams shown in Fig. 2, it becomes obvious that the regularly shaped and healthy aorta under normotensive conditions will work in the relatively steep left part of the strain–stress relation and will react compliantly. In states of increased wall stress, in contrast, either by hypertension or by aneurysmatic dilatation, the wall loses its elasticity and reacts in an non-compliant manner.
Local differences in aortic compliance
Under physiological conditions, the aortic wall serves as a blood reservoir during systole, absorbs systolic kinetic energy, emits this energy during diastole and transforms strictly pulsatile cardiac output into a more constant waveform (Windkessel effect). However, aortic compliance differs regionally [16] and directionally. Figure 6 presents an overview. Regardless of whether it is circumferential or longitudinal, compliance decreases along the length of the aorta. This phenomenon has been observed by other authors in healthy and diseased human and animal aortas [16–21]. In the ascending aorta, the longitudinal compliance clearly exceeds the circumferential compliance. It is noteworthy that, in the ascending aorta, the longitudinal compliance is asymmetrically distributed, i.e. the outer curvature is more compliant than the inner curvature. We observed this phenomenon earlier in dynamic tests of aortic compliance [13] and it has also been described in human aortic aneurysms [8, 21]. This asymmetrical compliance of the aorta likely meets the mechanical demands of the curved shape of the ascending aorta and the resulting increased strain of the outer curvature during systole.
Additionally, and potentially very important for TAD development, the longitudinal failure stress in the ascending aorta lies significantly below the circumferential failure stress [8, 10, 21], even if we consider the different impacting stress.
In the aortic arch, compliance decreases, and there are no relevant differences in the local or directional wall properties (Fig. 7). Moreover, from the methodological standpoint, the wall properties of the aortic arch outer curvature are difficult to assess due to the offspring of the supra-aortic branches and the subsequently inhomogeneous wall properties in this region. This may be the reason for the trend towards a lower compliance and lower failure strain in the outer compared with the inner curvature of the aortic arch and for the comparatively high spread of the values.
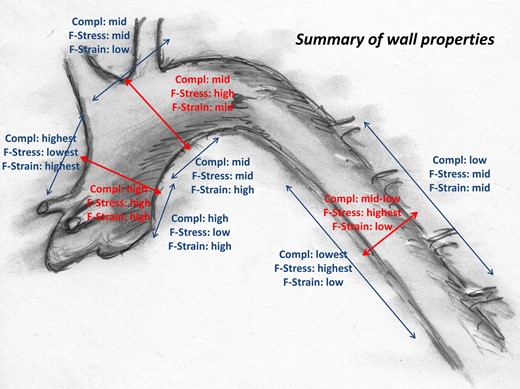
Local and directional wall properties of the young and healthy aorta.
Interestingly, in the descending aorta, the relation between directional compliances reverses, and the circumferential compliance is higher than the longitudinal. The inner aspect of the descending aorta in particular is characterized by a low longitudinal compliance but an extremely high longitudinal failure stress. The physiological function and pathophysiological relevance of this surprisingly high wall strength currently remain unclear.
In summary, the aorta appears to be a complex organ with distinct regional and directional differences in elasticity and strength that is designed to effectively absorb the kinetic energy of cardiac systole and to cushion the momentum of systolic impact.
Regional aortic wall properties and the development of Type A aortic dissection
In mechanics and engineering, cylinder stress models include the circumferential (hoop) stress and axial stress of tubes, as depicted above. Pressurized vessels (i.e. steam boilers, gun barrels and cooked sausages) usually rupture in an axial/longitudinal direction because the circumferential stress at a given internal pressure is always twice as high as the longitudinal stress. In contrast, the aortic dissection entry mostly runs in a circumferential direction [1, 5, 6]. Two assumptions result from this observation: Firstly, the main trauma/stress leading to intimal rupture must be in a longitudinal direction. Secondly, inherent material properties of the aorta, both physiological or pathological, must predetermine the intimal breaking point. As outlined above, the ascending aorta is characterized by an outstandingly high compliance but low failure stress in the longitudinal direction, which results in it being particularly vulnerable. With longitudinal failure stresses in the range of ∼600–1000 kPa and circumferential failure stresses ∼1800–2700 kPa, which correspond to critical internal pressures of 300–600 mmHg in the longitudinal and >600 mmHg in the circumferential direction (preconditioned an ideal tubular aortic morphology), it appears comprehensible that a hypertensive emergency will first lead to a tissue failure in the longitudinal direction and by that to a horizontal intimal rupture. The asymmetric geometry and asymmetric wall properties of the aorta may be other aspects to explain the recurrent morphology of the dissection entry. We further hypothesize that during ageing processes (i.e. aortic elongation), aortic elasticity decreases [22] without an increase in failure stress. Furthermore, specific differences in the mechanical properties of the histological aortic layers as described in detail by Sokolis et al., with a low failure stress of the intima and a high failure stress of the adventitia are of utmost relevance [23].
We are actually conducting investigations to further characterize aortic elongation and morphological changes during ageing. Further studies will characterize the wall properties in aged aortas and shed light on both the physiological and pathological changes that occur and their impact on the development of aortic dissection.
CONCLUSION
Compliance and strength of the aortic wall differ substantially, both regionally and directionally.
The ascending aorta in general is very compliant; however, longitudinal compliance exceeds circumferential compliance significantly. In contrast, the failure stress of the ascending aortic tissue in the longitudinal direction is significantly smaller than that in the circumferential direction. These physiological properties and their pathological changes may be determinants of the recurrent patho-anatomy of TAD.
Funding
This work was supported by the Dr Karl Kuhn-Stiftung, Tübingen.
Conflict of interest: none declared.
ACKNOWLEDGEMENTS
We thank Christian Power, Department for Mathematics, University of Tübingen, for counselling.
REFERENCES
APPENDIX. CONFERENCE DISCUSSION
Dr L. Careddu(Bologna, Italy): Nowadays the major criteria for aortic replacement are based dilatation and on previously dissected aortas. This is the basis of our guidelines. Very few are now on aortic compliance, especially on the role of stress and strain. You and your colleagues have done a really interesting enrichment of our knowledge on mechanisms of aortic dissection. I have only a few questions for you. First of all, how do you store the porcine graft, especially do you use ice?
Dr Krüger: No. We just used fresh grafts. We got them and then we did the experiments. The transportation was on ice but no storage.
Dr Careddu: So you think it doesn't interfere with the stress-strain tension model?
Dr Krüger: Well, you can't exclude any interference though it is a postmortem tissue, but we kept the ischemia time as short as possible.
Dr Careddu: Second one. Young model is not the correct one, as you show, as we cannot do like engineers, just pulling. So you think it is better to make a more complex model, maybe increasing the difficulty for the technician and enriching it with the flow inside the aorta?
Dr Krüger: Absolutely yes. My first personal criticism on that, is we don't respect the three-dimensional geometry of the aorta and we just reduce it on, let's say, a one-dimensional stress-strain relationship, which is not the case in vivo. We also tried to do this in perfusion experiments of the entire aorta, but then you have, again, problems; the measurements are not that precise, also you have to do this with pulse arterial stress-strain and all that. This is just one approach to this problem. It is just a model with faults or with disadvantages. That's right.
Dr Careddu: And the last one. Do you think this stress-strain model could be embedded in new technology, such as MRIs, for example, with already the flow inside?
Dr Krüger: In vivo measurements definitely would be very interesting if it is with MRI or with echo. This is, from my point of view, very interesting and probably we will do that in the future, I'm sure.
Dr Careddu: Thank you.
Dr N. Desai(Philadelphia, PA, USA): Did you look at the transition points between the different segments of the aorta? For instance, we know that most entry tears in type A dissection happen just above the sinotubular junction, but there are a lot of transition changes there between the extremely compliant sinuses, a less compliant STJ, and then a more compliant ascending aorta. Were you able to tease any of that out, or look at that?
Dr Krüger: Well, not specifically, to be honest, because then with this tensile tester you have problems with the size of the probes. That's the problem in this case. But I totally agree that this is very interesting.
What you are saying is that the functional anatomy of the aorta is even more complex with regional differences. This would be interesting in the future as well, yes.
Dr T. Schachner(Innsbruck, Austria): It is only somewhat difficult for maybe me, as a surgeon to understand the N/cm². Would it be possible to translate this into mmHg, especially when the elastic properties begin to fade?
Dr Krüger: The reason why I did not write mmHg, I would feel much better with that as well, because we are all used to mmHg in our clinical routine. But the reason is that the stress on the wall does not just depend on the pressure, which would be mmHg, but also on the size of the vessel. If the vessel is enlarged and the diameter becomes larger, then with a given internal pressure the stress on the wall increases, and that is the reason why we cannot give the mmHg in these grafts. I don't like that as well. But if we want to do this, we have to define the diameter of the aorta first.
Dr Schachner: But you could maybe do that for this porcine aorta and then calculate it may be somewhat corresponding to blood pressure?
Dr Krüger: I tried that, to be honest, but then it was a little bit difficult.
Dr R. De Paulis(Rome, Italy): You showed a high compliance on the outer curvature of the aorta with low failure stress, right?
Dr Krüger: Yes.
Dr Paulsen: So do you think also at this point the shape of the outer curvature of the aorta will play a different role? Depending on how the aorta it is shaped it will be different?
Dr Krüger: I totally believe that, yes. Personally, and this is just my personal belief, if the aorta becomes longer and longer, it becomes more bent and more angulated, also in the arch especially, and then the stress on the outer curvature increases, the compliance decreases, and then the dissection happens. The only problem is that the dissection entry is mostly on the inner curvature.
Dr De Paulis: Also because there is some evidence that histology changes from the outer and inner curvature. In the past there have been several papers on this.
Author notes
Presented at the 29th Annual Meeting of the European Association for Cardio-Thoracic Surgery, Amsterdam, Netherlands, 3–7 October 2015.
