


Abstract
Our aim was to prospectively examine the association of psychosocial factors with adverse outcome after cardiac surgery. One hundred and eighty cardiac surgery patients were enrolled and contacted annually by mail. Depression [Beck depression inventory (BDI)], anxiety [state anxiety subscale in Spielberger State–Trait Anxiety Inventory (STAI-S) and trait anxiety subscale in Spielberger State–Trait Anxiety Inventory (STAI-T)] were investigated annually, social support, negative affectivity, social inhibition (SI), illness intrusiveness, self-rated health and sleeping disorders were investigated by standardized tests at the second and fifth year. The end-point was the major adverse cardiac and cerebrovascular event (MACCE) including death. Twenty-eight (15.5%) patients died by the end of the fifth year. At the end of the second and fifth years, 146 (81.1%) and 118 (65.5%) patients fulfilled the tests, respectively. At the end of the second year after adjustment for medical and perioperative factors worse self-rated health [adjusted hazard ratio (AHR): 0.67, P=0.006], sleeping disorders (AHR: 1.14, P=0.001), higher illness intrusiveness (AHR: 1.03, P=0.018), higher BDI (AHR: 1.12, P=0.001), STAI-S (AHR: 1.09, P=0.001) and higher STAI-T scores (AHR: 1.08, P=0.002) showed higher risk for MACCE. Significant individual elevation in scores of sleeping disorders, illness intrusiveness and SI were observed over the three-year period in the MACCE group. Assessment of psychosocial factors could help in identifying patients at high-risk for MACCE after cardiac surgery.
1. Introduction
Over the last three decades, researchers have recognized the unique impact of psychosocial factors, such as anxiety, depression, social support, and self-rated health on the recovery from medical procedures regarding coronary heart disease [1]. Psychiatric co-morbidity increases the risk of adverse outcomes in myocardial infarction (MI), such as worse prognosis, high medical costs, and higher mortality rate [2].
The majority of prior investigations have focused on predictors of in-hospital morbidity and complications. Since mortality has become relatively low after cardiac surgery, the effectiveness of the operation has been assessed by the measurement of patients' well-being and quality of life [2]. Thus, the aim of the present study was to investigate the influence of psychological factors beyond clinical risk factors and perioperative characteristics on the five-year occurrence of major adverse cardiac and cerebrovascular event (MACCE) and death.
2. Materials and methods
2.1. Study population
The study population comprised of 197 patients admitted for elective coronary artery bypass grafting (CABG) or valve surgery at the Gottsegen Hungarian Institute of Cardiology, between July 2000 and May 2001. There was no eligibility restriction in terms of age, gender, or cardiac condition and no classification of on- and off-pump procedures. All patients signed the informed consent. The participants were not managed differently than the other patients, e.g. there was no psychosocial preparation, it was an observative study.
The baseline questionnaires were completed one to five days before surgery. Of the 197, 17 patients were excluded because of cancelled surgery (n=9) or inability to complete the psychological tests (n=8). Thus, a total of 180 patients were prospectively studied. The study was approved by the Institutional Medical Ethics Committee on human research.
2.2. Clinical factors
A range of medical and psychosocial factors were assessed as potential determinants of outcome, see statistical analysis section. Detailed definitions can be accessed at the homepage of the Society of Thoracic Surgeons 1
STS National Database, data collection STS Adult Cardiac Database v2.52.1. Available at: http://www.sts.org/sections/stsnationaldatabase/datamanagers/adultcardiacdb/datacollection/index.html Accessed March 22, 2009.
2.3. Psychosocial factors
Demographic data on age, gender, living status (alone vs. with another), and education (number of school-years) were collected. Description of the psychosocial tests is presented in Table 1 .
Applied psychosocial tests and Cronbach alfa for study population
| Psychosocial test | Cronbach alfa | Description, psychometric properties and references |
| Self-rated health (one question) | Question: ‘How do you rate your health in general?’ There were five | |
| possible responses: very good, good, fair, poor and very poor [5]. | ||
| The Athens insomnia scale (AIS) | 0.74 | It assessed sleep complaints and identified possible cases of insomnia. |
| The scale consisted of eight items. The first five items cover nighttime | ||
| symptoms, and three items asked for daytime consequences of disturbed | ||
| sleep [6]. | ||
| Negative affectivity (NA) and | NA: 0.89, | NA refers to the tendency to experience negative emotions across |
| social inhibition (SI) | SI: 0.78 | time/situations. SI refers to the tendency to inhibit the expression of |
| emotions/behaviors in social interactions to avoid disapproval by | ||
| others. Type D patients (defined as both NA and SI scores equal or | ||
| higher than 10 points) are at increased risk for a wide range of adverse | ||
| health outcomes (e.g. cardiac death, risk of early ischemic coronary | ||
| heart disease in men etc.) [7]. | ||
| Spielberger State–Trait Anxiety | 0.94 | The STAI-S measures the transitional emotional status evoked by a |
| Inventory state and trait scores | stressful situation, such as surgery. The STAI-T score reflects | |
| (STAI-S and STAI-T) | relatively enduring individual differences in proneness to anxiety. In the | |
| American population, patients with scores higher than 40 are classified | ||
| as anxious [8]. | ||
| Beck depression inventory (BDI) | 0.88 | The BDI is a 21-item self-report instrument measuring clinical |
| manifestations of depressive symptoms that correspond to the DSM-IV | ||
| criteria. Scores 0–9 indicate that a person is not depressed, 10–18 | ||
| indicate mild–moderate depression, 19–29 indicate moderate–severe | ||
| depression and 30–63 indicate severe depression [1]. | ||
| Social support inventory (SSI) | Board: 0.78, | Five-item scale measures social and emotional support in cardiac |
| Family: 0.66 | patients. The score ranged from 0 (no social support) to 22 (maximum | |
| level of social support) [9]. | ||
| Illness intrusiveness rating scale | 0.91 | Self-report instrument that measures the extent to which one's illness |
| and/or its treatment interfere with 13 life domains. Each item is rated | ||
| from 1 (not very much) to 7 (very much). Higher scores reflect greater | ||
| illness intrusion [10]. |
The validity and reliability of the tests above are well-documented in the Hungarian population. The Cronbach alfa was calculated for the investigated population.
2.4. Follow-up surveillance
The Beck depression inventory (BDI), state anxiety subscale in Spielberger State–Trait Anxiety Inventory (STAI-S), and trait anxiety subscale in Spielberger State–Trait Anxiety Inventory (STAI-T) tests were sent to the patients, along with an additional sheet of questions regarding hospitalisation and the primary cause of their hospital admission since the last contact. The patients were contacted by mail 6, 12, 24, 36, 48 and 60 months after discharge. The social support, negative affectivity (NA), social inhibition (SI), illness intrusiveness, and insomnia tests were sent with the second and fifth year questionnaires. At the end of the second and fifth year, we telephoned those patients who did not respond and asked for information about their medical history. Psychological questionnaires were not completed by telephone in order to avoid bias resulting from different methodologies. The Hungarian registry was searched for mortality information at the end of the fifth year.
2.5. End-point assessment
We have chosen all-cause mortality and hospitalisation due to MACCE [angina, congestive heart failure (CHF), MI, percutaneous coronary angioplasty, survived cardiac arrest, and death due to cardiac causes, stroke, re-CABG, and valve replacement] as clinical end-points. In 70% of the cases the clinical data were retrieved from the registry of our hospital, where the patients were treated, in the remaining 30% the data were retrieved from family doctors' registry.
2.6. Statistical analysis
All analyses were performed using the SPSS 13.0 statistical package (SPSS Inc, Chicago, IL, USA). Data were described as mean and standard deviation (SD) or median and interquartile range (25th–75th percentile) for continuous variables and as number and percent for categorical variables of all patients belonging to the MACCE negative or MACCE positive patient group. Median (25th–75th percentile) follow-up was computed according to the Kaplan–Meier method. The observation time extended from the date of discharge to the date of first MACCE event or censoring. Preoperative and operative patient characteristics were compared according to the occurrence of MACCE by means of the Student's t-test or the Mann–Whitney U-test and the χ2-test for continuous and categorical variables, respectively. The cumulative MACCE free survival probability and 95% confidence intervals (CIs) were computed and plotted separately for patients with and without MACCE according to the Kaplan–Meier method. Mortality rates (95% CI) per 100 person-years were reported. The prognostic value of MACCE was evaluated by means of Cox regression. Hazard ratios (HRs) and 95% CIs were calculated. To account for the confounding effect of preoperative and operative characteristics, we adjusted the Cox model for the propensity score of MACCE. The propensity score is the conditional probability of each patient suffering from MACCE, based on his/her pretreatment characteristics. The propensity score adjusts the apparent influence of the comparison variables of interest for patient selection differences not accounted for by the other variables in the analysis. It was calculated by including variables linked to MACCE in a multivariate logistic model with MACCE being the dependent variable and the following variables being regressors: previous MI, previous CABG, history of arrhythmia, CHF, diabetes mellitus, hypercholesterolemia, cerebrovascular disease, chronic renal insufficiency, hypertension, and previous psychiatric hospitalisation, additive EuroSCORE, number of grafted vessels, CBP, aortic cross-clamp time, permanent stroke, reoperation for any reason, serious infection, prolonged mechanical ventilation, renal failure requiring dialysis, duration of ICU and hospital stay. The c-statistic for this model was computed to 0.78. We also evaluated the role of psychosocial factors investigated (measured at the second and fifth year and the mean of the two measurements) during follow-up in the Cox model by adjusting for propensity score. All tests were two-sided, and a value of P<0.05 was considered statistically significant.
3. Results
There were no difference in the urgency status (all of them were elective patients), length on the waiting list, number of delayed surgery and previous location before admission (home or other hospital) regarding to MACCE positive or MACCE negative patients. The overall incidence of MACCE was 45.0% (81 patients of the 180 patients). Median follow-up was 52 months (interquartile range: 36–64 months). The study profile and the follow-up are shown in Fig. 1 . The median of event-free survival was 36 months (95% CI: 30–42 months) in the MACCE positive patients. Twenty-eight patients (15.5%) died during the study period with a mortality rate of 2.25 per 100 person-years (Fig. 2 ).
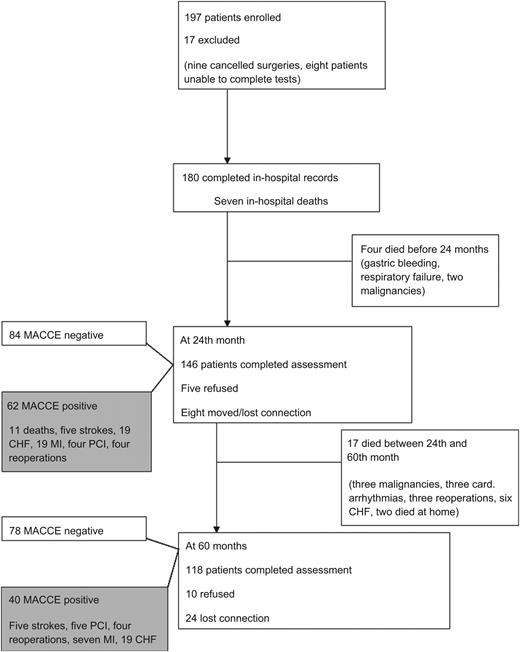
Study profile. The diagram shows the main steps of the study including patients who died and those who had major adverse outcome during five-year follow-up. CHF, congestive heart failure; MACCE, major adverse cardiac and cerebrovascular event; MI, myocardial infarction; PCI, percutaneous coronary intervention.
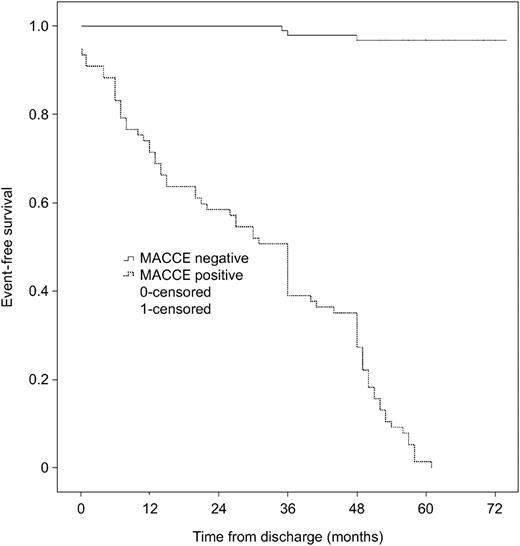
Kaplan–Meier analysis of the two groups. Time after discharge is plotted against the cumulative survival. MACCE, major adverse cardiac and cerebrovascular event.
At the end of the second year, 146 (81.0%) patients responded. Among the patients who completed the second year questionnaires, 62 (34.4%) experienced MACCE. At the end of the fifth year, 118 (65.5%) patients completed the questionnaires. Among the patients who responded at the end of the fifth year, 40 patients (22.2%) experienced adverse events (MACCE positive) and 78 patients (43.3%) were event-free.
The characteristics of the pre- and postoperative factors of the MACCE patients compared to MACCE negative patients are shown in Table 2 .
Preoperative, perioperative and psychosocial factors and occurrence of MACCE five years after cardiac surgery
| MACCE negative | MACCE positive | P-value | P-value* | |||
| (n=99) | (n=81) | |||||
| Preoperative factors | ||||||
| Age (years) | 56.8 | 11.2 | 59.1 | 8.2 | 0.11 | 0.63 |
| Gender: female | 32 | 32.3% | 29 | 35.8% | 0.63 | 0.75 |
| Previous MI | 37 | 37.4% | 29 | 35.8% | 0.87 | 0.79 |
| Diabetes | 21 | 21.2% | 26 | 32.1% | 0.12 | 0.71 |
| Kidney failure | 8 | 8.1% | 7 | 8.6% | 1 | 0.99 |
| Hypertension | 40 | 40.4% | 33 | 40.7% | 0.54 | 0.68 |
| Hyperlipemia | 38 | 38.4% | 26 | 32.1% | 0.23 | 0.72 |
| Cerebrovascular disease | 11 | 11.1% | 14 | 17.2% | 0.28 | 0.76 |
| Psychiatric disease | 9 | 9.1% | 17 | 20.9% | 0.03 | 0.83 |
| EuroSCORE (scores) | 3.17 | 2.4 | 3.77 | 2.5 | 0.97 | 0.59 |
| Perioperative factors | ||||||
| CABG surgery | 72 | 72.7% | 61 | 75.3% | 0.73 | 0.31 |
| Valvular surgery | 21 | 21.2% | 27 | 33.3% | 0.09 | 0.95 |
| Reoperation | 2 | 2% | 9 | 11.1% | 0.01 | 0.48 |
| CPB time (min) | 72 | 51 | 79 | 42 | 0.32 | 0.77 |
| Number of bypasses | 2.2 | 1.5 | 1.96 | 1.47 | 0.29 | 0.91 |
| Myocardial infarction | 13 | 13.1% | 12 | 14.8% | 0.82 | 0.93 |
| Acute heart failure | 9 | 9.1% | 19 | 23.46% | 0.007 | 0.89 |
| Infection | 9 | 9.1% | 11 | 13.6% | 0.35 | 0.96 |
| Arrhythmias | 19 | 19.2% | 19 | 23.5% | 0.47 | 0.82 |
| Intensive care unit days | 1.3 | 1.3 | 3.5 | 8.5 | 0.024 | 0.89 |
| Hospital days | 9.3 | 4.3 | 9.6 | 9.7 | 0.79 | 0.54 |
| Psychosocial factors | ||||||
| Education (years) | 11.45 | 2.9 | 10.3 | 3.1 | 0.29 | 0.69 |
| Single living | 16 | 16.2% | 11 | 13.6% | 0.68 | 0.92 |
| Preoperative BDI (point) | 8.2 | 5.1 | 11.8 | 8.7 | 0.006 | |
| Preoperative STAI-S (point) | 42.9 | 11.3 | 47.2 | 11.1 | 0.012 | |
| Preoperative STAI-T (point) | 41.8 | 9.2 | 48.1 | 9.9 | <0.001 | |
*P-values are those calculated after adjustment according to the propensity score. Data are presented as number and percent for categorical variables and mean and standard deviation for continuous variables. Bold values represent the significant differences between groups when P<0.05.
MACCE, major adverse cardiac and cerebrovascular event; MI, myocardial infarction; CABG, coronary artery bypass grafting; CPB time, cardiopulmonary bypass time; BDI, Beck depression inventory; STAI-S, state anxiety subscale in Spielberger State–Trait Anxiety Inventory; STAI-T, trait anxiety subscale in Spielberger State–Trait Anxiety Inventory.
MACCE positive patients had higher preoperative BDI scores (P=0.006), STAI-S (P=0.012) and STAI-T (P<0.001) scores compared to the event-free patients. Table 3 shows the propensity-adjusted results of the psychosocial tests completed at the end of the second and fifth year for the MACCE positive and MACCE negative patients. Among the second year questionnaires, scores of illness intrusiveness, sleeping problems, BDI, STAI-S and STAI-T scores had a positive hazard for MACCE after adjustment of medical factors. At the end of the fifth year, we found results similar to those of the second year follow-up. Additionally, SI (P=0.02) and NA (P=0.003) and their sum (P=0.005) was also associated with increased hazard for MACCE after propensity score adjustment. Type D personality had an adjusted hazard of 2.14 (95% CI: 1.08–4.23) at the end of the fifth year.
Cox models for assessing the role of psychosocial variables after stratification for biomedical variables
| Second year (n=154) | Fifth year (n=118) | |||||
| Adjusted | 95% CI | P-value | Adjusted | 95% CI | P-value | |
| hazard | hazard | |||||
| ratio | ratio | |||||
| Self-perceived health | 0.67 | (0.51–0.89) | 0.006 | 0.72 | (0.52–1.00) | 0.048 |
| Illness intrusiveness | 1.03 | (1.00–1.05) | 0.018 | 1.04 | (1.02–1.05) | <0.001 |
| Social support (family) | 0.98 | (0.92–1.04) | 0.417 | 0.99 | (0.91–1.08) | 0.801 |
| Social support (broad) | 0.94 | (0.87–1.03) | 0.186 | 1.03 | (0.92–1.17) | 0.580 |
| Sleeping disorders | 1.14 | (1.05–1.24) | 0.001 | 1.06 | (0.96–1.18) | 0.258 |
| Social inhibition (SI) | 1.03 | (0.97–1.08) | 0.310 | 1.08 | (1.01–1.14) | 0.020 |
| Negative affectivity (NA) | 1.05 | (1.00–1.11) | 0.068 | 1.08 | (1.03–1.14) | 0.003 |
| Sum SI+NA | 1.02 | (0.92–1.05) | 0.108 | 1.04 | (1.01–1.08) | 0.005 |
| BDI | 1.12 | (1.07–1.18) | 0.001 | 1.05 | (1.02–1.08) | 0.001 |
| STAI-S | 1.09 | (1.05–1.13) | <0.001 | 1.05 | (1.03–1.08) | 0.001 |
| STAI-T | 1.08 | (1.05–1.11) | <0.001 | 1.04 | (1.01–1.06) | 0.002 |
Psychosocial tests were separately entered into the Cox model after adjustment for propensity scores including medical and perioperative variables. The adjusted hazard ratios were calculated for point increments of the reported psychosocial tests. For example, one point increase in the BDI score was associated with 12% increase in the risk for MACCE. Bold values represent the significant differences between groups when P<0.05.
CI, confidence interval; BDI, Beck depression inventory; STAI-S, state anxiety subscale in Spielberger State–Trait Anxiety Inventory; STAI-T, trait anxiety subscale in Spielberger State–Trait Anxiety Inventory.
Table 4 shows the differences between the scores reached at the end of the second and fifth year for MACCE positive and negative patients. In the MACCE positive group, scores of illness intrusiveness, SI and sum of SI and NA, and the rate of sleeping disorders increased significantly from the second and fifth year. In contrast, intra-patient depression and anxiety scores did not change during the study period. Both groups reported decreased family and broad social support during the three-year period (P<0.001).
Paired differences in MACCE positive and negative patients at the end of the 24th and 60th month
| MACCE negative | MACCE positive | |||
| Difference (S.D.) | P-value | Difference (S.D.) | P-value | |
| Self-perceived health | 0.08 (0.81) | 0.400 | 0.05 (0.85) | 0.701 |
| Illness intrusiveness scale | 2.08 (17.80) | 0.198 | 6.90 (14.71) | 0.014 |
| Social support (family) | –6.51 (5.80) | <0.001 | –6.51 (6.22) | <0.001 |
| Social support (broad) | –9.77 (4.10) | <0.001 | –6.52 (6.23) | <0.001 |
| Sleeping disorders | 0.48 (2.40) | 0.097 | 1.71 (3.40) | 0.009 |
| Social inhibition (SI) | –0.30 (4.60) | 0.590 | 1.66 (4.26) | 0.036 |
| Negative affectivity (NA) | 0.76 (4.98) | 0.202 | 1.52 (4.51) | 0.062 |
| Sum SI+NA | 1.05 (8.26) | 0.280 | 3.15 (0.76) | 0.027 |
| BDI | –1.45 (5.88) | 0.084 | –0.66 (7.13) | 0.589 |
| STAI-S | 0.02 (10.68) | 0.990 | –0.70 (12.88) | 0.779 |
| STAI-T | 3.00 (10.12) | 0.015 | 2.97 (10.61) | 0.107 |
In MACCE negative and MACCE positive study populations the individual differences of the psychosocial variables were investigated with paired t-test. The differences are shown as mean and standard deviation. Bold values represent the significant differences between groups when P<0.05.
MACCE, major adverse cardiac and cerebrovascular event; S.D., standard deviation; BDI, Beck depression inventory; STAI-S, state anxiety subscale in Spielberger State–Trait Anxiety Inventory; STAI-T, trait anxiety subscale in Spielberger State–Trait Anxiety Inventory.
4. Discussion
We have found that psychosocial factors, as illness intrusiveness, depression, anxiety, sleeping disorders measured by standardized questionnaires were associated independently with the occurrence of MACCE after adjustment of biomedical factors and perioperative variables after cardiac surgery. Additionally, severity of illness intrusiveness, sleeping problems and SI increased in the MACCE positive patients during the three-year period; these tendencies were not observed in the event-free group.
Epidemiological studies suggested that psychosocial factors, such as social support, depressive symptoms and anxiety play a pivotal role in the development and course of coronary heart disease and influence the long-term outcome after heart surgery regardless of on- or off-pump procedures [11]. Time spent on the waiting list however has been related to anxiety and depression [12]. In accordance with these findings, we have found that depression and anxiety were higher in the MACCE positive group in the preoperative period. The psychological variables above can be treated as a marker for poor adjustment of stress situation, like major cardiac surgery, but at the same time they also contribute to prolonged or poor recovery. These psychosocial vulnerability concepts may serve explanation for our findings that BDI and STAI-T scores did not change significantly during the three years, while scores of illness intrusiveness and sleeping disorders increased solely in MACCE positive patients. It suggests that the personality of the patient might also contribute to the development of major adverse events, or even undermine short- and long-term recovery.
The simple question about the self-estimation of health status strongly predicted mortality and stroke [13]. Similarly, illness intrusiveness was reported to be useful for measuring the effectiveness of treatment and pivotal life-determining factors of illness [14]. We have found that self-rated health and illness intrusiveness were applicable in our study population and these tests were associated independently with increased risk for MACCE after controlling of biomedical factors.
The present study has several limitations. For example, a larger and more homogenous sample of patients is needed to more precisely assess the influence of different psychosocial factors on long-term mortality and morbidity. In addition, frequency of rehospitalisation could not be analyzed by this statistical method. We also did several comparisons without adjusting for multiplicity, thus the probability of the type I error is above the nominal 5%. Another limitation is that not all questionnaires were administered at all time points and the majority of the tests were sent at the end of the second and fifth year. Unfortunately, only BDI, STAI-S and STAI-T were measured at baseline. Other problem was that data regarding lifestyle factors and the postoperative rehabilitation were not collected; however, rehabilitation may theoretically reduce the incidences reported in this current study. On voluntary basis immediately after discharge six-week cardiac rehabilitation was offered to the patients. About 5% of the overage postcardiac population took part in the rehabilitation focused on stepwise physical load and dietary education.
In conclusion, depression, anxiety, illness intrusiveness, sleeping disorders and worse self-rated health were associated with increased hazard for MACCEs five years after cardiac surgery after adjustment of biomedical factors. By measuring psychosocial factors, the future ‘candidates’ for rehospitalisation could be detected earlier, and by treating these risk factors, rehospitalisation might be prevented.
This study was supported by grants from the Hungarian Research Foundation (OTKA-T-035169), Budapest, Hungary, and by National Research and Development Programs (NKFP 1b/020/2004), Budapest, Hungary.
