


Abstract
To investigate the effects on cerebral perfusion by experimental venous congestion of the superior vena cava (SVC) during bicaval cardiopulmonary bypass (CPB) at 34 °C, pigs were subjected to SVC obstruction at levels of 75%, 50%, 25% and 0% of baseline SVC flow at two arterial flow levels (low, LQ, high, HQ). The cerebral perfusion was examined with near-infrared spectroscopy (NIRS), cerebral microdialysis and blood gas analysis. SVC obstruction caused significant decreases in the NIRS tissue oxygenation index (TOI) and in SVC oxygen saturations (P<0.05, both groups), while the mixed venous saturation was decreased only in the LQ group. Sagittal sinus venous saturations were measured in the HQ group and found significantly reduced in response to venous congestion (P<0.05). No microdialysis changes were seen at the group level, however, individual ischemic patterns in terms of concomitant venous desaturation, decreased TOI and increased lactate/pyruvate occurred in both groups. The total venous drainage remained stabile throughout the experiment, indicating increased flow in the inferior vena cava cannula. The results indicate that SVC congestion may impair cerebral perfusion especially in the case of compromised arterial flow during CPB. Reduced SVC cannula flow may pass undetected during bicaval CPB, if SVC flow is not specifically monitored.
1. Introduction
The incidence of neurological complications after cardiac surgery ranges from a few to 16% [1–3], and concomitant risk factors are likely to affect outcome [4–7]. In cardiotomy procedures, separate drainage of the superior (SVC) and the inferior vena cava (IVC) is common, but venous flow measurement is optional. Thus, little information on the SVC and IVC interaction in venous drainage is available. Although venous congestion is a well-recognized phenomenon during cardiopulmonary bypass (CPB), the literature is sparse with reference to cerebral circulation [8, 9]. Impaired cerebral oxygenation due to total venous obstruction during deep hypothermia has been described in the pig [10]. However, partial obstruction during moderate hypothermia may constitute an even more common risk during CPB. To address this clinical problem, we designed an experiment using mild hypothermia in the pig. The effects of SVC congestion on cerebral perfusion were evaluated with near-infrared spectroscopy (NIRS), microdialysis and blood gas analysis.
2. Material and methods
Twelve pigs (29–39 kg) were prepared for bicaval CPB with SVC flow levels reduced to 75%, 50%, 25% and 0%, before returning to baseline flow, with each flow level lasting 30 min. In the first six animals, the arterial flow was 50 ml/kg/min and the FiO2 0.30 [low flow (LQ) group]. In the next six animals, mixed venous return blood oxygen saturation (SVO2) – adjusted baseline flow resulted in flow levels of 70–120 ml/kg/min [high flow (HQ) group] with FiO2 1.0. Arterial blood gases, mixed venous hematocrit and oxygen saturation were continuously monitored with a CDI™ Blood Parameter Monitoring System 500 (Terumo Europe N.V., Leuven, Belgium). SVC and sagittal sinus blood gas analyses were carried out every 10 min, and from the common venous and the arterial blood line every 15 min, at each congestion level (ABL 705, Radiometer Medical ApS, Brønshøj, Denmark). Regional cerebral oxygen saturation (rSO2) was measured using NIRS (NIRO-200, Hamamatsu Photonics Deutschland GmbH, Herrsching, Germany). The oxygenation indices include tissue oxygenation index (TOI) based on the proportions of oxygenated and total hemoglobin content in all vascular compartments, and on concentration changes in oxygenated hemoglobin (ΔO2Hb) and in deoxygenated hemoglobin (ΔHHb). Anticoagulation was kept at kaolin-activated clotting time (ACT) >450 s (Hemotech, Medtronic AB, Kista, Sweden).
All animals received humane care in compliance with the European Convention on Animal Care. The study was approved by the Uppsala Ethical Committee on Laboratory Animal Research.
2.1. Anesthesia
Anesthesia was induced by subcutaneous injection of xylazine (Rompun® 2.2 mg/kg, Bayer A/S, Lyngby, Denmark), and tiletamine/zolazepam (Zoletil 100® 6.0 mg/kg, Virbac S.A, Carros Cedex, France), and maintained by infusion of a buffered glucose solution carrier (Rehydrex® with glucose 25 mg/ml, Fresenius Kabi AB, Uppsala, Sweden) with ketamin 30 mg/kg/h (Ketaminol Vet® 100 mg/ml, Intervet AB, Stockholm, Sweden), fentanyl 0.04 mg/kg/h (Fentanyl 50 μg/ml, B. Braun Medical AB, Danderyd, Sweden), midazolam 0.1 mg/kg/h (Midazolam Hameln 1 mg/ml, Algol Pharma AB, Kista, Sweden), and pancuronium bromide 0.3 mg/kg/h (Pavulon® 2 mg/ml, Schering-Plough AB, Stockholm, Sweden). After intubation, ventilation was maintained by a Siemens Servo-i ventilator (Maquet GmbH & Co. KG, Rastatt, Germany).
2.2. Surgical preparation
A left femoral artery branch and the right external jugular vein were catheterized for pressure monitoring and blood sampling. A cerebral microdialysis catheter (CMA 70, CMA Microdialysis AB, Solna, Sweden) was inserted into the right hemisphere parenchyma through a parietal burr hole. The microdialysis perfusate was circulated by a micro-injection pump (CMA 107 MD pump, CMA Microdialysis AB, Sweden) at a rate of 0.3 μl/min. Vials were exchanged every 30 min at the onset of each SVC congestion period. The sagittal sinus was catheterized for blood sampling (HQ only). Cannulation was performed with a Stöckert 5.2 mm 90° angled arterial cannula (Sorin Group Deutschland GmbH, Munich, Germany), and with two snared Polystan 28 F straight venous cannulas (Maquet GmbH & Co. KG, Rastatt, Germany). The hemi-azygous vein was ligated.
The roller pump (Stöckert-Shiley Perfusion System, Sorin Group Deutschland GmbH, Munich, Germany) CPB system was primed with heparinized acetated Ringer's solution (Ringer-acetat, Fresenius Kabi AB, Uppsala, Sweden) and the perfusion was conducted at nasopharyngeal temperature 34 °C, with partial carbon dioxide pressure (PCO2) 4.5–5.5 kPa, with a Jostra Quadrox-i oxygenator, a Jostra hard-shell reservoir and standard Jostra polyvinyl chloride tubing (all Jostra products Maquet GmbH & Co. KG, Rastatt, Germany). The SVC flow was measured with an ultrasound detector (Centrimag Blood Pumping System, Levitronix GmbH, Zürich, Switzerland).
3. Data analysis and statistics
Data are expressed as means±standard deviation (S.D.). All statistical processing was carried out with GraphPad Prism 5.01 (GraphPad Software Inc., San Diego, CA, USA) and Microsoft Office Excel 2003 (Microsoft Corporation, Redmond, Washington, USA).
Within-group changes over time at the SVC flow levels 100%, 75%, 50%, 25% and 0% were tested using one-way analysis of variance (ANOVA) with post-hoc analysis for linear trends. The differences between total SVC occlusion and release at the last step (RP) was tested using Wilcoxon's matched pairs test. Suspected outliers were excluded only after applying Grubbs' test for outliers, and are mentioned in the results. P<0.05 was considered statistically significant.
4. Results
Twelve pigs were successfully connected to bicaval CPB with stepwise increments of the SVC obstruction. Two LQ cases were excluded due to inadequate baseline perfusion, resulting in 10 experiments being included (LQ n=4, HQ n=6).
4.1. General physiology
The central venous pressure (CVP) increased in response to the SVC obstruction in both LQ (1.8±4.5–25.7±4.9 mmHg, P<0.05) and HQ (4.5±4.8–19.5±9.3 mmHg, P<0.05). The effect of SVC occlusion release was statistically significant (LQ P<0.05, HQ P<0.05) (Fig. 1 ).
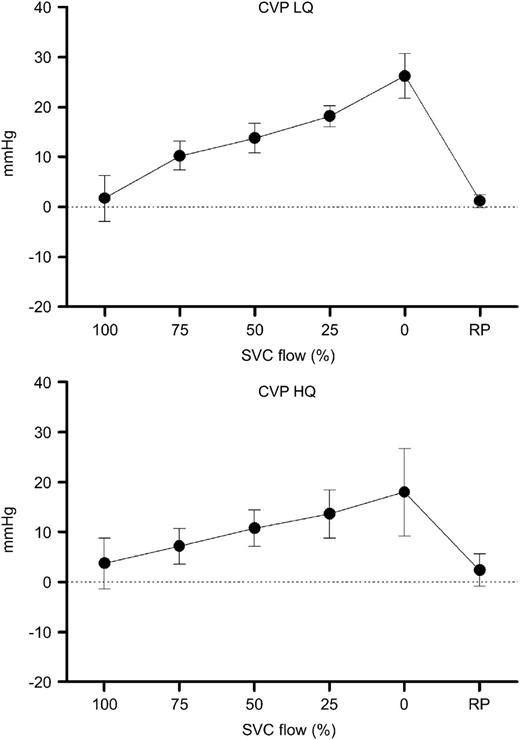
Central venous pressure (CVP) during progressive superior vena cava (SVC) obstruction. Increasing CVP is seen with each obstruction level. On release of SVC obstruction (RP), the CVP returns approximately to baseline level. LQ, low flow group; HQ, high flow group.
Slightly increased mean arterial pressure (MAP) with increasing SVC obstruction was found in the LQ group (50.2±11.9–52.8±5.8 mmHg), while the opposite was seen in the HQ group (67.2±14.7–62.2±11.8 mmHg). The mixed venous oxygen saturation (SVO2) decreased significantly in the LQ group (44.1±17.2–32.2±4.4%, P<0.05). In the HQ group, a similar but non-significant trend was present (54.4±2.9–46.1±13.2%, NS) (Fig. 2 ).
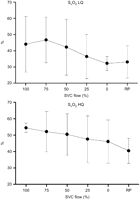
Mixed venous oxygen saturation (SVO2) during progressive superior vena cava (SVC) obstruction. SVO2 declined with increasing SVC obstruction both in the low flow (LQ) as well as in the high flow (HQ) group, however, it was not statistically significant in the latter. No change in SVO2 was seen in either group upon release of obstruction (RP).
4.2. Cerebral oxygenation
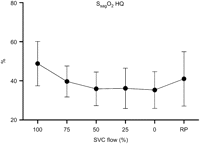
The mean TOI decreased significantly with increased SVC obstruction (LQ 53.3±4.1–47.1±5.9%, P<0.05, HQ 53.1±4.3–50.7±8.0%, P<0.05) (Fig. 3 ). This was true also for the mean oxygen saturation in the SVC (SsvcO2) (LQ 50.6±18.6–29.7±7.8%, P<0.05, HQ 72.2±6.6–53.0±12.7%, P<0.05) (Fig. 4 ) and in the sagittal sinus (SsagO2) (48.8±11.3–35.3±9.4%, P<0.05, only HQ) (Fig. 5 ). The NIRS parameter ΔO2Hb showed decreasing trends with increased obstruction (LQ, P<0.05; HQ, NS), while this was not the case for ΔHHb (LQ, NS; HQ, NS).
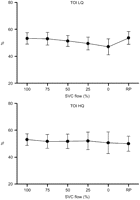
Tissue oxygenation index (TOI) during progressive superior vena cava (SVC) obstruction. TOI decreased significantly both in the low flow (LQ) and in the high flow (HQ) group. There was also an increase of TOI at release of obstruction, however, it was statistically significant only in the LQ group.
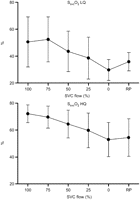
Superior vena cava (SVC) oxygen saturation (SsvcO2) changes with progressive SVC obstruction. A decline was observed both in the low flow (LQ) and the high flow (HQ) group. SsvcO2 increased upon release of obstruction (RP), however, it was statistically significant only in the LQ group.
Sagittal sinus venous oxygen saturation (SsagO2) registered in the high flow (HQ) group during progressive superior vena cava (SVC) obstruction. A decrease was seen along with increasing obstruction. A tendency towards increased SsagO2 was seen when obstruction was relieved (RP).
4.3. Cerebral microdialysis
Absolute values as well as relative changes from baseline for lactate, pyruvate, glucose and glycerol were analyzed, however, no significant trends could be seen with increasing SVC obstruction, nor for lactate/pyruvate ratio (L/P). Data are shown in Table 1 .
Cerebral microdialysis measurements and lactatepyruvate ratio (LP ratio) at various levels of superior vena cava (SVC) obstruction divided into low flow group (LQ) and high flow group (HQ). No significant differences were seen between the SVC obstruction levels
| SVC flow (%) | 100 | 75 | 50 | 25 | 0 | RP |
| LQ | ||||||
| Lactate (mmol/l) | 4.42±1.72 | 4.22±1.89 | 4.36±2.69 | 4.39±2.44 | 4.61±2.51 | 5.37±1.53 |
| Pyruvate (μmol/l) | 184.1±138.9 | 236.1±155.2 | 231.8±190.9 | 187.4±134.5 | 163.5±99.5 | 193.0±136.6 |
| Glucose (mmol/l) | 7.2±5.0 | 5.8±2.7 | 5.2±2.6 | 5.0±2.7 | 4.7±3.6 | 3.8±3.6 |
| Glycerol (μmol/l) | 85.3±43.9 | 42.8±19.4 | 33.9±12.6 | 36.4±16.6 | 31.4±18.2 | 39.2±5.3 |
| L/P ratio | 30.3±16.1 | 22.6±13.1 | 23.3±12.9 | 27.0±10.9 | 29.1±8.1 | 38.2±21.3 |
| HQ | ||||||
| Lactate (mmol/l) | 2.57±0.89 | 2.79±0.92 | 2.79±1.02 | 3.14±1.07 | 2.90±0.96 | 2.92±1.16 |
| Pyruvate (μmol/l) | 142.9±106.0 | 167.3±149.6 | 155.6±155.3 | 165.9±158.9 | 162.6±152.8 | 161.0±167.6 |
| Glucose (mmol/l) | 3.1±2.3 | 3.1±2.7 | 4.1±2.1 | 3.7±1.7 | 2.7±1.3 | 2.2±1.2 |
| Glycerol (μmol/l) | 28.6±6.2 | 27.8±14.4 | 27.9±13.4 | 26.9±9.3 | 29.1±7.3 | 28.9±8.8 |
| L/P ratio | 23.0±10.0 | 23.8±11.5 | 25.3±11.5 | 27.0±13.3 | 26.4±15.2 | 29.6±16.9 |
Data are expressed as means±S.D. One measured glycerol value in the LQ (100% flow) group was excluded after applying Grubbs' test for outliers.
4.4. Release of SVC occlusion
A statistically significant recovery of TOI was seen in the LQ (P<0.05) upon occlusion release (RP), but not in the HQ group. The same was true for SsvcO2 (LQ P<0.05, HQ NS). No significant effect was seen for SVO2, SsagO2, ΔO2Hb or in the microdialysis in either flow group.
4.5. Individual pattern analysis
Three key parameters, TOI, SsvcO2 and L/P, were selected to distinguish individuals showing signs of ischemic response pattern to SVC obstruction. Decreasing TOI and SsvcO2 combined with increased L/P ratio was observed in four of 10 pigs (nos 1 and 3 in the LQ and nos 7 and 8 in the HQ group). The increase in L/P was seen at total occlusion in nos 1 and 8 and on release of occlusion in nos 3 and 7 (Fig. 6 ).
Individual patterns of near-infrared spectroscopy (NIRS) tissue oxygenation index (TOI), oxygen saturation in the superior vena cava (SsvcO2) and cerebral microdialysis lactatepyruvate ratio (LP ratio) with progressive superior vena cava (SVC) obstruction. A combined decrease in TOI and SsvcO2 along with increased LP ratio is seen in experiment nos 1 and 3 in the low flow group (LQ) and in experiment nos 7 and 8 in the high flow group (HQ). In experiment nos 1 and 8 LP ratio tended to increase when SVC blood flow was restored (RP), while the opposite was seen in experiment nos 3 and 7. No such patterns were observed in the remaining experiments.
4.6. SVC and IVC blood flow relations
While the SVC flow was reduced by 100%, the variation in the total venous flow (IVC+SVC) was minor, ranging from –1.3 to 0.4% of baseline flow. Thus, the reduced SVC flow was compensated by the IVC at each obstruction level (Fig. 7 ).
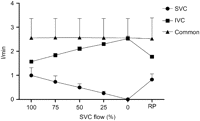
Venous blood flow relations between the superior vena cava (SVC), the inferior vena cava (IVC) and in the common venous tubing during progressive SVC obstruction. The decreased SVC venous drainage is fully compensated for by the IVC flow.
5. Discussion
To the best of our knowledge, this is the first report of cerebral effects of progressive SVC obstruction during mild hypothermia, a setting of relevance to the clinical conduct of CPB in adults. In comparison, Sakamoto et al. used smaller piglets, a 25 °C pH-stat regimen and abrupt SVC obstructions at the levels of 50% and 100% [10]. Cerebral blood flow (CBF) as well as TOI were decreased. ΔHHb was increased by total but not by partial SVC obstruction, while no significant changes were seen in ΔO2Hb, lactate in blood or SVO2. Our study revealed similar findings regarding the TOI, and with a continuous decline across the obstruction levels rather than a steep threshold at the last step. For SsvcO2 and SsagO2, a negative trend was seen. However, in contrast to Sakamoto's findings we observed significantly decreasing SVO2 and ΔO2Hb in the LQ group, a finding possibly explained by the difference in CPB temperature between the protocols.
The functionality of the venous drainage in pigs has been described by Lavoie et al., who suggest that the CBF is largely drained through paraspinal networks rather than through the jugular veins [11]. However, increased CVP suggest a physiologically significant congestion with impact on the cerebral perfusion pressure (CPP) in both groups. The possible presence of paraspinal anastomoses makes this model likely to underestimate the magnitude of the clinical problem, since the dominant cerebral drainage in man is through the internal jugular system.
There are some limitations to the present study. The open and non-randomized protocol combined with the limited number of experiments made us avoid direct comparisons between the LQ and HQ groups. However, we find that the intra-individual observations and within-group comparisons did not carry that bias, and the data have been analyzed accordingly. Furthermore, the increased FiO2 in the HQ group may have affected the oxygenation measurements compared with the LQ protocol. Nonetheless, significant TOI and SsvcO2 decreases were seen in both groups, although baseline SsvcO2 was markedly higher in the HQ group. Moreover, the lower MAP in the LQ group is likely to have generated lower CPP, with influence on the cerebral perfusion. Interestingly, individuals with signs of ischemic patterns appeared in both groups on combined analysis of TOI, L/P and SsvcO2. This might indicate the presence of ischemic responders in both groups despite the protocol differences. In the present material, the TOI decrease was minute compared with changes reported as dangerous after aortic arch surgery [12]. However, it cannot be ignored that more subtle changes may be of importance in patients with small margins due to cerebrovascular stenosis, autoregulatory dysfunction or inadequate global perfusion [1–3, 5, 6].
In conclusion, progressive SVC obstruction produced measurable signs of impaired cerebral perfusion in the present model. Individual animals showed patterns of ischemia, which raises the question of individual susceptibility to cerebral venous congestion. If not specifically monitored, reduction of the SVC flow may pass undetected due to compensatory increase of the IVC flow during CPB.
Grants: were obtained from the Erik, Karin and Gösta Selander's Foundation.
We would like to express our gratitude to Agneta Ronéus, Karin Fagerbrink and Maria Lundqvist at the Department of Medical Sciences, Clinical Physiology, Uppsala University for skilled technical assistance.
References
Author notes
These authors contributed equally to the work.
