


Abstract
Incidental mortality via entanglement in non-selective gillnets is a known conservation issue for marine birds globally, and specifically, in the productive marine waters of British Columbia, Canada. Three alcid species are particularly susceptible to gillnet bycatch (common murres Uria aalge, marbled murrelets Brachyramphus marmoratus (listed as “Threatened” under Canada’s Species at Risk Act) and rhinoceros auklets Cerorhinca monocerata), with estimates of mortality in commercial salmon net fisheries ranging from hundreds to thousands of individuals annually. Despite the risk posed by gillnets, the population-level impacts of mortality due to entanglement have not been estimated. Therefore, we wanted to (1) understand how varying levels of gillnet bycatch may impact population growth and persistence and (2) estimate the population size needed to withstand recent estimates of entanglement mortality. We used a simulation-based approach of matrix projection models to estimate the impact of gillnet bycatch on population growth and probability of extinction within 25 years. We found that the common murre population was the most vulnerable with current rates of gillnet bycatch producing a high probability of extinction. The population size needed to withstand current estimates of gillnet bycatch was estimated at over an order of magnitude higher than the current population size, indicating bycatch mortality in Canadian waters is taking common murres breeding in the USA. Extinction risk for marbled murrelets was estimated at ∼1% in 25 years given current estimates of gillnet bycatch, contributing to other anthropogenic threats such as loss and fragmentation of nesting habitat. Rhinoceros auklets had very low extinction risk due to the large population size compared to estimates of bycatch. This study highlights the species-specific differences in the impact of bycatch on these alcid populations and the importance of moving away from gillnets toward more selective fishing methods to reduce mortality of vulnerable seabird populations.
Introduction
Seabirds are one of the most threatened groups of birds with global populations declining by ∼70% between 1950 and 2010 due to a combination of threats such as anthropogenic climate change and the introduction of invasive species (Croxall et al. 2012, Paleczny et al. 2015). Fisheries bycatch is the second biggest threat to seabirds after invasive species and has the largest average impact on their populations (Dias et al. 2019). To date, most bycatch studies have focused on the population-level impacts of longlines, and the effects of gillnets on seabird populations have received less attention (Žydelis et al. 2009). Gillnet fisheries are common in coastal waters that overlap with foraging ranges of many seabird species causing entanglement and subsequent mortality of ∼400 000 individuals each year (Žydelis et al. 2013).
On the Canadian west coast, the commercial salmon gillnet fishery is responsible for the majority of seabird bycatch with an estimated average annual bycatch of 12 085 individuals (Ellis et al. 2013). This area is known for its high diversity of diving birds in the family Alcidae, such as common murres (Uria aalge), marbled murrelets (Brachyramphus marmoratus), and rhinoceros auklets (Cerorhinca monocerata). Specifically, in British Columbia, gillnet entanglement mortality for these three alcid species ranges from hundreds to thousands of individuals annually in summer and fall sockeye salmon (Oncorhynchus nerka) and chum salmon (Oncorhynchus keta) commercial gillnet fisheries (Bertram et al. 2021). Mortality due to gillnet entanglement is compounded by other threats such as oiling (Ellis et al. 2013, Bertram et al. 2023) and habitat destruction (Long et al. 2011), which may have contributed to known population declines of these species in British Columbia (Hipfner 2005, Rodway and Lemon 2011, Drever et al. 2021). Additional mortality is especially concerning for marbled murrelets, as they are already listed as “Threatened” under the Species at Risk Act in Canada (ECCC 2023) primarily due to loss of old-growth nesting habitat.
The Pacific Salmon Strategy Initiative (PSSI) was implemented in Canada in 2021 to conserve Pacific salmon (Oncorhynchus spp.) populations (FOC 2021). Following initial consultations with stakeholders, 22 longer-term commercial fishery closures were identified in 2022 (FOC 2024a), and for the 2024–2025 season, there are 10 closures in southern British Columbia (FOC 2024b) and 8 closures in northern British Columbia (FOC 2024c). The longer-term fishery closures are expected to remain in place until there are clear signs that salmon populations are rebuilding, which is expected to take a minimum of 5–10 years, or 1–2 salmon generations (FOC 2024a, FOC 2024d). In addition to fishery closures under the PSSI, the Pacific Salmon Commercial Licence Retirement Program was launched to provide an opportunity for commercial salmon troll, gillnet, and seine licence eligibility holders to apply to retire their licence eligibilities on a voluntary basis. The program is intended to “support a transition to a smaller commercial harvesting sector that is better aligned with the scope of future fishing opportunity and more financially viable” (FOC 2024e). The licence retirements focus on the gillnet fleet. Prior to the PSSI, there were 787 salmon gillnet commercial licenses eligible for the licence retirement program (Eng, H., DFO, pers. comm. 6 March 2025). Up to August 2024, 305 commercial gillnet licences were retired following three rounds of applications (FOC 2023, 2024f , 2024g ) with a fourth round underway at the time of writing.
The PSSI therefore represents major, transformational changes to reduce harvest, and to transition the salmon fishery away from gillnets toward more selective fishing methods with lower rates of incidental bycatch. Presumably, this is a positive outcome for vulnerable seabird species (Bertram 2023); however, the population level impacts of entanglement mortality have not been quantitatively assessed. The objective of this study was to quantify pre-PSSI population level impacts of commercial salmon gillnet entanglement mortality on the British Columbia populations of common murres, marbled murrelets, and rhinoceros auklets to understand the implications and risks of lifting the recently imposed restrictions. Specifically, we wanted to (1) understand how varying levels of gillnet bycatch may impact population growth and persistence and (2) estimate the population size needed to withstand recent estimates of entanglement mortality. To determine what level of bycatch would impact the population at its current level, we estimated population growth rate and extinction probability for varying levels of annual bycatch. We then estimated the population size needed to withstand estimated levels of annual bycatch from 2001 to 2016 (Bertram et al. 2021) to determine what population size would be needed to buffer the impact from pre-PSSI bycatch levels. The formal demographic models allowed us to include multiple sources of stochasticity/uncertainty to evaluate the role of gillnet bycatch to known population declines for alcids in Western Canada.
Methods
To examine the potential population level impacts of gillnet entanglement of common murres, marbled murrelets, and rhinoceros auklets in British Columbia, Canada (Fig. 1), we conducted a series of forward-looking simulations using matrix population models. The models combine multiple sources of stochasticity (environmental and demographic) along with parameter uncertainty by incorporating estimates of mean, uncertainty, and temporal variance of the demographic parameters (Schaub and Kéry 2021). Estimates (Tables 1–3) were obtained from the literature using estimates from locations and years in which the influence of bycatch was assumed to be minimal. If local data was not available, we used data from similar study systems. Expert opinion was used where data was lacking based on estimates from similar species. Specifically, we used estimates from other large auks, other murrelets, and puffins for common murres, marbled murrelets, and rhinoceros auklets, respectively. When mean estimates of survival were lower than expected given predictions for long-lived species, specific mean survival rate estimates were adjusted such that the average growth rate (lambda) was ∼1, resulting in long-term stable populations. For both marbled murrelets and rhinoceros auklets, we slightly increased the mean values for second year and older survival that were used in the model to produce an average growth rate of ∼1 (see Tables 2 and 3). In general, in the absence of induced mortality due to anthropogenic factors, we can expect wildlife populations to remain relatively stable over time despite annual fluctuations caused by environmental factors (Sibly et al. 2007).
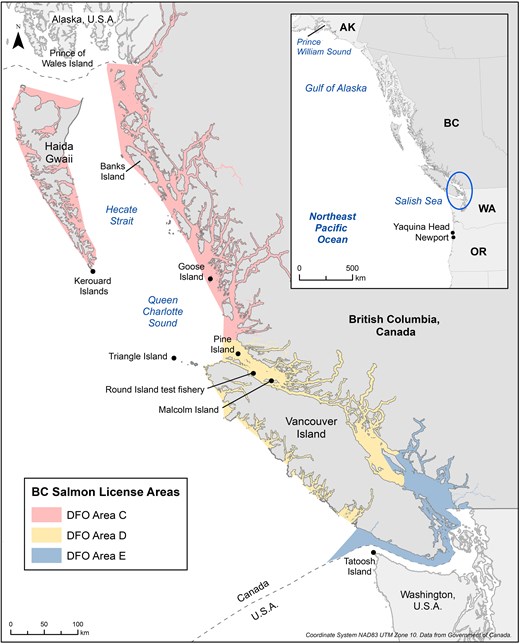
Map of study area in British Columbia, Canada, including Department of Fisheries and Oceans (DFO) Salmon License Areas where gillnet entanglement mortality was estimated by Bertram et al. (2021).
Input values for demographic parameters used in common murre simulation models.
| Model parameters | Estimate | Source |
|---|---|---|
| 1st year survival (s₁) | 0.53 (0.026) | Sarzo et al. (2019) |
| Temporal variability in s₁ | 0.2a | |
| 2nd year survival (s₂) | 0.87 (0.046) | Sarzo et al. (2019) |
| Temporal variability in s₂ | 0.2a | |
| 3rd year survival (s₃) | 0.96 (0.015) | Sarzo et al. (2019) |
| Temporal variability in s₃ | 0.2a | |
| 4th + year survival (s4) | 0.89 (0.047) | Lee et al. (2008) |
| Temporal variability in s4 | 0.1a | |
| Productivity (f) | 0.7 (0.007) | Hipfner and Greenwood (2008) |
| Temporal variability in f | 0.1a | |
| Age at first breeding | 6 | Manuwal et al. (2001), Rodway et al. (2017) |
| Breeding propensity (bp) | 0.96 | Lee et al. (2008) |
| Population size | 4 704b | Hipfner (2005) |
| Average annual gillnet entanglement mortality | 2 846c | Bertram et al. (2021) |
| Derived parameters | ||
| Initial population size: 1st year (N₁) | 1 172d | |
| Initial population size: 2nd year (N₂) | 1 019d | |
| Initial population size: 3rd year (N₃) | 977d | |
| Initial population size: 4th year (N4) | 873d | |
| Initial population size: 5th year (N₅) | 781d | |
| Initial population size: 6th + year (N6+) | 6 586d | |
Specific details regarding the derivation and use of model parameters can be found in the “Methods” section. Uncertainty in demographic parameter estimates, where available, is reported as standard error.
Uncertainty in estimates reported as SE and temporal variability reported as SD.
Determined using expert opinion based on estimates from other large auks.
Breeding individuals; 2003–2004 estimate.
Number of individuals.
Calculated as stable age distribution based on population size.
Input values for demographic parameters used in marbled murrelet simulation models.
| Model parameters | Estimate | Source |
|---|---|---|
| 1st year survival (s₁) | 0.51 (0.07) | Parker et al. (2003) |
| Temporal variability in s₁ | 0.1 | Peery and Henry (2010) |
| 2nd + year survival (s₂) | 0.933 (0.05)a | Cam et al. (2003) |
| Temporal variability in 2nd + year survival (s₂) | 0.01b | |
| Productivity (f) | 0.21 (0.03)c | Bradley et al. (2004), Gutowsky et al. (2009) |
| Temporal variability in f | 0.15 | Bradley et al. (2004) |
| Age at first breeding | 2 | Nelson (2020) |
| Breeding propensity (bp) | 0.5 | McFarlane Tranqullia et al. (2003) |
| Population size | 99 100d | ECCC (2023) |
| Average annual gillnet entanglement mortality | 228e | Bertram et al. (2021) |
| Derived parameters | ||
| Initial population size: 1st year (N₁) | 5 116f | |
| Initial population size: 2nd + year (N2+) | 93 984f | |
Specific details regarding the derivation and use of model parameters can be found in the “Methods” section. Uncertainty in demographic parameter estimates, where available, is reported as standard error.
Uncertainty in estimates reported as SE and temporal variability reported as SD.
Mean survival rate estimate increased to produce stable population.
Determined using expert opinion based on estimates from other murrelets.
Female fledglings per breeding female.
Total individuals; 2006 estimate.
Number of individuals.
Calculated as stable age distribution based on population size.
Input values for demographic parameters used in rhinoceros auklet simulation models.
| Model parameters | Estimate | Source |
|---|---|---|
| 1st year survival (s₁) | 0.62 (0.034)a | Thayer Mascarenhas (2009) |
| Temporal variability in s₁ | 0.1b | |
| 2nd + year survival (s₂) | 0.893 (0.02)c | Morrison et al. (2011) |
| Temporal variability in s₂ | 0.0001 | Morrison et al. (2011) |
| Productivity (f) | 0.43 (0.001) | Borstad et al. (2011) |
| Temporal variability in f | 0.18 | Borstad et al. (2011) |
| Age at first breeding | 3 | Gaston and Dechesne (2020) |
| Breeding propensity (bp) | 1 | Kyle Elliot (personal communication) |
| Population size | 200 000d | Rodway et al. (2017) |
| Average annual gillnet entanglement mortality | 641e | Bertram et al. (2021) |
| Derived parameters | ||
| Initial population size: 1st year (N₁) | 54 899f | |
| Initial population size: 2nd year (N₂) | 35 046f | |
| Initial population size: 3rd + year (N3+) | 400 000f | |
Specific details regarding the derivation and use of model parameters can be found in the “Methods” section. Uncertainty in demographic parameter estimates, where available, is reported as standard error.
Uncertainty in estimates reported as SE and temporal variability reported as SD.
Mean survival is calculated at 70% of adult survival.
Determined using expert opinion based on estimates from puffins.
Mean survival rate estimate increased to produce stable population.
Breeding pairs; estimate from the 1980s.
Number of individuals.
Calculated as stable age distribution based on population size.
For each species, we began by defining (1) the mean value for each demographic rate (survival and productivity) along with estimates of (2) parameter uncertainty and (3) temporal variability in each demographic rate (assumed to be known without error). The mean value for each demographic rate along with the estimates of parameter uncertainty were used to define a distribution for each demographic rate. For survival, the mean and parameter uncertainty were used to define a beta distribution. For productivity, the mean and parameter uncertainty were used to define a normal distribution. A random number generator was used to draw a single value from each of these distributions. This allowed us to obtain a single mean value for each demographic rate while accounting for parameter uncertainty.
The mean value of each demographic rate obtained from the previous step was used, along with the estimate of temporal variability, to define a normal distribution for each demographic rate. Using a random number generator again, we drew multiple values from these distributions corresponding to the number of time steps (n = 25). This allowed us to obtain 25 mean values for each demographic rate while accounting for temporal variability. These values were then used to project the population over time using transition equations including demographic stochasticity. We repeated this projection many times (n = 50 000) using Markov Chain Monte Carlo simulations. For all analyses, we used program JAGS (Plummer 2003) called from R (R Core Team 2023) using the jagsUI (Kellner 2021) and IPMbook (Schaub et al. 2022) packages (see Supplement 1 for model code).
For common murres, population equations including demographic stochasticity were formulated using 6 age classes: 1st to 5th year individuals (
Here, we assume that only individuals aged 6 years and older breed. We assume that individuals survive their 1st year of life with
For marbled murrelets, population equations including demographic stochasticity were formulated using 2 classes: 1st year individuals (
Here, we assume that individuals survive their 1st year with
Finally, for rhinoceros auklets, population equations including demographic stochasticity were formulated using 3 classes: 1st year individuals (
Here, we assume that individuals survive their 1st year with
We used two methods to address our study objectives, each of which utilized the same base matrix population model as defined above. To address our first study goal, we ran bycatch simulations in which we started with a fixed initial population size and varied the amount of annual bycatch. Initial population size vectors were calculated assuming a stable age distribution based on the mean vital rates and most recent population size estimate (Tables 1–3, Frederiksen et al. 2019). To run the bycatch simulations, we projected the matrix population model over 25 years while removing a set number of individuals annually due to bycatch. We started with a baseline of 0 individuals being killed annually through bycatch and increased by 100 individuals/year up to a maximum of 1000 individuals/year. Data on the proportion of juveniles versus adults killed due to bycatch (Smith and Morgan 2005; Wilson, unpublished data) were used to partition removals by age. Our two data sources disagreed for common murres, so we used bycatch compositions of both 30% adults (
To address our second study goal, we ran population size simulations in which we varied the initial population size with a fixed amount of annual bycatch. Rates of annual gillnet entanglement mortality for common murres, marbled murrelets, and rhinoceros auklets were obtained from Bertram et al. (2021), which were estimated at ∼2846 (95% CI: 2628–3047), 228 (95% CI: 156–346), and 641 (95% CI: 549–770) individuals, respectively. We projected the matrix population model again over 25 years while varying the initial population size. We then determined the probability of extinction at that fixed level of bycatch given different starting population sizes. We use 5% and 10% extinction probabilities as benchmarks to indicate a 95% and 90% chance of remaining extant over the simulation, respectively.
To test overall model sensitivity to age at first breeding, we ran different versions of the models above but varied the age at first breeding by either adding or removing age classes (see model code in Supplement 1).
Results
For the common murre bycatch simulations, lambda decreased from 1.00 (SD 0.04) with no bycatch down to lambda of 0.81 (SD 0.09) and 0.73 (SD 0.8) with 1000 individuals removed annually for the majority juvenile and majority adult proportions, respectively (Fig. 2A). For marbled murrelets, lambda decreased from 0.99 (SD 0.05) under no bycatch down to 0.96 (SD 0.09) with 1000 individuals removed annually (Fig. 2B). For rhinoceros auklets, lambda decreased from 0.99 (SD 0.02) in the no-bycatch scenario, down to 0.98 (SD 0.02) with 1000 individuals removed annually (Fig. 2C).
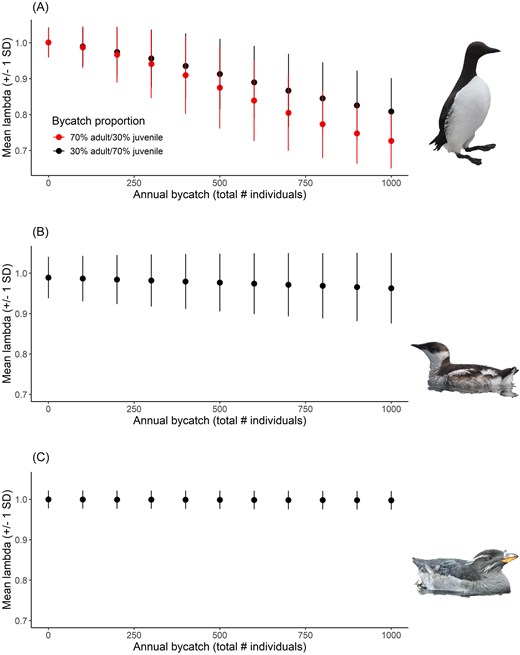
Change in mean population growth (lambda; ± SD) over 25 years for (A) common murre, (B) marbled murrelet, and (C) rhinoceros auklet under varying levels (and proportions where applicable) of bycatch. For panel A, red shows the projection where the majority of individuals being killed from bycatch are adults, while black shows the projection where the majority of individuals being killed from bycatch are juveniles.
As expected, extinction probability for common murres was estimated at 0% for both bycatch proportions under the no bycatch scenario and increased with 1000 individuals removed annually to 57% and 98% for the majority juvenile and majority adult proportions, respectively (Fig. 3B). Similarly, extinction probability for both marbled murrelets and rhinoceros auklets was estimated at 0% under the no bycatch scenario (Fig. 3B and C). For marbled murrelets, extinction probability increased to 1% at 200 individuals killed per year and reached 8% at 1000 individuals killed (Fig. 3B). In contrast, extinction probability was 0% for rhinoceros auklets under all bycatch scenarios (Fig. 3C).
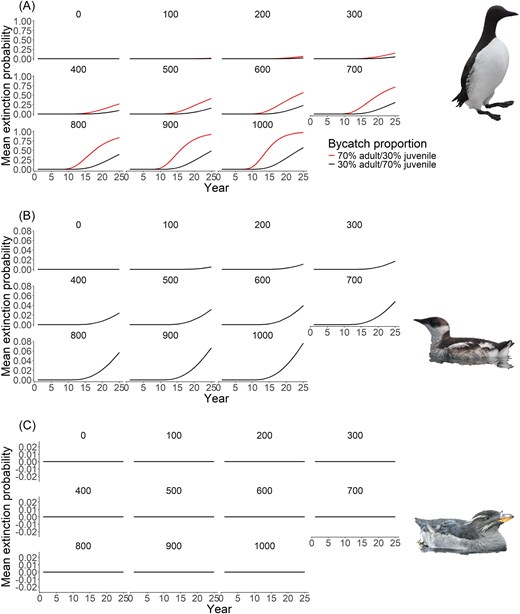
Mean extinction probability over 25 years for (A) common murre, (B) marbled murrelet, and (C) rhinoceros auklet under varying levels (and proportions where applicable) of bycatch. For panel A, red shows the projection where the majority of individuals being killed from bycatch are adults, while black shows the projection where the majority of individuals being killed from bycatch are juveniles.
The impact of bycatch was reflected in the population projections, with total common murre population size after 25 years increasing by ∼18% from 11 408 individuals to around 13 200 individuals assuming no bycatch for both the majority juvenile and majority adult scenarios (Fig. 4A). Under the highest level of bycatch, we saw a 100% decrease from 11 408 individuals down to 0 individuals for both the majority juvenile and majority adult scenarios (Fig. 4A). Marbled murrelets also increased slightly by 0.2% from 99 100 individuals to 99 323 individuals under the no bycatch scenario (Fig. 4B). Under the highest level of bycatch, we saw a 24% decrease from 99 100 individuals down to 75 212 individuals (Fig. 4B). Similarly, for the rhinoceros auklet population size, we saw an increase of 1.5% under the no bycatch scenario from a starting population size of 489 945 individuals to 497 032 individuals (Fig. 4C). Under the highest level of bycatch, we saw a 3.5% decrease from 489 945 individuals down to 472 566 individuals (Fig. 4C).
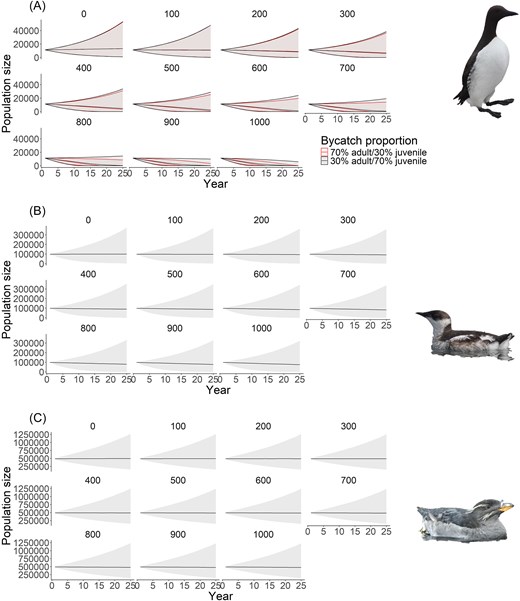
Projection of total population size over 25 years for (A) common murre, (B) marbled murrelet, and (C) rhinoceros auklet under varying levels (and proportions where applicable) of bycatch. Solid line indicates median population size, and shading shows 95% CI. For panel A, red shows the projection where the majority of individuals being killed from bycatch are adults, while black shows the projection where the majority of individuals being killed from bycatch are juveniles.
Initial population size simulations revealed that the population size for common murres would need to be ∼131 000 and 185 000 total individuals to reduce extinction risk to 10% and 5%, respectively, under recent estimated bycatch levels (from Bertram et al. 2021) under the majority adult scenario (Fig. 5A). Under the majority juvenile scenario, the population size would need to be ∼80 000 and 109 000 total individuals to reduce extinction risk to 10% and 5%, respectively (Fig. 5A). For marbled murrelets, the population size would need to decline to ∼19 000 and 35 000 to reach a 10% and 5% probability of extinction, respectively, under the most recent estimates of bycatch (Fig. 5B). Under the most recent estimates of annual bycatch for rhinoceros auklets, the population size would need to fall drastically to around 30 000 individuals to approach a 5% or 10% chance of extinction in 25 years (Fig. 5C).
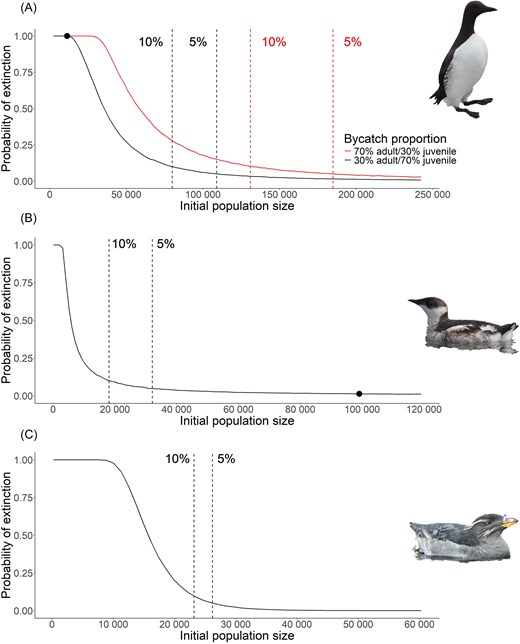
Projection of extinction risk over 25 years for (A) common murre, (B) marbled murrelet, and (C) rhinoceros auklet under varying initial population sizes given most recent estimates of annual bycatch. Red dashed lined indicates population size with 10% chance of extinction, black dashed line indicates population size with 5% chance of extinction. For panels A and B, black dot indicates current population size estimate. Population size estimate for rhinoceros auklet is ∼200 000 to 300 000 pairs. For panel A, red shows the projection where the majority of individuals being killed from bycatch are adults, while black shows the projection where the majority of individuals being killed from bycatch are juveniles.
Simulation results were similar for the models in which we varied the age at first breeding and did not change our overall conclusions (see Supplement 2).
Discussion
Quantifying the population level impacts of gillnet entanglement mortality on common murres, rhinoceros auklets, and marbled murrelets is critical given that their populations show evidence of historic declines (Hipfner 2005, Rodway and Lemon 2011, Drever et al. 2021). While we calculated absolute extinction probabilities for these species, our results do not allow us to predict with certainty how likely the population is to fall to zero. However, our results do allow us to compare the relative risks (Beissinger and Westphal 1998, Morris and Doak 2002, McCarthy et al. 2003) of different levels of bycatch. Due to the complexity and variability of ecological systems, predicting the future behavior of stochastic systems is inherently uncertain and only reliable over short time periods (Fieberg and Ellner 2000, Morris and Doak 2002). Given this caveat, we used a relatively short simulation period of 25 years over which to examine the relative impacts of varying levels of bycatch on these three alcid species. We used an absolute extinction probability, that is, a population size of zero rather than a quasi-extinction probability. As such, the risks reported here are likely underestimated given that the populations may be functionally extinct below a threshold population size. In other words, the probability that the population decreases to zero will always be lower than the population decreasing to a non-zero but functionally extinct population size. Given that the populations of all three species are currently declining, if these populations continue to decline, then extinction may become an issue in the future. Additionally, we do not include immigration or emigration in our models, which could work to either rescue or further reduce the populations, respectively. Overall, the results presented here are potential scenarios under a specific set of simplified circumstances and, as such, may not represent true population-level impacts of bycatch on these species.
Our results indicate that the British Columbia population of common murres could be the most impacted across all metrics relative to the other species, given their small population size and potentially large number of individuals killed annually due to bycatch. The results support the conclusion that not all birds killed could be local, but rather, represent a mix of local birds breeding on small colonies on Triangle Island and the Kerouard Islands (4327 and 377 birds in 2003–2004, Hipfner 2005) and visitors from much larger colonies in Alaska to the north (∼2396 940 breeding pairs), and Washington (∼25 880 breeding pairs), and Oregon to the south (∼628 708 breeding pairs; Ainley et al. 2021, Bertram et al. 2021). It is difficult to estimate the proportion of local birds that are captured in the British Columbia gillnet fisheries. Common murres are found throughout British Columbia in summer and fall (Kenyon et al. 2009, CWS unpubl. data) in areas that overlap with sockeye and chum gillnet fisheries, which deploy rectangular set nets that hang from floats in surface waters, attached to vessels or the shoreline. However, most of the bycatch mortality in British Columbia has been assumed to consist of individuals that originate from the larger breeding colonies to the south (Washington and Oregon) and north (Alaska; Hamel et al. 2008, 2009, Hipfner 2015, Bertram et al. 2021). Genetic markers cannot be used to gauge provenance since there is no genetic differentiation between subspecies of common murres in the Pacific (Morris-Pocock et al. 2008).
Satellite tracking studies initiated off the Yaquina Head colony, near Newport, Oregon (Loredo 2018, Loredo et al. 2019) show extensive northward movements of common murres in summer and fall to waters throughout British Columbia (Salish Sea, West Coast Vancouver Island, Queen Charlotte Sound, off Goose Island and Banks Island in Hecate Strait) and SE Alaska (Prince of Wales Island) as far north as the Gulf of Alaska off Prince William Sound (Fig. 1). The West Coast of Vancouver Island, and particularly the Southern Salish Sea were areas of intense use during breeding and non-breeding periods, which is also supported by at-sea observations (Gaydos and Pearson 2011). Additional tracking studies from a colony in Washington State (Tatoosh Island) show extensive movements of murres to the West Coast of Vancouver Island (British Columbia) and southern Salish Sea (Hamel et al. 2008). The distribution of the murres overlapped with gillnet fisheries and British Columbia (Area E) and Washington, and it was estimated that 2298 birds per year could have been entangled between 1969 and 2007, representing a total of almost 90 000 birds (Hamel et al. 2009). Tracking studies of murres in Alaska are rare (e.g. Takahashi et al. 2021), and there is no evidence of movements into British Columbia waters or band recoveries in British Columbia from colonies in Alaska. In British Columbia, a tracking study from Triangle Island in 2006 and 2007 (BCMCA 2013) showed that murres tended to remain around the colony during breeding (June and July) but moved east toward the mainland coast following breeding (August–October) and then headed north and south, where they could overlap with sockeye and chum salmon gillnet fisheries in the central (Area C) and north coasts (Area D) of British Columbia. Indeed, a banded adult murre from Triangle Island was captured in a gillnet fishery for sockeye near Malcolm Island in Area D in Queen Charlotte Sound in August 2006 (Bertram et al. 2021).
The high risk of pre-PSSI bycatch to the small common murre populations from British Columbia highlights the need for current monitoring and banding efforts, particularly on Triangle Island, and also to establish the provenance of birds captured from the USA. The paucity of tracking studies from Alaska represents an invitation to researchers to determine if Alaskan common murres are killed in British Columbia gillnet fisheries in the same manner that birds from Washington and Oregon are entangled in gillnet fisheries from both the Canadian and American zones of the Salish Sea (Hamel et al. 2008, 2009). However, if we use the annual estimate of 2298 birds killed per year from Hamel et al. (2009) as a rough estimate of the number of non-local birds being killed, that represents ∼80% of our 2846 per year estimate from Bertram et al. (2021). This suggests that ∼20% (or 549 birds per year) could potentially be local birds, which still gives a high chance of extinction in 25 years depending upon the scenario (∼45% and 18% for the majority adult and majority juvenile proportions, respectively). If only half of that (10%) are local that still gives ∼15% and 5% chance of extinction over 25 years. So, while our simulation estimates likely overestimate the potential impact on the local British Columbia population of common murres, we can see that even a fraction of the estimate produced from Bertram et al. (2021) would still result in a relatively high risk of extinction for this population over the simulation period.
The modeling revealed relatively little impact of bycatch on rhinoceros auklets, likely due to their large population size in British Columbia, coupled with the potential underestimation of the number of birds killed during 2001–2016 when bycatch rates were estimated (Bertram et al. 2021). At that time, most of the observer data were collected at a location where incidental take was minimal (Round Island test fishery) and did not include large observed catches in the 1990s when fishing effort was 2–3 times higher (Bertram et al. 2021) in the vicinity of the largest colony in British Columbia (Pine Island). Long-term monitoring (1984–2011) of breeding populations of rhinoceros auklets at four of the largest colonies in British Columbia demonstrated a 17% decline at Pine Island (Rodway and Lemon 2011). Most of the decline occurred in the early part of the time series (1984–1992) when historic fishing effort and, presumably, bycatch rates were 2–3 times higher than during our study. More recent census data suggests population recovery on Pine Island and stable or increasing trends for other large colonies (Wilson and Smith, unpublished analyses). In the present study, we pooled all colony counts into a single estimate and did not attempt to examine trends on individual colonies, although our results suggest that bycatch could become a problem if it was focused on a single colony smaller than 30 000 birds.
We found a moderate impact of gillnet mortality on marbled murrelets, and this inference is particularly important given their “Threatened” conservation status. The species is listed due to loss of old growth nesting habitat, but oiling, and gillnet bycatch are known anthropogenic threats (ECCC 2023). Under the Species at Risk Act, if recovery is feasible, the population and distribution objectives will be set to assist the recovery and survival of the species, and all possible efforts must be made for protection from human-caused threats (ECCC 2020). The cessation, avoidance, and mitigation of gillnet entanglement mortality of marbled murrelets are therefore compliant with the Act (Bertram 2023).
Methods that may reduce seabird bycatch in gillnet fisheries include license buy-backs, temporal closures/incentives to shift timing of fishing, fishery closures, area closures around breeding colonies and bird foraging hotspots, abundance-based fishery openings, gear modifications related to net visibility and net specifications, acoustic deterrents, above-water scaring, gear switching, mitigation fines, and disincentives (Bertram 2023, O'Keefe et al. 2023). While there has been considerable effort to develop technical and timing solutions to reduce entanglement of diving birds in gillnets (Melvin et al. 2001, Martin and Crawford 2015, Field et al. 2019, Rouxel 2021, Montevecchi et al. 2023), there is not a solution that does not also reduce the catch of the target species. While threats from gillnet bycatch have been dramatically reduced in British Columbia, it remains an ongoing and emerging threat elsewhere in Canada. Similar to our modeling work, Gutowsky et al. (2024) used population viability analysis to show how bycatch from Canadian fisheries could impede population recovery of Northern Fulmars (Fulmarus glacialis) in the Arctic. At-risk populations of Yellow-billed loons (Gavia adamsii) are captured in gillnets in the Arctic but not in traditional fisheries using weirs (Mallory et al. 2022) and highlight the importance of more selective fishing methods and alternative gear to reduce the impacts of future fisheries on marine birds. Gillnet entanglement mortality is an ongoing threat in the USA as well. A recent study of salmon gillnet fisheries in Alaska found that, consistent with the findings of Bertram et al. (2021), alcids such as common murres and marbled murrelets are the species most frequently caught as bycatch (Dietrich et al. 2025). The authors suggest several practices to aid in reducing marine bird bycatch, such as reducing night and twilight fishing, keeping nets clean, tending nets more frequently, and keeping nets under tension.
We have a unique opportunity to monitor the British Columbia populations of these three alcid species following the implementation of the PSSI to try to see how populations respond to reduction in gillnet fishing. Regular et al. (2013) demonstrated that population trends of alcid species such as Atlantic puffins (Fractercula arctica), razorbills (Alca torda), and common murres in Eastern Canada rebounded after fishery closures and subsequent removal of gillnets in 1992. The results of that study imply that we may also be able to detect rebound recovery for the common murre population on Triangle Island and perhaps also for populations of the rhinoceros auklet and marbled murrelet in British Columbia, given sufficient monitoring efforts. For the rhinoceros auklet, a long-term burrow monitoring program visits major colonies every 5 years. For the marbled murrelet, a long-term monitoring program at 58 radar stations provides enough power to detect trends >2.0%/year (Drever et al. 2021). In contrast, the British Columbia common murre population has only been counted on Triangle Island and Kerouard Islands in 1989 and 2003/2004, and we suggest that a more regular monitoring program is warranted. Given our modeling results, coupled with reported reproductive failures (Hipfner et al. 2011) and potential mortality related to recent ocean warming (Renner et al. 2024), we predict that the common murre population on Triangle Island is currently at a historic low.
Considering that gillnet entanglement mortality is one factor among many that may be impacting these populations, future demographic studies can build upon our models to include and evaluate contributions of other regional threats to marine birds, including oiling (e.g. Fox et al. 2016, O'Hara et al. 2024), habitat destruction (e.g. Long et al. 2011), invasive species (e.g. Harfenist and Kaiser 1997), climate warming impacts on prey populations (e.g. Hedd et al. 2006), and top-down impacts on reproduction (e.g. Hipfner et al. 2011). For example, North Pacific common murre populations faced extreme mortality (as high as 4 million birds) and reproductive failure during the unprecedented marine heatwave of 2014–2016 (Piatt et al. 2020, Jones et al. 2024, Renner et al. 2024). Consequently, the loss of a significant portion of the common murre population due to gillnet bycatch, on top of basin-scale ocean climate impacts, could potentially be even more consequential.
Overall, this study highlights the need for long-term monitoring of these vulnerable seabird populations to obtain robust and reliable demographic estimates. Long-term studies capture important variability in these stochastic systems that may be overlooked in shorter demographic studies. Specifically for common murres, future studies are needed in order to understand the seasonal movements of individuals from elsewhere into British Columbia waters. Additionally, future studies should incorporate other known impacts on survival and reproduction, such as oiling, ocean climate change, and habitat destruction to quantify the cumulative effects of such anthropogenic activity. For rhinoceros auklets, future studies should examine how higher levels of bycatch might impact the population given that entanglement mortality is likely underestimated for this species. For species like marbled murrelets, listed under the Species at Risk Act, protection from human-caused threats is the policy requirement for the Government of Canada (ECCC 2020). Addressing impacts of gillnet bycatch given the “mixed-stock” dynamics of Canadian versus American populations of common murre will present a conservation challenge to wildlife managers.
Acknowledgements
We thank Ken Morgan for helpful discussions and Mark Hipfner for data reported in Borstad et al. (2011). Mark Mallory kindly alerted us to information on the absence of Yellow-billed loon bycatch in Arctic Weir fisheries.
Author contributions
All authors contributed to project conceptualization, methodology, and interpretation of results. S.E.D. led data curation, with critical assistance from G.J.R., L.W., and D.F.B., and conducted formal data analysis, with assistance and guidance by D.I. and G.J.R. S.E.D. led the writing of the manuscript, and all authors contributed critically to the drafts and gave final approval for publication.
Conflict of interest
None declared.
Funding
Funding was provided by Environment and Climate Change Canada through the Canadian Wildlife Service and the Science and Technology Branch’s Wildlife Research Division.
Data availability
The data underlying this article are available in the article and in its online supplementary material.
