


Abstract
Fisheries science agencies are responsible for informing fisheries management and ocean planning worldwide, often requiring scientific analysis and management actions across multiple spatial scales. For example, catch limits are typically defined annually over regional scales, fishery bycatch rules are defined at fine spatial scales on daily to annual time scales, and aquaculture and energy lease areas are defined over decades for subregional permitting at intermediate scales. Similarly, these activities require synthesizing monitoring data and mechanistic knowledge operating across different spatial resolutions and domains. These needs drive a growing role for models that predict animal presence or densities at fine spatial scales, including daily, seasonal, and interannual variation, often called species distribution/density models (SDMs). SDMs can inform many ocean management needs; however, their development and usage are often haphazard. In this paper we discuss various ways SDMs can and have been used in stock, habitat, protected species, and ecosystem management activities as well as marine spatial planning, survey optimization, and as an interface with ecosystem and climate models. We conclude with a discussion of future directions, focusing on information needs and current development, and highlight avenues for furthering the community of practice around SDM development and use.
Introduction
Understanding how species are distributed in space and time and the factors that drive spatiotemporal patterns in abundance are central questions in ecology and important for species conservation and management. Resource management agencies are responsible for providing scientific advice, often over multiple spatial and temporal scales, to inform fisheries management and ocean decision-making worldwide. For example, ship speed rules and fishery bycatch rules can be defined at fine (e.g. <10 km) spatial scales and on daily to annual time scales, quota allocation and catch limits are typically defined annually over regional scales, and aquaculture and energy lease areas are defined over decades for subregional permitting at fine to intermediate (e.g. 10–200 km) spatial scales (Fig. 1). As climate and ocean conditions change, fish species may experience changes in their productivity or their preferred environmental conditions and locale (Pinsky et al. 2013, Poloczanska et al. 2016, Barange et al. 2018), resulting in new risks and opportunities. Changes in species distributions pose significant challenges and risks for fisheries managers as well as the communities that depend on marine resources (Pinsky et al. 2018, Karp et al. 2019). For example, in the USA, recent marine heatwaves on both coasts have led to increased human–whale interactions, and warming waters have led to fishery stocks moving across jurisdictional boundaries (Pinsky et al. 2013, Santora et al. 2021). There is thus a high and growing demand for information on species’ distributions at different spatial and temporal scales for use in fishery management and other ocean use decision-making (e.g. energy, transportation; Fig. 1).

Stommel diagram of the various time and spatial scales of management decisions that utilize species distribution information and modeling.
Species distribution models (SDMs) (including the suite of models often referred to as habitat suitability models or climate envelope models) are valuable statistical tools that are increasingly being used to describe species distributions, characterize species-habitat relationships, and predict species responses to changing environmental conditions to support management and conservation decision-making (Zurell et al. 2022). At their simplest, SDMs use statistical methods to relate species behavior, occurrence, or abundance to underlying spatial and environmental conditions to predict species distributions. Many methods are used to fit SDMs, including but not limited to, generalized linear and additive models (GLMs and GAMs), maximum entropy models, machine learning algorithms, decision trees (e.g. boosted regression trees), and spatiotemporal (“geostatistical”) models. The modeling methods differ in their underlying assumptions and mechanisms, and the choice of modeling method is often based on the nature of the data and/or the question being addressed (Elith and Leathwick 2009).
Successful application of species distribution modeling typically leads to identification of covariates related to the distribution and abundance of that species. These covariates can range from relatively fixed attributes such as latitude, longitude, depth, substrate type, season, etc. to more dynamic characteristics of the environment. These dynamic measures can be a snapshot of the changing environment, such as the immediate physical conditions, water quality, and biological characteristics that may vary widely over time and space. Species distribution modeling seeks to quantify and unravel the complex amalgamation of physiological requirements, behavioral preferences, predatory/competitive constraints, and stochastic processes that drive where a species occurs in time and space. Habitat quality and suitability can therefore be estimated from the successful application of species distribution modeling. When robust, the fitted species-environment relationships can be used with new environmental data to predict future distribution patterns or distribution in unsampled areas (Guisan and Thuiller 2005, Elith and Leathwick 2009).
In this paper, we discuss various ways that SDMs can and have been used to inform stock assessments, spatial fisheries management, and conservation decisions and understand impacts of climatic variability across temporal scales. We conclude with a discussion of future directions, focusing on information needs and current development, and highlight avenues for future collaboration. The examples draw on the authors’ experience working within the USA and on the wealth of data and research being conducted across diverse marine ecosystems. We note that while many of our example applications, lessons learned, and recommendations stem from experiences within the USA, our recommendations are also applicable to other fisheries management organizations and entities involved in marine resource management.
Applications of SDMs in living marine resource management
SDMs are used to help answer a variety of science and management questions. Here, we discuss how SDMs can and have been used to inform decisions related to survey design and optimization, fisheries stock assessments, designating essential fish habitat (EFH), spatial management decisions, and to understand impacts of climate variability. For each application category, we provide background about the management issue and how SDMs can help address the issue.
Survey design and optimization
SDMs can be used to effectively guide survey planning and optimization activities (Zwolinski et al. 2011, Zhang et al. 2020, Oyafuso et al. 2021). Fishery-independent surveys are of particular importance as a key source of information to inform ecological studies, conservation, and management plans, and are often the primary source of information on abundance and age/length compositions for use in stock assessments (Oyafuso et al. 2021). However, field surveys are expensive, time-consuming, and labor-intensive. Additionally, they are often carried out to simultaneously collect information on many species of interest (i.e. multispecies surveys). As a result, developing effective surveys that are cost-efficient and provide the most robust scientific data for use in management can be challenging.
Designing surveys involves making decisions about survey timing, spatial domain, stratification, and sampling effort to maximize the likelihood of precise and unbiased estimates of abundance and age/size composition (Zwolinski et al. 2011). By analyzing environmental variables associated with a species' presence, SDMs generate maps that highlight areas where and when the species is most likely to be found, enabling researchers to more strategically allocate available sampling effort. Zwolinski et al. (2011) demonstrated substantial gains in survey efficiency by using a habitat model for the northern population of Pacific sardine to inform survey sampling locations based on maps of likely spawning and non-spawning adult sardines. Additionally, with multispecies surveys, there are tradeoffs to explore, as it is unlikely that a single sampling design will be optimal for all species. Joint SDMs, multivariate extensions of SDMs that allow the modeling of multiple species distributions simultaneously and take into account both biotic (species interactions) and abiotic factors, can help optimally plan multispecies surveys (Fig. 2; Ovaskainen et al. 2017, Cao et al. 2024). These models were used by scientists at the NOAA Fisheries Alaska Fisheries Science Center (AFSC) to evaluate the performance of alternative stratification designs for the Gulf of Alaska (Oyafuso et al. 2021) and Eastern Bering Sea (EBS) (Vilas et al. 2024) fishery-independent bottom trawl surveys, and a similar framework was used by Zhang et al. (2020) to evaluate survey designs in the north Yellow Sea, China.
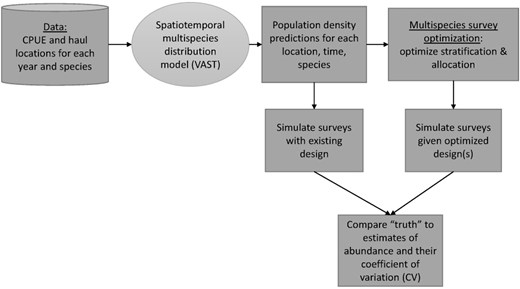
Diagram representing the workflow for how a multispecies spatiotemporal model that predicts the spatially explicit population density of several species simultaneously, can be used to inform survey optimization. The species distribution model (VAST) is represented by the oval. The workflow presented here is based on the simulation design of Oyafuso et al. (2021).
Fisheries stock assessments
Fisheries policies, particularly in the USA (e.g. Magnuson-Stevens Reauthorization Act of 2006, MSRA, 2007) and European Union (Common Fisheries Policy, CFP, 2013), require that catch limits be set for all exploited species. Stock assessments provide the scientific basis for evaluating stock health and setting catch limits, and involve data collection, data processing, and mathematical modeling. SDMs and spatiotemporal models have been increasingly employed to provide data inputs and information to assist with stock assessments, including generating indices of abundance, informing stock structure decisions, and defining stock complexes.
Ideally, indices of abundance and composition are based on well-designed research surveys (i.e. fishery-independent surveys) that monitor changes in fish abundance. However, there are inevitable disruptions or unexpected contingencies (e.g. limited funding, vessel breakdowns, weather, global quarantines) that may cause surveys to diverge from their originally intended sampling design. Additionally, as fish distributions shift due to climate change, historical survey designs may not align with the current stock distribution (O'Leary et al. 2020, Rogers et al. 2024). These issues can lead to spatially and/or temporally unbalanced time series that could result in biased or imprecise abundance estimates (ICES 2020, Bryan and Thorson 2023). To address temporally and spatially unbalanced data, research has particularly emphasized spatiotemporal index of abundance standardization (Fig. 3), which is similar in model structure to SDMs (Thorson et al. 2020b). By sharing information across space and time and accounting for persistent spatial differences (spatial variation) and spatial differences that change over time (spatiotemporal variation), spatiotemporal models can provide better estimates of abundance in areas or years that lack data and correct for unequal sampling intensity (Maunder et al. 2020, Indivero et al. 2023). These methods have also been shown in some cases to result in less retrospective bias and to outperform design-based indices (Cao et al. 2017). Spatiotemporal models can be similarly applied to age and size composition data (O'Leary et al. 2020, Hansell et al. 2022). Spatiotemporal index standardization methods can also be used to integrate data from multiple surveys or gear types, thus expanding the spatial coverage of the data (Perretti and Thorson 2019). This practice has been employed in the USA for Alaska pollock, Pacific cod (Fig. 3), yellowfin sole, and other major fisheries in the Bering Sea, and its use is expanding to the US West and East Coasts.
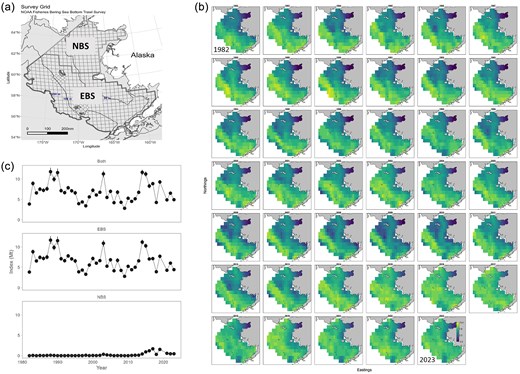
Example of use of a spatiotemporal model (e.g. VAST) for index standardization for Pacific pollock in the Bering Sea. (a) The Bering Sea bottom trawl survey grid, including the EBS standard survey area and the extension in the northern Bering Sea (NBS). (b) Pollock log density maps for the entire Bering Sea region from the VAST model for 1982–2019, 2021–2023. (c). Pollock index values for the standard survey region (EBS), the NBS, and combined based on the VAST application to density-dependent corrected CPUE values from the bottom trawl data. (b) and (c) were obtained from the 2024 EBS Walleye pollock stock assessment report (Ianelli, J., T. Honkalehto, S. Wassermann, A. McCarthy, S. Steinessen, C. McGilliard, and E. Siddon. 2024. Assessment of walleye pollock in the EBS. North Pacific Fishery Management Council, Anchorage, AK).
An important step in most stock assessments is to specify a spatial domain (i.e. the unit stock) for the assessment. This decision is important because it influences what data will be included in the assessment as well as the spatial domain over which the resulting management advice will be relevant. Because SDMs can characterize spatial and temporal changes in occurrence and in numerical density or biomass, as well as size and age structure, they can be useful for identifying a unit stock for assessment purposes (see Lindegren et al. 2022). Alternatively, SDMs are being produced that explicitly represent individual movement, either based on assumed larval drift or estimating adult habitat preferences, which can be used to refine stock structure definitions (SEDAR 2018, Thorson et al. 2021 , Hamer et al. 2023).
Traditionally, management measures and catch limits have been set for most stocks based on single species assessments. However, for many data-limited species and species caught in multispecies fisheries, there is inadequate data or technical support to conduct species-specific assessments or management. A common approach to dealing with these species is to group them into stock complexes with a single catch limit for the complex. Stocks within a complex should exhibit high spatiotemporal overlap and experience similar environmental and fishing pressures. A recent study by Omori and Thorson (2022) recommends that when developing species complexes for management, fine-scale joint SDMs can be used in combination with existing practices for defining complexes, to increase the likelihood of detecting a variety of species relationships and more accurately identify species groupings. Joint SDMs can also be used to detect the impacts of changing fishing practices or environmental conditions at both the individual species and community/complex level (Cao et al. 2024), and predict how the complex may respond to future changes.
Designating EFH
The protection of habitats that are essential to fish species for spawning, breeding, feeding, or growth and maturity, i.e. “essential fish habitats” (EFH; US Public Law 109–479, 1996) is a necessary element of effective ecosystem-based fisheries management. Many exploited species rely on different habitats during different stages of their life cycle (e.g. nursery, feeding, spawning), and specific habitat requirements might be critical for their survival and growth and potential responses to climate change or anthropogenic pressures. Legal mandates exist in many countries that require the identification and protection of biologically or ecologically significant areas for biodiversity and species conservation purposes (USA, US Public Law 109–479, 1996; European Commission, Valavanis 2008). Knowledge of species-habitat associations is a critical element to identifying these essential habitat areas.
SDMs can serve as a foundation to more clearly define EFH at higher spatial and temporal resolutions while identifying key environmental drivers of habitat suitability (Fig. 4). Building life-history specific models may provide additional inference on where species are most at risk, as well as where habitat separation may put species at risk in terms of connectivity and habitat protections (Galaiduk et al. 2017, Kai et al. 2017). For example, if habitat of larval and juvenile stages overlap historically but are further separated as climate change alters connectivity and habitat, there could be population-level effects in the future. Inclusion of auxiliary length and age data into spatiotemporal models can help to understand habitat partitioning and requirements by life stages and help to identify essential nursery, breeding, and feeding habitats (Galaiduk et al. 2017, Kai et al. 2017). In the USA, SDM based EFH designations have been carried out in Alaska for salmons since 2012 (Echave et al. 2012), and groundfishes in 2017 and 2023 (Laman et al. 2018, Pirtle et al. 2023), and in Hawaiʻi for the green jobfish (locally uku), Aprion virescens (Tanaka et al. 2022).
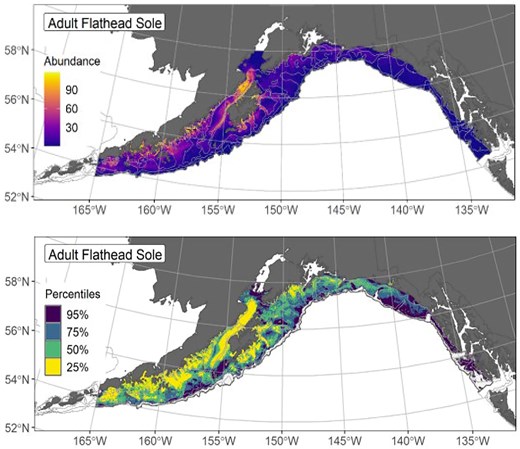
Demonstration of how SDMs can be used to inform EFH designation. Figure modified from Figs. 20 and 22 in Pirtle et al. (2023) (NOAA Tech. Memo. NMFS-AFSC-468). The top panel shows the SDM ensemble-predicted adult flathead sole numerical abundance distribution across the Gulf of Alaska, along with the EFH areas informed by that predicted abundance distribution (lower panel). The EFH is the area containing the top 95% of occupied habitat from an SDM ensemble fitted to flathead sole distribution and abundance in Alaska Fisheries Science Center Gulf of Alaska summer bottom trawl surveys (1993–2019); within the EFH area map are the subareas of the top 25% (EFH hot spots), top 50% (core EFH area), and top 75% (principal EFH area).
Marine spatial planning
With the varied, multiple uses supported by the ocean and coastal habitats, there is concern about environmental impacts and conflicts among users, and ocean resource managers must balance the potentially conflicting objectives of marine resource protection with sustainable use (Maxwell et al. 2015). This has led to the emergence of marine spatial planning (MSP) as an approach to better manage these diverse ocean uses. MSP is defined as “a public process of analyzing and allocating the spatial and temporal distribution of human activities in marine areas to achieve ecological, economic, and social objectives […]” (Ehler and Douvere 2009). The ecological underpinnings of MSP rely on knowledge of the spatial distribution of species, habitats, and ecological communities (Pinsky et al. 2020).
Various types of SDMs have been developed to better understand species distributions and habitat suitability relative to spatial management objectives. SDMs have been used to inform the optimal placement of anthropogenic activities such as offshore energy (e.g. Friedland et al. 2021, 2023, Farmer et al. 2023), aquaculture (e.g. Farmer et al. 2022), and shipping lanes (e.g. Redfern et al. 2013). In these cases, SDMs were constructed to characterize the use by a species or group of species of the area proposed for placement of the anthropogenic activity (Fig. 5). SDMs that go beyond presence/absence (e.g. habitat suitability, predicted density) are most informative in these cases, as they can enable identification of “core” habitat areas that can provide information on a species’ relative dependency on an area and thus provide more detailed understanding of the potential impacts of placing a given activity in an area.
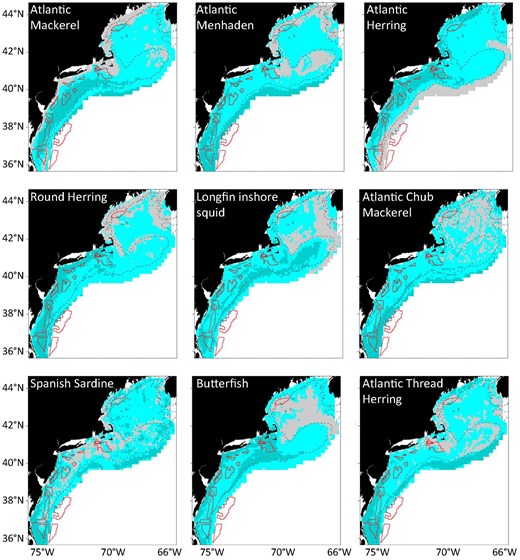
Example of SDMs used to inform offshore wind lease area placement. Each map shows the mean occupancy habitats at the 20% (overall habitat; light blue) and 80% (core habitat; dark blue) quantile thresholds from SDMs across forage species. Gray shows the model extent in the Northeast US shelf and the polygon outlines indicate locations of offshore wind lease areas. Adapted from Friedland et al. (2023), Forage Fish Species Prefer Habitat within Designated Offshore Wind Energy Areas in the US Northeast Shelf Ecosystem, https://doi.org/10.1002/mcf2.10230. Licensed under Creative Commons Attribution 4.0 International License (CC BY 4.0), https://creativecommons.org/licenses/by/4.0/.
The strategic placement and performance of marine protected areas (Nadav et al. 2011, McGowan et al. 2013) and fishery closed areas (Crear et al. 2021) can also similarly be informed by SDMs. SDMs can be built for many species and then aggregated to identify hotspots of biodiversity where placement of an MPA would have the greatest chance of protecting desired species or ecological communities (e.g. Nadav et al. 2011). Additionally, SDMs provide the opportunity to evaluate the performance of existing MPAs and fishery closed areas because they can be specifically designed to integrate data from outside of a protected or fishery closed area with environmental data to project the species distributions inside (where data is often lacking due to restrictions on sampling and fishing) and outside the closed area. Comparing the distribution inside vs. outside the closed areas can help managers evaluate the effectiveness of the closed or protected areas (Crear et al. 2021).
Dynamic ocean management of species and/or fisheries interactions
Static management approaches used to meet MSP objectives, such as seasonal fishery closures and marine protected areas as discussed in the previous section, can result in large areas being closed to human uses and may result in a mismatch with the rate and scale by which marine systems and fishing activities change, leading to decreased effectiveness of management (Pons et al. 2022). Dynamic ocean management is an emerging management framework that uses near-real-time to seasonal (weeks to months) data to guide the spatiotemporal locations of fishing and other commercial (e.g. shipping) and recreational activities to be more aligned with variability in the marine environment, species distributions, and resource use (Maxwell et al. 2015). Such a dynamic approach to spatial management can result in smaller, dynamic boundaries providing greater opportunity to resource users alongside equal protection (Maxwell et al. 2015, Pons et al. 2022), as well as lessen conflict between managers and resource users by reducing the spatiotemporal scope of management (Lewison et al. 2015, Maxwell et al. 2015, Smith et al. 2021b, Pons et al. 2022). There is thus an increasing management need for more real-time, high-resolution, spatial distribution information to reduce risks of interactions with protected species or between target and non-target fisheries species (Tommasi et al. 2021).
Many dynamic ocean tools employ SDMs to estimate the probability of encountering a species of interest in a given area as ocean conditions change. Notable examples of such tools in the USA include TurtleWatch (https://oceanwatch.pifsc.noaa.gov/turtlewatch.html), EcoCast, and Whale Safe (https://whalesafe.com/whale-safe-tool/). TurtleWatch uses loggerhead tag data and fisheries dependent bycatch data to generate daily maps of the preferred temperature range of juvenile loggerheads (65.5–68.5°F) north of Hawaiʻi for use by the fishery (Howell et al. 2008). The EcoCast tool takes multiple covariates and five ecological datasets to create an integrated risk-reward tool that offset target catch with bycatch hotspots to allow dynamic tradeoffs in the California swordfish fishery (Fig. 6; Hazen et al. 2018). Whale Safe uses daily predictions of blue whale habitat suitability and information on vessel and shipping activities to evaluate the spatial and temporal exposure of blue whales to ship strike risk within shipping lanes in the southern California Bight (Hazen et al. 2017, Abrahms et al. 2019). These tools are voluntary, providing information to reduce negative incentives but do not have automated management triggers. The first management mandated dynamic ocean tool was established in Australia, where temporally flexible spatial management informed by habitat suitability maps has been used to prevent unwanted catch of the southern bluefin tuna in the longline fishery (Hobday et al. 2010).
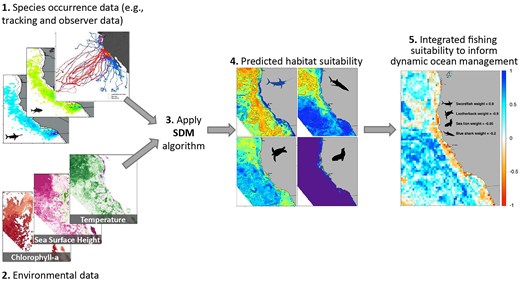
An example of how SDMs can inform dynamic ocean management. SDMs are fit for individual species based on occurrence data and underlying environmental data to generate predicted habitat suitability maps for the target and bycatch species. Then the individual habitat suitability maps are integrated to provide one daily map (far right) based on a management risk weighting for each species. The final output (step 5) shows where low target catch and high bycatch (negative values, poor fishing suitability) occur compared to where high target catch and low bycatch (positive values, good fishing suitability) occur. The figure is based on the analysis conducted in Hazen et al. (2018) and the EcoCast tool.
Understand impacts of climate variability on fish, ecosystems, and fishing communities
Climate variability and change are having discernable impacts on many marine ecosystems and fisheries (Diaz and Rosenberg 2008, Hoegh-Guldberg et al. 2014, FAO 2016, Barange et al. 2018). Managers are interested in understanding and evaluating the potential risks and impacts these changes will have on marine ecosystems and coastal communities both on short (weeks to months) and long (decadal) timeframes (Tommasi et al. 2021).
SDMs provide a framework for developing multiple indicators of historical and future patterns in geographic range, population occupancy, and spatial heterogeneity at the individual species and community level. Metrics of a single species’ distribution, such as the center of gravity (or biomass), location of the leading and trailing edges of the population, and effective area occupied, can be calculated using the spatial predictions from SDMs (Morley et al. 2018, Fredston et al. 2021). With the desire to move toward ecosystem-based fisheries management, there are increasingly more demands for ecosystem and biodiversity indicators. Hui et al. (2023) and Thompson et al. (2023a) show how biodiversity indices (e.g. richness, evenness, diversity) can be modeled directly, or species-specific SDMs can be created for a number of species, and the outputs used to calculate these biodiversity metrics. SDMs are considered a critical tool for exploring contemporary and future regional and global changes in marine biodiversity and the identification of hotspots of biodiversity impacts (Jones and Cheung 2015).
Statistical advances and increased development of downscaled regional ocean models have enhanced the value of SDMs to project the potential future species distributions and the resulting impacts on ecosystems and fisheries. SDMs fit to observed occurrences can be forward projected using regionally downscaled, high-resolution climate projections of important biogeochemical factors (Saba et al. 2016) to predict future patterns and changes in species distributions and biodiversity indicators mentioned above under climate change (McHenry et al. 2019, Fig. 7). They can provide insight into how species distributions might change under different future climate scenarios (e.g. Rooper et al. 2021), and help identify areas where species may be moving out of or into. The outputs from these projections can be used to initially assess the risk and vulnerability of species, habitats, and communities to climate change and inform complex and adaptive conservation and management planning so that managers can strategically and proactively manage dynamic marine ecosystems (Blair et al. 2022, Lezama-Ochoa et al. 2024).
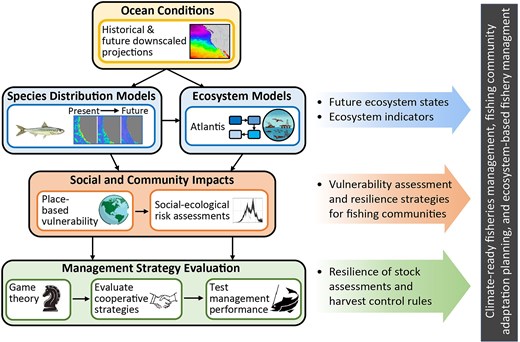
Conceptual workflow of how forward projections of SDMs using regionally downscaled ocean models can be linked with socioecological models to inform decision-makers regarding impacts of climate variability on fishing communities and future ecosystem states. This schematic workflow is based on the analysis conducted as part of the Future Seas Project (e.g. Smith et al. 2023). A similar process is used by the Groundfish, Climate Change, and Communities in the California Ecosystem (GC5; e.g. Liu et al. 2023, 2025) project as well.
Forward projections of SDMs can also be linked with ecosystem models and bioeconomic models, to evaluate potential effects of such distribution shifts on ecosystems, fisheries, and fishing communities and help support climate-ready fisheries management, fishing community adaptation planning, and MSP (e.g. Marshall et al. 2017, Smith et al. 2021a, 2023, Liu et al. 2023, Fig. 7). Such an approach is currently being undertaken by multiple projects, including the Groundfish, Climate Change, and Communities in the California Current (GC5; Liu et al. 2023, 2025), Future Seas (Smith et al. 2023), and the Alaska Climate Project (ACLIM, Goodman et al. 2024), to understand the impacts of climate change on US west coast and Alaska fisheries. SDMs for groundfish and pelagic species are used to project port-level resource availability and to drive species shifts in an Atlantis end-to-end ecosystem model.
Skillful seasonal forecasts (1–12 months) are also now becoming available thanks to new oceanographic products, such as those produced by J-SCOPE (JISAO’s Seasonal Coastal Ocean Prediction of the Ecosystem). These seasonal ocean forecasts can facilitate forecasts of species distribution on these shorter timescales relevant to more tactical management decisions (Saha et al. 2006, Haidvogel et al. 2008), such as annual survey planning and spatial allocations, as well as provide indicators of impending ecosystem change (Hobday et al. 2016, Moustahfid et al. 2021, Brodie et al. 2023). Seasonal forecasts of species distributions have been developed from the J-SCOPE ocean forecasts for Pacific Hake Merluccius productus (Malick et al. 2020), Pacific sardine Sardinops sagax (Kaplan et al. 2016), and Dungeness crab Metacarcinus magister (Norton et al. 2023). These examples and their management context are summarized in Siedlecki et al. (2023). Additional seasonal ocean forecasts at new spatial scales should be available for inclusion and testing in new SDMs, under the umbrella of the NOAA Climate and Ecosystem Fisheries Initiative (CEFI, https://www.fisheries.noaa.gov/topic/climate-change/climate,-ecosystems,-and-fisheries). We expect these to include seasonal forecasts from the Modular Ocean Model 6 (see Ross et al. 2023, 2024) and local efforts such as the West Coast Ocean Forecast System (WCOFS, Kurapov et al. 2017).
Moving forward: a next generation species distribution modeling system
The discussion of SDM applications in the previous section demonstrates how SDMs have been, or could be used to answer many types of management or conservation questions. Here we provide our perspective on what is needed to further advance the applications of SDMs for living marine resource management. The following sections are organized around four key components that are essential for increasing the transition of SDMs from research into operations. These four components are (1) diverse data streams and advanced analytical approaches, (2) operational computing resources, (3) organizational structure and community of practice, and (4) engagement, communication, and outreach to management. We focus here on operational use of SDMs based on experiences within the US fisheries context. However, our recommendations could be applicable to other fisheries management entities.
Data streams and analytical approaches
Integrate across more diverse sources of biological data
Being able to model and understand species distribution and abundance is predicated on the ability to observe or collect information on its occurrence in space and time. Fisheries-independent data, particularly from extractive sampling methods (e.g. bottom trawl, longline gear), are often considered the “gold standard” data for an SDM. However, as previously mentioned, the time- and resource-intensive nature of these surveys and their consequently high operational costs have led to shrinking spatial and/or temporal footprints and/or diminishing sampling intensity and overall reductions in the availability of data (ICES 2020). Additionally, there are many species that are not adequately sampled, or not covered at all, by these extractive fishery-independent surveys. As such, developers of SDMs should increasingly consider additional sources of animal spatial data.
Additional sources of animal spatial data that are currently being underutilized include fishery-dependent observations, gut content information, acoustic and optical survey data, telemetry data, and environmental DNA (eDNA). Fisheries-dependent data, i.e. data from scientific observers on commercial fishing vessels, industry-reported logbooks, vessel tracks, or study fleets can provide a large number of observations at more resolved temporal scales (e.g. daily, seasonal) compared with fishery-independent data. However, potential biases due to the non-random nature of the sampling need to be carefully considered (Conn et al. 2017, Pennino et al. 2019, Braun et al. 2023, Karp et al. 2023). Gut content information from species caught in fishery-independent or -dependent surveys can provide an “indirect” index of occurrence or relative abundance (Moustahfid et al. 2009a, 2009b) to inform SDMs for taxa whose “direct” representation in survey samples may be limited (Link 2004). Unifying analyses of gut contents with species distributions also allows estimation of the “trophoscape” of predators, i.e. spatiotemporal variation in predator diet and predation mortality on prey, as well as resulting impacts on predator availability to monitoring surveys (Gruss et al. 2020, Gaichas et al. 2024, Wells et al. 2024).
Non-extractive methods can also provide useful occurrence data to inform SDMs. Acoustic and optical surveys can provide abundance information to inform SDMs for species not well sampled by traditional extractive gears (e.g. krill and semi-pelagic fish; Kotwicki et al. 2018, Moustahfid et al. 2020, Phillips et al. 2022), or for surveying areas where complex physical structure and/or sensitive habitat types preclude traditional extractive sampling (Jones et al. 2021). Optical or video-based trawl surveys may also enhance the monitoring of smaller taxa that would otherwise pass through towed nets while providing additional insights on animal behavior (Silva et al. 2023). Animal telemetry data provide a rich source of information on individual-level movements, which can be incredibly valuable for rare species (Block et al. 2011, Lowerre-Barbieri et al. 2019, Moustahfid et al. 2020). Recent research confirms that SDMs can be fitted both to point-count (e.g. surveys) and movement tracks (archival or pop-up GPS tags) and that these data are complementary (Thorson et al. 2021). Environmental DNA (eDNA) presents a relatively low-cost, non-invasive method for monitoring animal communities, and its collection and analysis have proliferated rapidly in recent decades (Fediavejaite et al. 2021). Guisan et al. (2017) highlight eDNA as a promising new data type for the future of habitat suitability modeling, and a growing body of work indicates that eDNA-based analyses typically match or exceed the performance of traditional survey-based methods as a tool for detecting the presence of species, particularly in the case of rare taxa (Thomsen et al. 2016, Afzali et al. 2021, Jeunen et al. 2024). However, the less direct and less quantitative nature of eDNA-based observations opens the door to several sources of error and uncertainty that can complicate interpretation and analysis (reviewed in Barnes and Turner 2016, Hansen et al. 2018). Confronting these challenges in the processing and modeling of eDNA is an area of active and growing inquiry, including for application to commercial fisheries management and stock assessment (Shelton et al. 2022).
Integrated SDMs, which combine data of different types and quality from multiple sources, are becoming an increasingly useful tool to take advantage of the range of information available on where species occur. By exploiting the complementary information provided by divergent data streams, “integrated SDMs” may provide a more complete depiction of a species’ niche (Chevalier et al. 2021, Paradinas et al. 2023), and consequently improved model performance (Pacifici et al. 2017, Gruss et al. 2019, Strebel et al. 2022, Gruss et al. 2023a). Doing so must be approached carefully, however, as data streams can vary in their reliability, spatiotemporal grain, and other inherent sources of bias (Miller et al. 2019, Isaac et al. 2020, Zipkin et al. 2021). To date, a range of modeling techniques have been employed to implement integrated models, from relatively simple data-pooling methods (Thompson et al. 2023b) to ensemble-based approaches (Braun et al. 2023) and more complex hierarchical models in which a common underlying latent field is sampled via multiple, distinct observation processes (Guisan et al. 2017, Rufener et al. 2021, Alglave et al. 2022, Gruss et al. 2023a). Basic data-weighting schemes permit the assimilation of information across sources while limiting the influence of lower-quality observations (Fletcher et al. 2019, Paradinas et al. 2023); more objective weightings may be obtained via the estimation of spatially varying (source-specific) catchability/detectability effects that act to down-weight less reliable sources relative to a “gold-standard” or “reference” dataset (Gruss et al. 2023b). Additionally, several “change of support” techniques have been proposed to accommodate spatiotemporal mismatch within integrated SDMs, including the use of Poisson point processes that lend themselves to both point-based and areal interpretation (Hefley et al. 2017, Pacifici et al. 2017, 2019) and hierarchical downscaling procedures (Chevalier et al. 2021, 2022).
Use more salient environmental predictors
A challenge for SDMs is selecting data sets most likely to explain environmental variation in the response. Under accelerating environmental change using static and/or indirectly related “proxy” variables can be particularly problematic, as they can become decoupled from the often unmeasured but more proximally acting environmental correlates that give rise to their explanatory value, as evidenced by recent temperature-driven shifts in depth-related habitat use (Dulvy et al. 2008, Nye et al. 2009). Additionally, though SDMs are generally fit in two-dimensional space, many species in the marine environment, particularly pelagic species, live in three-dimensional space. It is becoming increasingly clear that incorporating a broader set of environmental variables in three-dimensional space improves SDM explanatory power and performance (Brodie et al. 2018, McHenry et al. 2019). Moving into the future, SDMs can be improved by including more proximal drivers of habitat selection and utilization throughout the water column that taxa of interest are capable of directly sensing and responding to (e.g. the optical or hydrodynamic environment in addition to temperature or benthic habitat parameters) and which have clear consequences for animal function or fitness via basic physiological, biological, or ecological mechanisms (Horodysky et al. 2015). The use of tools such as ordination can aid in thoughtful covariate selection (Karnauskas et al. 2015). Moreover, when possible and/or appropriate, SDMs should consider time-varying predictors that capture the dynamic nature of the physical forcing that marine animals experience (Manderson 2016) and should be regularly validated and refit with new data as species-environment relationships enter non-analog futures.
Advances in the collection and analysis of environmental data from earth-observing systems, including satellite platforms (i.e. remote sensing) and in situ observations, have led to rapid growth in its overall breadth/coverage, fidelity, and spatiotemporal resolution. While direct measurements from satellite platforms are generally limited to sea surface temperature, ocean color, and sea surface height for the uppermost portions of the water column, remotely sensed data are increasingly used to infer subsurface conditions (reviewed in Klemas and Yan 2014), and can be processed or analyzed to estimate water column optical properties, primary productivity, salinity, marine wind fields/wave states, subsurface geostrophic currents, as well as to identify oceanographic features such as fronts (reviewed in Belkin 2021), and more recently, phytoplankton size composition (Gorman et al. 2019, Turner et al. 2021). Many satellite-derived products are updated in near-real time, enabling their use in operationalized dynamic models (Scales et al. 2017, Hazen et al. 2018, Welch et al. 2023). In situ observations from onboard fishery-independent surveys, fixed or free drifting ocean-observing arrays and/or autonomous vehicles (Gawarkiewicz and Plueddeman 2020, Wong et al. 2020), commercial fishing gear-mounted sensors (e.g. NOAA’s eMOLT program, Manning and Pelletier 2009, and Fishing Vessel based Observing Network (FVON), Van Vranken et al. 2023), or animal borne sensors (Moustahfid et al. 2020) typically take the form of vertical temperature and salinity profiles obtained using conductivity-temperature-depth sensors, but can also include measurements of additional variables such as dissolved oxygen, pH, nutrient and chlorophyll concentrations, optical parameters (i.e. irradiance and backscattering), as well as current velocities.
Hindcasts produced by numerical ocean circulation models and data assimilative reanalyses (which integrate oceanographic observations to constrain predictions and improve model skill) are becoming increasingly available at global (Chamberlain et al. 2021, Lellouche et al. 2021), regional (Moore et al. 2011, Wilkin et al. 2022), and embayment (Bever et al. 2021) scales. As computing power and the quality of forcing data have grown, so have the resolution, complexity, and accuracy of these products (Storto et al. 2019). While satellite-derived products are typically limited to temporal snapshots of surface-related variables (although see discussion above) and can be obscured by cloud cover, three-dimensional oceanographic models and reanalyses provide spatially and temporally continuous estimates of surface and subsurface conditions, often with a resolution and degree of fidelity sufficient to inform SDMs (Amaya et al. 2023, Castillo-Trujillo 2023 et al. 2023). As such, model hindcasts or reanalyses are increasingly being used to obtain estimates of basic physical predictors, including temperature, salinity, sea surface height, metrics of water column structure or stratification, current velocities, and eddy kinetic energy (Scales et al. 2017, Brodie et al. 2018, Abrahms et al. 2019), as well as more complex hydrodynamic features that are not straightforwardly observable from in situ data for use in SDMs (e.g. submesoscale fronts: Scales et al. 2018). Physical models can also be coupled with biogeochemical or nutrient-phytoplankton-zooplankton models (Zhang et al. 2019, Hauri et al. 2020, Bever et al. 2021) that consider nutrient availability, primary productivity, and carbon cycling to generate predictions of biologically important physicochemical variables such as dissolved oxygen, pH, as well as lower-trophic level (i.e. zooplankton) productivity (Howard et al. 2020, Crear et al. 2020a, 2020b, Bandara et al. 2024).
It is worth noting that spatial resolution/misalignment error is not limited to the case of integrated response data but can also arise when the spatial grain of environmental predictor data differs substantially from that of the response (Nunez-Riboni et al. 2021, Mourguiart et al. 2024). Likewise, while it has received less attention, the temporal scale/resolution at which predictor variables are assessed can also have an effect on the inferences drawn from SDMs and requires careful consideration from both an ecological and statistical perspective (Manocci et al. 2017, Fernandez et al. 2017, Scales et al. 2017, Nunez-Riboni et al. 2021, Lindmark et al. 2025). Nunez-Riboni et al. (2021) found that for studies looking at the influence of climate change on distribution shifts, in situ and high-resolution data resulted in decreased model performance as compared to using more coarse data. The development of more systematic approaches and/or guidelines for determining the appropriate spatial and temporal resolution for predictors to match with species data, such as done by Nunez-Riboni et al. (2021), is a worthwhile area for research. Similarly, response data can be discretized at different spatial and seasonal scales, and this can be important. For example, sub-seasonal resolution was important for copepod species distribution modeling, as well as for SDMs used for apportionment of transboundary stocks using national surveys that occur within different seasons (Thorson et al. 2020a).
Use advanced analytical approaches to add physiological processes and species interactions into models
One frequent concern with SDMs is that they assume “stationarity,” i.e. that historical correlations between environmental conditions and species occurrence and/or biomass will stay the same in the future, and that species populations are always in equilibrium with their environment (Dormann 2007, Pagel and Schurr 2012, Urban et al. 2016). Under accelerating environmental change, species-environment relationships inferred from historical distributions may serve less reliably as predictors of future habitat use (Dormann 2007, Muhling et al. 2020), presenting a challenge for correlative SDMs. Modeling approaches that capture fundamental biological processes like demography, dispersal, physiology, behavior, and species interactions—rather than simple statistical correlations—may be more robust for prediction and forecasting into the future and seek to address some of the limitations of correlative SDMs as described in Dormann (2007). However, the more complex models become, the more uncertainty they need to incorporate, and the more laboratory and field data they may need for proper parameterization (Horodysky et al. 2015). Thus, operational SDMs require ongoing validation with new data as we enter novel environmental conditions where stationarity may degrade.
Several recent studies have attempted to incorporate or consider independent physiological data into distribution models. The simplest approach is to compare consistency between SDM-derived temperature response curves and laboratory-collected metabolic parameters (Kearney et al. 2010, Nazzaro et al. 2021). Physiological data have also been used to supplement relationships in SDMs in which observed data of more extreme conditions are lacking (Crear et al. 2020b). Physiological data can also be incorporated into SDMs via model priors (Gamliel et al. 2020). Metabolic data have also been used to build separate mechanistic distribution models, which assume that conditions supporting adequate metabolic scope (determined from temperature and oxygen concentrations) are synonymous with suitable species habitat (Deutsch et al. 2015, Muhling et al. 2017, Harishchandra et al. 2022). In instances where the above assumption breaks down (Clark et al. 2013) and suitable habitat cannot be inferred, spatial limits can still be projected from physiological thresholds derived from lab experiments (Slesinger et al. 2024). However, while incorporating physiological measurements into SDMs can be informative, extrapolating laboratory conditions (where food is often not limiting, and experiments may be too short to meaningfully measure acclimation) into the marine environment can introduce substantial uncertainty, and physical habitat constraints such as substrate type cannot be ignored. In addition, laboratory measurements are not available for many species, particularly those that are larger, or difficult to keep in laboratory conditions, such that phylogenetic trait imputation might be necessary for many species (Thorson 2024; Essington et al. In review).
Dynamic range models are an example of a more complex approach to incorporating physiological processes, and they are built as a spatial population dynamic model with environmentally dependent demographic rates (Pagel and Schurr 2012, Zurell et al. 2016). These models can include diffusion, taxis, or a combination of the two to account for organismal movement patterns. These mechanistic movement models can calculate population-level movement rates (e.g. for use in spatially stratified stock assessment models) from individual movement processes, i.e. can bridge from the individual step-selection function to the population utilization distribution (Thorson et al. 2021, McClintock et al. 2022). With explicit population dynamics, these models also provide a more natural platform for investigating the interactions between fishing and climate or for performing management strategy evaluations. Given the computational burden of more complex models, hybrid approaches that merge dynamic range models and traditional statistical associations may also be promising, particularly for downscaling to fine spatial resolutions.
Species distributions are also shaped by biological interactions, such as competition, predation, and prey densities, and therefore it is important to consider how both abiotic and biotic factors mold species distributions. For example, marine mammal species are recovering in many oceans, and their predatory impact on prey fishes is important for understanding fish range shifts (Thorson et al. 2017). In some cases, these interactions can be better understood by jointly modeling species traits and phylogenetic relationships (Ovaskainen et al. 2017, Schliep et al. 2018). In other cases, modeling densities separately for different sizes and ages allows estimates of how distribution might change as a strong cohort ages through the population (Thorson et al. 2023).
Operational computing resources
Developing the next generation of SDMs that seek to include more mechanistic relationships, more species and environmental predictors, integrate across three dimensions in space (i.e. vertically resolved), and provide multiple simulations and models to understand uncertainty around different future scenarios will require an open, robust, community-scale cyberinfrastructure to support the accessibility and scalability of SDM approaches. Cyberinfrastructure includes all aspects of the data life cycle, from acquisition, to storage, integration, analysis, and visualization, as well as both software and hardware elements (Wegrzyn et al. 2020). This includes ensuring that individuals have access to personal machines with sufficient memory and processing power to work with large multidimensional datasets, that there is reliable and efficient access to high-performance computing (HPC) resources for model runs, and that code and data are accessible by both collaborators internal and external to a particular science or management agency. In short, we need to implement what has successfully been done for the state-of-the-art weather and climate modeling experience. There will be increasing demands for server space for data storage and HPC resources if such models are to be successfully run in a timely and operational fashion. Using traditional single-processor systems, these models can take days to weeks to run; however, when run using HPC or cloud resources, parallelization, and GPU processors, they can be run on the order of hours or less (Bryan 2013). Several layers of support are needed to move toward fully operationalizing SDM work with HPC resources, spanning from institutional (Pahlka 2023) through administrative (e.g. Hinkley 2022) to the collaboration level (Lowndes et al. 2024).
Increased ability to take advantage of HPC or cloud resources would improve the operational development and use of SDMs in several ways. Developing SDMs using HPC would lead to better feedback and response times and the ability for modelers to be adaptive in the way they build the model. Additionally, with HPC resources, it could be possible to run larger SDM ensemble models that explore a broader range of model algorithms and parameterizations, and future climate scenarios, as well as conduct multiple simulations for improved statistical power (e.g. Harris et al. 2024). This is similar to today’s ensemble approach to weather forecasting, which is enabled by HPC resources. In order to assess the efficacy of models under changing conditions, these models need to be validated as new biological data is collected and species begin to interact with new environments. Conducting such validation at operational time scales requires robust and accessible cyberinfrastructure. In addition, uncertainty in forecasts, ideally spatially explicit uncertainty surfaces, are important to include if possible so end users understand where confidence levels are greatest. The long-term goal of biologically assimilative models would be to allow operational dynamic refitting whenever new data are available. Additional advantages of using HPC include improved mechanistic models and resolution of movement models. Additionally, while existing machine learning approaches such as random forests and boosted regression trees automatically learn based on the data and model fits, increased processing capabilities and data availability may enable the field of species distribution modeling to explore the use of artificial intelligence similar to fisheries tracking approaches (Welch et al. 2024).
Lastly, it is not just a matter of simply increasing the access to these HPC, cloud, and other resources for computationally intensive work, but also ensuring that scientists have the necessary knowledge of the computer architecture and the expertise to design and run complex models on that architecture (e.g. Lowndes et al. 2024). This expertise is generally lacking among fisheries scientists, but efforts to address this capacity gap can be made through a combination of (1) working with universities to include more mathematics, statistics, and computer programming in biology and ecology curricula, (2) making ecology and SDMs more attractive to physics, computer engineering, and mathematics students, so that they may decide on a career in ecology and fishery science, and (3) increased training and support for current fishery scientist staff to learn how to access and use computing resources more effectively.
Organizational structure and community of practice
The development of a community of practice around species distribution modeling can improve sharing of ideas and development of best practices for operationalizing models, much as has been done for the climate modeling community and others (e.g. CMIP6, Eyring et al. 2016 and FishMIP, Tittensor et al. 2018, and Blanchard et al. 2024). Currently, different practitioners often take different approaches with respect to integrating multiple data sets (e.g. from fisheries, surveys, physiological experiments, and stomach contents), deciding on model parameterizations, and providing appropriate diagnostics. As species distributions often span multiple jurisdictions and are increasingly moving across national and international boundaries due to climate change, it is crucial that data, methods, and understanding of distributions are shared.
Working groups that include representatives from multiple regions and/or countries that can provide advice to SDM developers regarding best practices would be quite helpful to facilitate the development of a community of practice. In the USA, the Distribution Mapping and Analysis Working Group (DisMAWG), which oversees the development of the Distribution Mapping and Analysis Portal (DisMAP: https://apps-st.fisheries.noaa.gov/dismap/DisMAP.html) and who are the authors of this paper, serve in this role. This working group could be adapted to work more purposefully on a wider range of issues with respect to operationalizing SDMs across regions and to work with other national or international working groups. For example, similar working groups have also been established at the international level, such as the ICES Working Group on Fish Distribution Shift, which held two workshops to (1) understand fish distribution shifts within ICES management areas (ICES 2017) and (2) review models and develop best practice guidance in deriving distribution maps (ICES 2023).
SDMs require a broad array of data and expertise to develop, and therefore efficient and reproducible SDM workflows are also essential for ensuring effective collaboration and addressing the need for scalable prediction of species distribution. Tools such as GitHub can be an effective way to collaboratively share code for developing SDMs. Metadata collection and summaries are essential for documenting and keeping track of data sources and caveats, and websites can be useful for sharing information (e.g. Northeast Regional Habitat Assessment or the AFSC EFH repo). Public-facing web tools can be useful for visualizing and displaying results and iteratively improving summaries so they are most useful for management and other applications (e.g. DisMAP, Northeast Regional Habitat Assessment Data Explorer or Alaska EFH mapper).
An operational SDM system also requires a structure for routine SDM prioritization, development, updates, and review. This structure facilitates integration into operational advice, whether stock assessments, spatial management, ecosystem status reports, climate vulnerability analyses, or EFH updates. Such a system could draw inspiration from the stock-assessment community, where teams typically have a routine process to plan future benchmarks and update assessments, identify responsibility for developing and reviewing models, and establish systems for reporting results to review bodies, managers, and the public. It could also draw from the weather forecasting community, where forecasts are “verified” by comparison to actual weather conditions in order to improve forecast methods and models.
One example might involve establishing “benchmark SDM methods” (which undergo review every 5 years) combined with annual “update reviews” that are streamlined to ensure that products meet a pre-established threshold (e.g. based on model diagnostics). Such a process could be formalized by developing an annual SDM Terms of Reference (TOR), which would outline which SDMs are planned for that year and which staff or partners are responsible for development and review by what time. A precursor is currently underway at the NOAA Fisheries AFSC, where annual TOR for SDMs for use in stock assessment are developed. Even there, however, there is no formal process to coordinate SDM methods and development among index standardization, EFH, and climate forecasting teams, or for “benchmark” reviews of SDM methods across multiple teams. Therefore, while the various applications of SDMs may be different in terms of structure, criteria for skill testing, required resolution, etc., adopting some broad principles (e.g. testing model skill on withheld observations, ensuring predictions are appropriately matched with the spatial scale of observations, use of ensembles for SDM forecasts or projections, open sharing of model-building code) and developing more general TOR could aid in the planning, development, and coordination across SDM applications.
Communication, outreach, and engagement with management
For SDMs to be integrated into decision-making frameworks, they should provide predictions or outputs that are fit for user requirements (Gros et al. 2022, Braun et al. 2023). The initial ecological objectives of distribution modeling studies may not match the priorities or capabilities of natural resource managers. As a result, if managers and stakeholders are not included in project discussions until after models are already finalized, scientists can end up with products that may not effectively address management needs and have poor uptake in decision-making. To avoid these situations, end users of SDM outputs should be identified and engaged early on, and products should be adapted to meet user needs (Roux et al. 2006, Tommasi et al. 2021). Regular and ongoing communication and collaboration among modelers, resource users, and managers to tailor models and ensure they address management requirements is critical for success (Cvitanovic et al. 2015, Townsend et al. 2019). Ideally, scientists also need to be familiar with the pathways through which ecosystem information, including SDM outputs, can be incorporated into decision-making frameworks (Marshall et al. 2018).
If an SDM is to be used for tactical management applications, predictive performance needs to be adequate, and model uncertainty should be clearly described and quantified (Skern-Mauritzen et al. 2018). It is also important to move forward in providing management advice in the face of uncertainty and the lack of ideal data because often the information available is an improvement over the existing basis for management decisions. Spatial and temporal prediction scales, as well as output formats, should match user requirements. For example, although nowcasts can be generated from some SDMs, regulatory changes generally operate on a much slower timeline. If SDMs are designed to regularly inform management decisions (such as in Dynamic Ocean Management), model skill should be regularly re-evaluated to ensure that data gaps, changes in target species populations, or shifts in ocean conditions do not unacceptably degrade prediction skill (Welch et al. 2019, Muhling et al. 2020).
Even if resource users and managers are consulted early in the model development process, management needs can change after initial tools are built. This is particularly the case as ecosystems change more rapidly than ever, resulting in novel conditions (e.g. Smith et al. 2022), and new management needs are likely to arise. Scientists should be prepared to modify existing tools where required and maintain their relevance to emerging management issues. Continuous dialog and collaboration between scientists and managers is integral to creating useful scientific products.
Conclusions
How species are distributed in space and time is a central question in ecology and of utmost importance for the successful management and conservation of living marine resources. SDMs can be useful for a broad range of management decisions, from designing surveys, to stock assessment, MSP, and understanding the impacts of short- and longer-term climate variability and change. The example applications presented here illustrate the significant amount of SDM work and uses already in existence; however, at the same time, the experiences working with SDMs to date also highlight areas for improvement. We present our collective perspective on what an operational SDM system would entail. We encourage SDM practitioners to utilize analytical approaches that enable integration across more diverse data streams and to use more salient predictors of a species distribution. We highlight the need for operational computing resources that have the processing power to work with large multidimensional datasets and the organizational structure for SDM prioritization and development to ensure that SDMs are reliably updated or to allow review and comparison among alternative SDM methods and products. Lastly, we emphasize the importance of regular and ongoing engagement and communication with resource users and managers throughout the SDM process. It is our hope that the recommendations presented here spark the needed conversations to work toward increasing uptake of SDMs to address the wealth of management questions that hinge on an understanding of species spatial distributions.
Acknowledgments
We would like to thank Wendy Morrison, Scott Large, Roger Griffis, Owen Liu, and Matt Damiano, and two anonymous reviewers for their constructive comments on earlier versions of the manuscript, and Avi Litwack for help designing Fig. 1. The conclusions, as well as any views or opinions expressed herein, are those of the authors and do not necessarily reflect those of NOAA or the U.S. Department of Commerce.
Author contributions
All authors were involved in the conceptualization of this manuscript. M.A.K. led the writing of the manuscript, and all authors were involved in writing - orginal draft and writing - review & editing, and approved the final draft.
Conflict of interest
None declared.
Data availability
No new data were generated or analyzed in support of this research.
