


Abstract
Elasmobranchs are highly diverse in movement, sensory capacity, and behavioural responses to the environment, leading to differences in the function and nature of associations and interactions between individuals, populations, and species. The term “aggregation” has been widely and variably used to describe co-occurrence across elasmobranch species, but its defining criteria remain vague and indeterminate. The lack of standardized terminology hinders comparisons across studies, species, and systems. It can cause misinterpretation about the drivers of aggregation formation or grouping behaviour and limits the impact of elasmobranch behavioural research. Here, we propose generalizable definitions of aggregation and supporting terms, adapted from more mature socioecological theory in other systems, which can be applied across elasmobranchs. We discuss the drivers and types of elasmobranch aggregations, detail the criteria required to identify an aggregation based on our definition, and offer direction on future methods and reporting to advance the field. These proposed definitions and reporting protocols standardize the study of elasmobranch socioecology, will generate greater understanding of the mechanisms underlying behaviour and distribution across species, and support more cross-system comparisons. Finally, this information can offer greater predictive power into when and how aggregations may form, leading to more proactive management strategies to mitigate anthropogenic threats.
Introduction
The patterns and drivers of animal aggregations are well-studied in a broad array of species (Krause and Ruxton, 2002; Ward and Webster, 2016). Most are terrestrial, including invertebrates (e.g. Klok and Chown, 2002; Hammons et al., 2009), birds (e.g. Lack, 1968; Ward and Zahavi, 1973), reptiles (e.g. Skinner and Miller, 2020), and mammals (e.g. Scott, 1988; Treves et al., 2001). Comparatively, fewer studies exist in more dynamic marine environments. This largely stems from logistical, technological, and/or financial constraints in such systems, which limit our ability to directly observe individual animals over time and across three-dimensional spatial scales. Most of the effort to describe aggregations and group-living in marine environments are focused on mobile species occupying surface waters (i.e. cetaceans; Mann et al., 2000) and sessile benthic organisms. Literature on other taxa, such as elasmobranchs, remains comparatively sparse.
Yet recent advances in technology over the last decade have led to increasing descriptions of aggregations in a variety of elasmobranch species; from planktivorous Basking sharks (Cetorhinus maximus; Lieber et al., 2020; Sims et al., 2022), Whale sharks (Rhincodon typus; Meekan et al., 2006), and Manta rays (Mobula spp., Armstrong et al., 2016; Perryman et al., 2022; Palacios et al., 2023) to predatory White sharks (Carcharodon carcharias; Jorgensen et al., 2010; Findlay et al., 2016). Aggregations have been documented in pelagic, coastal, and reef species (McKibben and Nelson, 1986; Economakis and Lobel, 1998; Speed et al., 2011; Papastamatiou et al., 2020), and across a broad array of orders including Hexanchiformes (Ebert, 1991), Carcharhiniformes (Klimley and Nelson, 1981; McKibben and Nelson, 1986), Heterodontiformes (Powter and Gladstone, 2009), Squatiniformes (Standora and Nelson, 1977), Myliobatiformes (Rohner et al., 2013; Armstrong et al., 2016), and others (Jacoby et al., 2012; Papastamatiou et al., 2022a; Palacios et al., 2023). However, there remain large gaps in our understanding of aggregation occurrence, drivers, and function, likely because of numerous obstacles to documenting elasmobranch behaviours in situ.
Some key challenges to studying elasmobranch aggregations emerge due to the biology and ecology of the animals themselves. Elasmobranchs largely occupy habitats currently unsuitable for long-term observation. They do not surface to breathe, and often travel across wide depth and geographical ranges. Their diversity further complicates study. For instance, some species have adult home ranges as small as 1000 m2 (Strong, 1989), while others move across entire ocean basins (Johnston et al., 2019). Additionally, their aggregations can be dynamic with the underlying drivers difficult to classify, changing across species, ontogeny, and spatiotemporal scales.
Furthermore, unlike in the terrestrial or avian literature, the criteria used to define an aggregation in elasmobranchs remain vague and indeterminate. Many observations fail to provide crucial data that would otherwise help explain the nature of the aggregation in question (i.e. number of individuals sighted, scale of their distribution, their behaviour, etc.). While some studies describe the occurrence of aggregations, research often relies solely on disjointed observations rather than structured hypothesis testing for determining the purpose of aggregation formation (Findlay et al., 2016), and their level of detail is inconsistent. For instance, some observations may describe the number and spatial distribution of individuals (e.g. Powter and Gladstone, 2009), whereas others note behaviours and body orientation (e.g. McKibben and Nelson, 1986). Consequently, not only do the scale and frequency of aggregations across species vary widely, but so does the frequency of observation and reporting. This may be why the term “aggregation” is most widely referenced in elasmobranch observations, encompassing both social groups and aggregations that form due to abiotic factors. For example, an elasmobranch “aggregation” might be used to describe both a population feeding in a common ephemeral prey patch, and a stable group, which occupies that same habitat year-round. In contrast, for systems where drivers of organism behaviour can more easily be identified (e.g. terrestrial, avian), “aggregation” refers to co-occurrence primarily driven by abiotic factors, completely distinct from social groups (e.g. Whitehead, 2008; Ward and Webster, 2016; Syme et al., 2022).
The lack of standardized terminology in this field is a barrier to future research and has the potential to cause misinterpretation of aggregation formation or grouping behaviour. For instance, subjective interpretations of co-occurring elasmobranchs may reflect methodological differences across studies, rather than species-specific characteristics or behaviours. To this end, there have been recent efforts to overcome parallel issues in marine organisms (e.g. delphinids: Syme et al., 2022; Tavares et al., 2022; mobulids: Palacios et al., 2023). However, general gaps in information, combined with limitations in data collection and lack of standardized methodology, typically prevent the application of exact definitions from literature in other taxa to elasmobranch aggregations. Therefore, it is necessary to develop more deliberate and robust terminology, analogous to those used in socioecology broadly (e.g. Krause and Ruxton, 2002; Ward and Webster, 2016), but also aligning with current understanding of and published literature on elasmobranch behaviour.
While contributing to the clarity of theoretical work, the development of a tailored definition for elasmobranchs would also have useful applications for management and conservation efforts. Aggregations of threatened species in “hotspots” (Myers et al., 2000; Roberts et al., 2002; Hazen et al., 2013; Erisman et al., 2015) are often used as justification for targeted, spatially explicit management strategies. This may be particularly valuable for elasmobranchs (Hyde et al., 2022), which are vulnerable to overfishing and anthropogenic disturbances because of their slow growth, late maturity, and low fecundity. In some cases, aggregation behaviour is thought to have contributed to population declines, as it renders those populations more vulnerable to overexploitation (Mucientes et al., 2009; Jacoby et al., 2012; Palacios et al., 2023). Because elasmobranchs play critical roles in ecosystems around the world, their declines can result in trophic cascades, fishery collapses, and loss of ecosystem services (Dill et al., 2003; Scheffer et al., 2005; Myers et al., 2007). Yet spatial planning tools often still fail to adequately consider the habitat needs of elasmobranchs and thus provide insufficient protection (Hyde et al., 2022). The effectiveness of spatial protection (i.e. protected areas) would be improved by encompassing areas where single- or multi-species aggregations occur for vital functions (e.g. reproduction, feeding, resting; Hyde et al., 2022). However, there remains no formal definition for these phenomena. As it stands, vague descriptions of aggregation behaviour could cause broad misconceptions about the population dynamics and distribution of the species of interest, which could in turn reduce the effectiveness of management actions (e.g. Dobson and Poole, 1998; Erisman et al., 2015). For example, parallel issues with defining shark nursery habitat historically led to the classification of vast coastal areas as nurseries, rendering conservation efforts too expansive, costly, and complicated to be feasible (Heupel et al., 2007; Kinney and Simpfendorfer, 2009).
Here, we build on previous literature reviews on elasmobranch aggregations (Jacoby et al., 2012; Mourier et al., 2018; Papastamatiou et al., 2022a) to expand and strengthen existing efforts (e.g. Heupel et al., 2007; Martins et al., 2018; Palacios et al., 2023) to standardize terminology regarding components of elasmobranch life history. We propose a unified definition of aggregation and supporting terms that can be applied across all elasmobranchs and used in future studies (Table 1). We discuss the drivers and types of aggregations, and detail the criteria required to identify an aggregation based on our definition. We conclude by offering direction on future methods and research areas that will advance our understanding of elasmobranch social ecology (Table 2). We argue that better defining the occurrence, details, and drivers of elasmobranch aggregations will not only contribute to our knowledge of how populations respond to their environment or anthropogenic changes, but also better inform proactive conservation strategies.
A standardized set of definitions for describing elasmobranch aggregations and their underlying mechanisms.
| Terminology | Definition |
| Aggregation | The co-occurrence of two or more individuals in space and time due to the deliberate use of a common driver. |
| Behavioural terminology | |
| Social groups (often “groups”) | Co-occurring individuals who are actively (socially) attracted to specific other individuals and change their movements and behaviours accordingly. Social grouping can be specific or non-specific (see below). |
| Social structure | The content, quality, and patterning of social relationships that emerges from repeated interactions between individuals (Hinde, 1976) |
| Non-specific social group | Co-occurrence in which the identity of the complementary individual does not matter; defined by weak and dynamic associations (e.g. schooling, local enhancement). |
| Specific social group | Co-occurrence is driven by individual identity; defined by stable associations (e.g. social communities, dominance hierarchies). |
| Non-social aggregation | Clustering of individuals at a given spatiotemporal scale that is solely driven by a third factor, whether an abiotic condition (e.g. a non-depletable environmental feature such as temperature or light) or a common resource (e.g. resources that animals use or extract for a biological process). |
| Consumptive non-social aggregation | Non-social group driven by consumption of a finite resource. |
| Non-consumptive non-social aggregations | Non-social group driven by the use of a condition. |
| Drivers | |
| Condition | Non-consumptive, abiotic, environmental features (e.g. temperature, light, salinity) that affect organism physiology or behaviour. |
| Resource | A consumable substance, abiotic or biotic, subject to competition, used by living organisms (e.g. space, oxygen, food or nutrients, water, shelter, and mating opportunities). |
| Continuous resource/condition | A persistent resource/condition that is not separated by space or time. |
| Co-occurrence | The presence of at least two individuals within the same spatial and temporal boundaries. Co-occurrences can be incidental, when individuals encounter others by chance, as a random product of each individual’s movement track unaffected by any external factors (termed “incidental co-occurrence”). They can also be driven by the deliberate use or pursuit of a shared common resource, presence of other individuals, or presence of particular conspecifics (referred to as “deliberate co-occurrence” in this text). |
Directions for future action: reporting recommendations for classifying aggregations.
| Reporting checklist |
| Number of animals interacting |
| Composition of aggregation (size, sex, species) |
| Individual characteristics of co-occurring animals: size, sex, appearance (i.e. mating scars or fin notches), colouration, signs of fishery interactions, identification tags, if present |
| Behaviour state of co-occurring individuals (feeding, swimming, resting), as well as behavioural events (e.g. rapid or non-rapid movements, mouth gaping, coordinated swimming, nose-to-tail swimming, aggression, body touches, etc.) |
| Environmental conditions at the time of observation (sea surface temperature, chlorophyll-a, depth, water visibility, weather conditions, swell, current direction, tides, precipitation for estuaries, wind speed and direction) |
| Evidence of any resource (e.g. prey patch, mating, etc.) |
| Resolution of occurrence detection methodology [drone surveys, tag range, eDNA, underwater diver visual survey, fishing effort (CPUE)] |
| Measurements of a continuous resource or informed proxies [i.e. prey distribution, distribution of conspecifics, sensory perceptions of the animals themselves (see criterion 2)] |
| Direct observation of behaviours (i.e. foraging or mating) or using tools such as association indexes and environmental correlates |
Proposed definition
The meaning of an elasmobranch aggregation to date has been broad, qualitative, and inconsistent. In cases where it is explicitly defined, such definitions vary. For example, Jacoby et al. (2012) suggest that an aggregation is a co-occurrence “not driven by social mechanisms”, whereas Palacios et al. (2023) propose aggregation as a general term to “describe any group of individuals that forms for any purpose”. More frequently, the term is mentioned but undefined (e.g. Heyman et al., 2001; Speed et al., 2012; Dicken et al., 2015). Reports of aggregations are further limited by missing information on the spatial or temporal scales at which aggregations occur and the number and density of individuals. Behaviours within aggregations are occasionally, but inconsistently, indicated (e.g. feeding, coordinated swimming). Similarly, the drivers of aggregations are often unclear; as mentioned above, the term has been used to describe both gathering due to common abiotic resource use (e.g. Klimley and Butler, 1988; Kessel et al., 2014; Kajiura and Tellman, 2016; Filiz, 2019) and social behaviour (e.g. Raje et al., 2012). We therefore suggest that future work in elasmobranch research will benefit from the following definition:
“An aggregation is the co-occurrence of two or more individuals in space and time due to the deliberate use of a common driver” (Table 1)
Within this, we propose three criteria defining the number of interacting animals, their behaviour, and the spatiotemporal scale of the association. While each in isolation may indicate a potential aggregation, we argue that all three must be met to support this conclusion more robustly. This definition is designed to be generalizable, encompassing any potential drivers and types (i.e. social or environmentally driven) of elasmobranch aggregations. Additionally, though most work on shark sociality has focused on associations between conspecifics, “aggregation” has also referred to mixed species co-occurrences (e.g. Dudley et al., 2000; Zemah-Shamir et al., 2022). Consequently, our definition also applies to all aggregations (inter- and intraspecific) that include an elasmobranch.
Drivers of aggregations
The foundational step in defining an elasmobranch aggregation is identifying its underlying drivers. A driver can refer to a resource or abiotic condition (hereafter “environmental factors”), or other individuals (Table 1). Drivers determine not only the function of the aggregation (i.e. why individuals aggregate), but also its nature (i.e. how they aggregate), scale (i.e. where and when aggregations occur), and predictability (i.e. how regularly aggregations are likely to occur). Different elasmobranch species are known to aggregate for breeding (Sims et al., 2000), feeding (e.g. Ebert, 1991; Hoffmayer et al., 2007; Armstrong et al., 2016), or refuging (e.g. Klimley, 1993) in areas characterized by specific environmental variables. These can include thermal habitat for gestation or incubation (e.g. warm, shallow embayments; Hight and Lowe, 2007), oceanographic conditions (e.g. Hearn et al., 2010), prey availability (e.g. Ebert and Ebert, 2005; Hannan et al., 2012; Armstrong et al., 2016), or in the case of social behaviour, the presence of conspecifics (Jacoby et al., 2012; Mourier et al., 2017; Papastamatiou et al., 2022a, b). Such drivers are not necessarily mutually exclusive. Individuals may respond to multiple external cues via multiple sensory modalities (e.g. Kajiura and Tellman, 2016), either simultaneously or over seasonal or ontogenetic cycles (e.g. Hulbert et al., 2005; Nosal et al., 2013). Furthermore, the scale of the drivers may differ, altering the number and spread of aggregating individuals. For instance, individuals may be collectively drawn to a coastal area due to favourable water temperatures (i.e. thermal condition), but cluster further within that region to consume patchily distributed prey (i.e. feeding resource). They may even further segregate into mating groups within this prey field (Figure 1a). In this example, there may be multiple ways to define aggregations composed of the same individuals. The elasmobranchs could form a larger-scale aggregation due to mutual attraction to favourable thermal habitat, and then multiple smaller feeding and/or mating aggregations within that larger area. In these and similar cases where drivers are nested or even hierarchical in importance to the individual, defining a given aggregation depends on the behaviour/driver of interest (i.e. physiological v feeding).
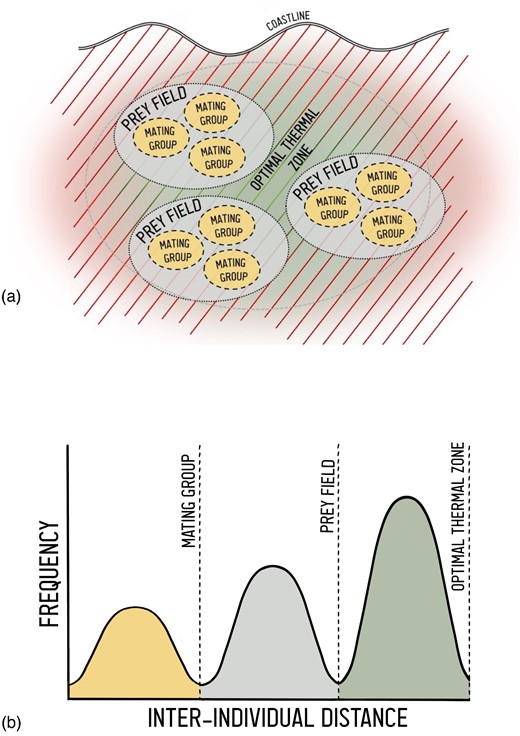
(a) A hypothetical example of nested drivers of elasmobranch aggregations. A given coastal environment may contain an optimal thermal zone, which could broadly attract individuals. These organisms aggregate within this zone to consume patchily distributed prey, and form mating groups within prey patches. (b) Simplified representation of the proposed process for identifying spatial bounds in aggregations. Frequency distributions of interindividual distances (as proposed in Syme et al., 2022) can be used to identify threshold distances, but these measures must also consider the scale of the common driver (in this example, mating opportunities, prey distribution, and thermal habitat).
However, assessing the drivers of elasmobranch aggregations can be particularly challenging given the high mobility of most species, their diverse life histories, the lack of knowledge about their sensory systems, and the dynamism of the environments they occupy. Measuring abiotic factors or observing continuous associations over time underwater is often logistically infeasible as well. This is rendered even more difficult because individuals may be responding to multiple cues in a given moment (Nathan et al., 2008), and resources used to drive aggregations may shift. Given these obstacles, isolating the exact driver underlying grouping behaviour may not be entirely necessary prior to defining an aggregation. If the goal is to monitor current spatial distribution and population dynamics, proxies for potential drivers could be sufficient; for example, using the observed behaviours, size, sex, and spread of individuals while spatiotemporally clustered, or noting the environmental conditions that tend to correlate with aggregation formation. In any case, these and other metrics used to define any elasmobranch aggregation should be consistently reported (Table 2) to contribute to a unified understanding of these phenomena (e.g. Syme et al., 2022). In turn, this understanding can inform habitat management and other conservation strategies, based on informed predictions of where aggregations may form in the future and for what purpose.
Categories of aggregations: non-social aggregation versus social grouping
To assess the purposes of aggregation, it is necessary to try to identify not only its potential drivers, but also their relative importance. As mentioned above, these drivers dictate the size, scale, and purpose of aggregation. They also influence the nature of inter-individual interactions (e.g. neutral, competition, byproduct mutualism, cooperation, etc.). In addition, information on specific drivers can be used to further categorize aggregations. There are two such categories recognized across taxa (Table 1; Figure 2; Boxes 1 and 2) that have been applied to elasmobranchs. The first is termed social groups (Jacoby et al., 2012; Papastamatiou et al., 2022a). Social groups occur when individuals mutually benefit from association with other non-threatening individuals (i.e. non-predators or non-aggressive conspecifics) and change their movements and behaviours accordingly (Couzin et al., 2005; Guttal and Couzin, 2010; Jacoby et al., 2012), regardless of other environmental stimuli (Parrish and Edelstein-Keshet, 1999). For example, Basking sharks, which typically gather to forage in plankton-rich habitats, will occasionally cease or adjust their feeding pattern to circle in large numbers (A. G. McInturf, pers. obs.; Sims et al., 2022), perhaps for courtship (Sims et al., 2022). Additionally, many species, such as Small-spotted catsharks (Scyliorhinus canicula), demonstrate sex-specific behavioural strategies in which females will aggregate in specific habitats (e.g. shallow-water caves), presumably to avoid males (Jacoby et al., 2010). Whether between conspecifics or individuals of other species, the interaction must be balanced between individuals (i.e. where both individuals either gain/lose; e.g. mutualism/competition), rather than unbalanced (i.e. predation). Historically, qualitative evidence indicated that social groupings occur in a variety of elasmobranch species, such as data suggesting refuging central-position social systems in Scalloped hammerhead sharks (Sphyrna lewini; Klimley and Nelson, 1984) and mating events in Manta rays (Manta spp.; Marshall and Bennett, 2010). More recently, quantitative methods have been developed to identify social associations (i.e. Guttridge et al., 2011; Mourier et al., 2017; Perryman et al., 2022). For example, Mourier et al., (2017) used acoustic receiver data and social network analysis to show non-random associations in Port Jackson sharks (Heterodontus portusjacksoni). Social associations are thought to occur for numerous reasons, such as predator avoidance (Engelbrecht et al., 2019), mating (Castro and Rosa, 2005; Dudgeon et al., 2008; Boomer et al., 2013; Gallagher and Klimley, 2018), and social foraging (e.g. Ebert, 1991; Klimley et al., 2001; Papastamatiou et al., 2020).
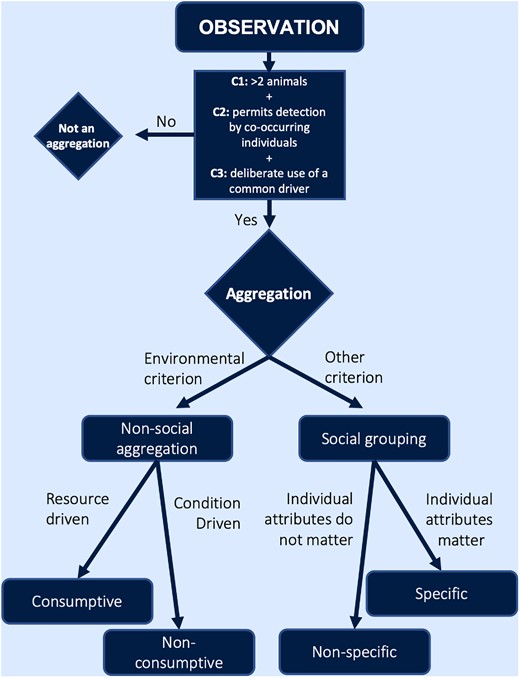
Our proposed paradigm for classifying aggregations in elasmobranchs. A given observation can be determined an aggregation based on our three criteria (C1, C2, C3; see text), and then further categorized according to its drivers.
Wobbegongs (Orectolobus maculatus) in New South Wales, Australia, have shown significant catch declines due to heavy targeting for the sale of their flesh as “flake” (Huveneers et al., 2006; Lee et al., 2015). Specific habitat preferences and residencies of these populations have been previously assessed to inform potential management and conservation efforts. Wobbegongs display short- (days) to medium-term (months) site fidelity, with peak abundances in spring and summer months (Carraro and Gladstone, 2006; Huveneers et al., 2006; Lee et al., 2014, 2015). During these periods, Wobbegongs have been frequently observed in close proximity and sometime form small groups (Lee et al., 2014). The cause of these groupings, whether by social preferences or by range limitations, resource availability, or life history, is unknown. Below, we apply our proposed framework to a specific study (Armansin et al., 2016) to illustrate how a social network analysis on Wobbegong sharks can be applied to define a specific social grouping in an Australian marine reserve. Of note, the authors did not investigate use of non-social continuous resource or conditions (which could indicate non-social mechanisms of co-occurrence), but these are not mutually exclusive with social drivers and could also be present.

| Aggregation criteria | Description |
|---|---|
| Criteria 1:Aggregations must be defined by a minimum of two individuals | • Spotted wobbegong sharks (n = 15) were acoustically tagged in a small Australian marine reserve and monitored by an acoustic array of overlapping receivers during a 15-month period. While there were no months in which all 15 sharks were present concurrently, at least half were present in all months, except from February to June of 2010 (range 3–6 sharks). The number of sharks observed in the array varied by month (range 3–13). |
| Criterion 2:Aggregation occurs at a scale that permits detection of an instantaneously overlapping driver by multiple individuals | • Sharks were monitored by acoustic tags, and associations were recorded when individuals were detected within 4 m of each other in 24 h. Acoustic data revealed the consistent presence of repeated dyads. Results showed that all sharks were a part of a dyad with at least one other individual. Individuals showed a mean of 17.2 associations with other individuals while the mean number of associations per dyad was 1.23 (indicating a social grouping). |
| Criterion 3:Participating individuals demonstrate a deliberate use of a common driver | • Sharks showed deliberate co-occurrence through repeated and consistent associations with specific individuals instead of random associations. Using a social network analysis, 35 associating dyads emerged (out of a possible 105), with permutation tests indicating that these were non-randomly formed. Results indicated three pairs with very high association preferences and two dyads with very low preferences, suggesting potential avoidance. Highly significant dyads showed persistent associations with specific individuals despite shifts in home ranges in between seasonal migrations, and some dyads remained consistent across different locations within the receiver array (indicating a specific social grouping). |
White sharks (Carcharodon carcharias) in the northeast Pacific make large seasonal migrations between coastal [Año Nuevo Island, Southeast Farallon Island (SEFI) and Tomales Point] and offshore habitats (White Shark Café) (Jorgensen et al., 2010, 2012). While onshore, White sharks have been the focus of numerous studies describing their foraging behaviours, movements, and population dynamics (e.g. Klimley, 1994; Anderson et al., 2011; Jorgensen et al., 2012; Kanive et al., 2021). The amount of information available on White sharks near the coast allows for a more thorough examination of possible aggregation drivers. Mating has been proposed as a potential mechanism of co-occurrence; however, supporting data are lacking (i.e. animals do not show fresh mating scars) (Jorgensen et al., 2012) and hormonal studies indicate declining sexual readiness in males from October to December (Sulikowski et al., 2012). Instead, foraging is identified as the likely primary driver in mixed class (sex and size) aggregations around coastal pinniped colonies (on a scale of kilometers). Therefore, below we use the body of literature from SEFI in our proposed framework to illustrate how available information would be applied to define White shark co-occurrences as a foraging aggregation near a pinniped haul out.

| Aggregation criteria | Description |
|---|---|
| Criteria 1:Aggregations must be defined by a minimum of two individuals | • Individual White sharks can be distinguished directly using fin ID and/or acoustic tags, which have a range of ∼500 m. Acoustic data and fin ID describe the predictable presence and residency of >40 White sharks per year within a few kilometres of coastal pinniped colonies seasonally, with peak abundances from August to January (Chapple et al., 2011, 2016). |
| Criterion 2:Aggregation occurs at a scale that permits detection of an instantaneously overlapping driver by multiple individuals | • The SEFI is located 30 km west of San Francisco, California, and has an approximate area of 0.85 km. Northern elephant seals (Mirounga angustirostris), a preferred prey item for White sharks, seasonally use the Farallon Island as a haul-out to molt (Pyle et al., 1996). The arrival of juvenile northern elephant seals at the SEFI coincides with the arrival of White sharks (Pyle et al., 2003). Limited haul-out locations around the island concentrate elephant seals at entry and departure points where high tides force them back into the water—resulting in peak observed predation events by White sharks (Anderson et al., 1996). Acoustic networks around marine mammal haul outs and photo ID studies identify multiple White sharks occurring simultaneously or in close succession at these locations. Given the range of the receivers and their proximity to haul outs and the locations of photo ID studies, these co-occurrences are at a scale well within that of the driver; in this case, abundant pinniped prey (indicating a non-social aggregation). |
| Criterion 3:Participating individuals demonstrate a deliberate use of a common driver | • White sharks have been directly observed predating on pinnipeds around the SEFI with frequency of predation events increasing in response to increasing local annual abundances of northern elephant seals at the island (Klimley et al., 1992; Brown et al., 2010) (indicating a consumptive aggregation). |
Although not yet widely adopted in elasmobranch literature, it may be possible to further classify social groups into subgroups we term nonspecific social groups, where the identity of the complementary individual does not matter (i.e. characterized by weak and dynamic social associations) and specific social groups, where co-occurrence is driven by individual identity (i.e. characterized by strong social associations; e.g. Papastamatiou et al., 2020) (Table 1; Figure 2; Box 1). Isolating these mechanisms in situ would be challenging for many elasmobranch species at present. Nonetheless, such a future direction would allow for improved assessment of the costs and benefits of aggregations in a variety of circumstances.
The second category of aggregations contains those formed due to environmental factors (Parrish and Edelstein-Keshet, 1999). For simplicity, and to comply with current trends in reporting, we define environmental factors here to include both ecological conditions (e.g. water temperature) and resources that the animals use or extract for a biological process (e.g. prey; Table 1). In elasmobranch literature, aggregations due to environmental factors are often called “passive aggregations” or simply “aggregations” (Palacios et al., 2023). However, we argue that these terms are often inconsistently used and confounded with the broader term aggregation. Instead, we propose the term non-social aggregation as these are driven by the unique benefit or choice of one individual based on environmental factors, rather than any other individual (Table 1; Figure 2; Box 2). Thus, in non-social aggregations, individuals do not demonstrate a mutually beneficial behavioural response (e.g. attraction) to other individuals, resulting in either neutral or unbalanced interactions (e.g. competition). A key feature of these aggregations is that shifts in or removal of the environmental stimulus should cause dispersal (e.g. Heyman et al., 2001; Martin, 2007; Fallows et al., 2013). Non-social aggregations are common in elasmobranchs, with perhaps the most well-studied instances for feeding (e.g. Barnett et al., 2011; Hueter et al., 2013; Rohner et al., 2013; Armstrong et al., 2016). Yet other examples of non-social aggregations include those of Nurse sharks (Ginglymostoma cirratum), which gather around preferred habitat in highly structured areas and on hard bottom substrate (Castro, 2000; Hannan et al., 2012). Similarly, numerous species of elasmobranch, such as Round stingrays (Urobatis halleri), Gray reef sharks (C. amblyrhynchos), and Atlantic stingrays (Dasyatis sabina), also demonstrate maternal thermophily, or behavioural thermoregulation that may result in aggregation as females occupy warmer waters (Economakis and Lobel, 1998; Sims, 2005; Wallman and Bennett, 2006; Hight and Lowe, 2007; Wearmouth and Sims, 2008; Mull et al., 2010; Jirik and Lowe, 2012). As with subgroups of social groups, the drivers could be used to further break non-social aggregations into subgroups based on use of resources (consumptive non-social aggregation) or ecological conditions (non-consumptive non-social aggregation; Table 1, Figure 2; Box 2). However, this may be logistically infeasible for current methods of elasmobranch research and should be considered for future work.
Current studies suggest that elasmobranchs broadly exhibit both non-social aggregations and social grouping (Schluessel, 2015; Finucci et al., 2018), yet the boundary distinguishing these two categories is not always clear and is species- and context-specific. For instance, Basking sharks (Cetorhinus maximus) are often observed aggregating in favourable habitat for feeding and demonstrating conspecific attraction simultaneously (A.G. McInturf, pers. obs.; Gore et al., 2019), perhaps to increase transmission of information or associate with kin (Lieber et al., 2020). Sevengill sharks (Notorynchus cepedianus), which are suspected to aggregate for refuge from larger predators in kelp beds (Engelbrecht et al., 2019), will also demonstrate a variety of social behaviours, including apparent cooperative hunting (Ebert, 1991). In mobulids, the seasonality of social behaviours (i.e. courtship and mating groups) may also be linked to food availability and temperatures that benefit neonate development (Palacios et al., 2023). In these cases, observed aggregations might be classified as non-social aggregations and/or social groups, depending on the research question. In general, we recognize that differentiating between these types of elasmobranch groups may be easier in theory than in practice, and in captive settings than in the field (e.g. Jacoby et al., 2010). Though we will hereafter refer broadly to aggregations, classifying these aggregations as non-social aggregations or social groups offers more nuanced insight into the current functions and evolutionary history of co-occurrence across species.
Criteria for elasmobranch aggregations
We propose three criteria, which must be met to qualify as an aggregation.
Aggregations must be defined by a minimum of two individuals
By necessity, an aggregation requires more than one individual to form spatially explicit groups or clusters (Allee, 1927; Fouché et al., 2019). The actual size of the aggregation is likely dependent on the drivers underpinning its formation. However, central to this process is the presence of at least one other individual in a given area (defined below). This threshold number appears widely accepted in literature across taxa. For instance, dyadic associations, or those between two animals, are considered the base unit of social groups and any resulting social structure (Fréon and Dagorn, 2000; Whitehead, 2008; Wilson et al., 2014; Ward and Webster, 2016). This criterion was also established by Syme et al. (2022) in a similar effort to establish a definition for delphinid groups. In fishes, Wilson et al. (2014) suggest that social interactions must include some element of association between two or more individuals. When reporting elasmobranch behaviour specifically, solitary individuals are distinguished from those that are even occasionally gregarious (e.g. Economakis and Lobel, 1998). The terms “dyad” and “partner” are commonly used to both qualitatively and quantitatively describe the nature of associations within elasmobranch aggregations, often related to social behaviour (e.g. Guttridge et al., 2009; Mourier et al., 2012; Papastamatiou et al., 2020), as evidenced by long-term dyadic associations among Blacktip reef sharks (Carcharhinus melanopterus; Mourier et al., 2012), Gray reef sharks (C. amblyrhynchos; Papastamatiou et al., 2020), and Manta rays (Mobula alfredi; Perryman et al., 2022). Though widely applied, this criterion of aggregations is often implied, rather than explicitly stated.
Aggregation occurs at a scale that permits detection of an instantaneously overlapping driver by co-occurring individuals
Identifying an aggregation requires an understanding of the spatial distribution of organisms in time (Levin, 1994); animals must gather concurrently in a limited (defined) space (Allee, 1927; Levin, 1994) in response to a common driver (Palacios et al., 2023). This means animals must first simultaneously utilize an environmental factor and/or detect other individuals. Therefore, the temporal scale of an aggregation is defined by the persistence of the driver. Second, the boundaries of this space can be defined by the scale of the driver or the sensory capabilities of the animal (as in social groups); but also, for non-social aggregations, the combined spatial extent of the detectable contiguous environmental factor that animal is perceiving. Quantitative methods (e.g. nearest neighbour analysis; Heupel and Simpfendorfer, 2005; Syme et al., 2022) may also be useful in helping establish the bounds of a perceived aggregation in a given area; however, we argue that these measures must also occur within the spatial scale of a common driver (Figure 1b). For example, an odour plume emitted from a whale carcass may extend thousands of metres, but the signal may disappear below detectable levels for a White shark before this distance because of turbulent mixing, molecular diffusion, or biological uptake (Atema, 1995). In this sense, the spatial extent of the detectable chemical signal defines the boundaries of the White shark aggregation related to the whale resource. Thus, the scale of the detectable driver, and thereby extent of an aggregation, is shaped by the particular species’ sensory modalities and capabilities (Figure 3a and b).

(a) A simplified relative representation of cue propagation distances above general elasmobranch sensory thresholds: gustatory (red ∼1 mm), tactile (orange ∼10 cm), bioelectric (yellow ∼40 cm), hydrodynamic (green ∼1 m), visual (blue ∼100 m), olfactory (dark purple ∼<1000 m), acoustic (light purple ∼>1000 m) (approximate ranges are depicted on a log scale). (b) A demonstration of visual, olfactory, and acoustic perceptual overlap between two individuals and food resource (crab). An arrow indicating a water current is shown at the bottom to represent an external factor that would affect the propagation of chemosensory cues because olfaction (purple) relies on the movement of physical matter. However, water flow would not impact vision or hearing because the propagation of light and acoustic stimuli depend on different physical properties of the environment, such as turbidity and density, respectively. In this example, the flow of water effectively reduces the receptive field (vertical ellipse) for the upcurrent batoid (left), which experiences reduced olfactory perception, and vice versa (horizontal ellipse) for the downcurrent batoid (right). Thus, both batoids could hear but not see the crab, whereas only the downcurrent individual could smell the prey item (ranges are not to scale for simplicity).
Elasmobranchs employ a variety of senses to detect resources, many of which may drive aggregation behaviour. Their sensory receptor cells are specialized to detect environmental stimuli that are broadly grouped into chemoreceptive (taste, smell), mechanoreceptive (hearing, touch, balance, body position and movement, water flow and pressure, electrostatic fields), and photoreceptive (vision) modalities. Sensory and cognitive studies on elasmobranchs have suggested that elasmobranchs are capable of associative learning using these modalities and can remember learned associations over time (e.g. Guttridge and Brown, 2014; Newton and Kajiura, 2017; Vila Pouca and Brown, 2018; Papastamatiou et al., 2022a). Cognitive traits such as social learning have also been described in numerous species, including Lemon sharks (N. brevirostris), Largespot River Stingray (Potamotrygon falkneri), and Port Jackson sharks (H. portusjacksoni) (Thonhauser et al., 2013; Guttridge and Brown, 2014; Vila Pouca et al., 2020; Papastamatiou et al., 2022a). However, such studies remain uncommon and limited to specific systems, and there is high variation in species detection capabilities and cue propagation in different environments. As each sense has species- and even individual-specific detection thresholds, it is unreasonable to establish a universal standard for the boundaries of a given aggregation. However, we can broadly categorize reasonable orders of magnitude of the perceptual distance of elasmobranchs (Figure 3a), which can be paired to specific drivers. Thus, we propose that the spatial scale of a non-social aggregation will be determined by the size, and the temporal scale by the persistence, of the environmental variable and the sensory capabilities of each individual. In other words, non-social aggregation boundaries are those that allow simultaneous access to a common, continuous resource or condition by two or more individuals (Figure 3b). Analogously, for social groups, the scale is driven by the detectable persistence of another individual.
There are challenges to addressing this criterion in practise. For example, there may be limited information both on the sensory capabilities of a species and the cues an aggregating individual may be detecting. Furthermore, such cues are rarely permanent, and their availability varies according to the physical properties of the medium, environmental conditions and the spatiotemporal scale over, which individuals interact. Even in cases where potential resources can be identified, it is also necessary to consider their biological relevance. For instance, there may be heterogeneity at a fine scale in sea surface temperature or within upwelling zones; however, animals may still be attracted to the broader regional cues. To apply this criterion without explicitly defining these parameters, it may be reasonable to assume that if animal occurrences correlate with a resource or condition, then the resource is likely within the sensory capabilities of the animals. In this case, the spatial and temporal extent of the resource or condition itself may be sufficient to define the boundaries of an aggregation. Defining such boundaries ideally requires combining measurements of environmental cues and the biological capabilities of the aggregating elasmobranch species. Yet even when these metrics are unknown or unmeasurable, we suggest that future studies report the spatial and temporal scales used to infer an aggregation to justify defining a given observation as such (Table 2).
Participating individuals demonstrate a deliberate use of a common driver
When defining an aggregation, it is also important to establish whether co-occurrence is incidental (i.e. where individuals encounter others by chance, as a random product of each individual’s movement track) or due to a deliberate response to an environmental factor or the presence of other organisms (hereafter, an incidental co-occurrence or deliberate co-occurrence, respectively; Table 1). This distinction is infrequently explored with inconsistent terminology used to differentiate these two phenomena. There are some exceptions in recent literature; for example, Anderson et al. (2021) and Findlay et al. (2016) both classify co-occurrences as random when describing non-social aggregations of White sharks, and non-random when referring to suspected social groups. However, studies that focus on incidental elasmobranch co-occurrence are otherwise sparse, with most interest in co-occurrence caused by a specific driver. To this point, the spatiotemporal threshold for deliberate co-occurrences has been arbitrary; there is no predefined duration or proximity justified by a proposed driver. Nonetheless, there are some tools used to assess this, such as null models based on permutations of association indices among identifiable individuals (Cairns and Schwager, 1987; Whitehead, 2008). Though collecting individual association data can be difficult, there are a growing number of studies measuring these associations in wild elasmobranchs across multiple years (Croft et al., 2005; Armansin et al., 2016; Findlay et al., 2016; Papastamatiou et al., 2020, 2022a; Perryman et al., 2022; Roose et al., 2022). Expanding this avenue of research is promising in further revealing the patterns, drivers, and functions of elasmobranch aggregations.
The distinction between incidental and deliberate co-occurrence is critical to our definition of an elasmobranch aggregation. It indicates whether the presence of individuals in an area is intentional or whether these animals are simply passing by. We suggest that all elasmobranch aggregations, social or non-social, are caused by deliberate co-occurrences. Given this perspective, incidental and deliberate co-occurrences can be differentiated by either the presence of a common external factor deliberately utilized by multiple individuals (non-social aggregation), or that of individuals in detection range of others (social group). Thus, determining whether those organisms are aggregating (i.e. a deliberate co-occurrence) requires either identification of a driver, or evidence that one is present. For example, multiple elasmobranchs gather in highly productive habitat to feed. Even if prey is unobservable directly, we may infer feeding or hunting behaviour based on the movement and kinematics of the predators themselves (i.e. area restricted searching, breaching, active filter-feeding, etc.). For social groups, individuals may exhibit coordinated swimming behaviours or mating scars (e.g. Jacoby et al., 2012; Gore et al., 2019). To further support the hypothesis that deliberate co-occurrence is caused by the directed use of a driver, we would also expect to observe repeatability in aggregation formation for that species or group of organisms when that driver is present.
There remain methodological challenges in identifying one or multiple resources driving deliberate co-occurrence (i.e. aggregation) in a given set of spatiotemporal bounds. Ideally, aggregations would be identified and classified via in situ measurements of environmental factors or quantitative proximity metrics, such as association indices (Armansin et al., 2016; Findlay et al., 2016; Mourier et al., 2017). Yet in the many instances where this is infeasible or not the primary aim of the research, there are other signs that may indicate deliberate co-occurrence; for instance, the size, sex, and behaviours of individuals in an area (Table 2). Cyclical and predictable patterns of movement or occupancy may also indicate that space use is linked to deliberate co-occurrence. Many elasmobranch species are known to form seasonal hotspots in coastal areas [e.g. mobulids for mating (Solleliet-Ferreira et al., 2020; Palacios et al., 2023), Basking sharks for courtship and feeding (Sims et al., 2022), and White sharks for feeding (Goldman and Anderson, 1999)], or to return to the same habitat diurnally or nocturnally (e.g. Scalloped hammerhead sharks for refuging; Klimley and Nelson, 1984). Until a standardized metric of deliberate co-occurrence is established for elasmobranch research, these proxies are likely sufficient to justify the classification of an aggregation. However, we recommend that any proxies are reported as such (Table 2) and that studies avoid interpretation beyond the scope of the available data.
Future directions
Our proposed definition of an elasmobranch aggregation is an important first step to coalescing descriptions of dynamics that occur during elasmobranch co-occurrence. It offers a minimum threshold at which to begin to further examine aggregation behaviour. By addressing the three proposed criterion for classifying an aggregation, future studies can standardize observations for elasmobranch occurrences while considering their connection to biological and environmental drivers. Furthermore, given the variable terminology in the literature to date, we recommend that readers interpret existing studies based on our proposed structure, to allow for more robust comparison across studies, species, and behaviours (see Boxes 1 and 2). Our paradigm will provide researchers and resource managers with a tool to assess the importance of areas where elasmobranchs are observed and how that may change in the future. To advance this field and create actionable, conservation-driven outcomes, we conclude by offering insights to guide future research and reporting (outlined in Table 2).
First, there is a continued need for standardized descriptions of elasmobranch aggregations. Reports should at least include specific details about animal occurrences, drivers, and scale; ideally, individual characteristics and behaviour are also recorded (Table 2). There should be a strong effort to contextualize these behaviours with environmental information. For example, there is typically oceanographic environmental data readily available, albeit at various resolutions depending on the location. We recognize that it is not always possible to explicitly quantify the drivers underlying these aggregations in the marine environment. However, reporting any environmental data alongside observations helps to standardize descriptions of aggregations, determine the influence of external variables on animal behaviour (Roose et al., 2022), and model species distributions. Consequently, this practice would offer multifaceted benefits to both research and management.
There are also specific areas of research and practices that would contribute to our understanding of elasmobranch aggregations. For instance, very little is known about species-specific sensory ecology of many species, including how they communicate (but see Fetterplace et al., 2022). Relatedly, though there has been increasing interest in elasmobranch cognitive capabilities, there are still no empirical methods of assessing the relative importance of different sensory modalities for recognition of other individuals or kin (Papastamatiou et al., 2022a). Yet this information can provide novel insight into how these animals may be interacting with each other to facilitate foraging, mating, reduced predation risk, and social structure. We can also increase our understanding of inter-individual proximity and its environmental context. Vast improvements in biologging and animal tracking technology now allow us to monitor elasmobranch activities that have historically been inaccessible for long-term direct observation (Villegas-Rios et al., 2022). Devices such as animal-borne cameras and proximity loggers (Haulsee et al., 2016; Barkley et al., 2020; Villegas-Rios et al., 2022) and methods such as nearest neighbour analysis, association indices, and social network analyses (Heupel and Simpfendorfer, 2005; Mourier et al., 2017, 2018; Villegas-Rios et al., 2022) have already been employed on select species to measure the relationship between individuals over time (see Jacoby et al., 2012; Papastamatiou et al., 2022a). Beyond technical improvements in such devices (i.e. increasing battery life and providing finer positional resolution), adding additional sensors to monitor animal state (i.e. heart rate, body temperature, tissue biochemistry, and appendage activity) and environmental conditions would increase our ability to connect movement patterns to biological and environmental processes. Tools such as echosounders or aerial and underwater drones could also be used to identify elasmobranch aggregations (Villegas-Rios et al., 2022). In parallel, evolving analytical tools could be used to synthesize the movements and behavioural patterns of individuals in relation to their environment (e.g. Tuia et al., 2022). For example, machine learning models have successfully classified vertical swimming, chewing, and resting behaviour of Port Jackson sharks (Kadar et al., 2020). Work that combines the proximity and behavioural signals of multiple individuals concurrently (as in Barkley et al., 2020; Papastamatiou et al., 2022b) would greatly contribute to answering broader questions about aggregation function and fitness relevance.
Concluding remarks
Our proposed definition of elasmobranch aggregations will ideally transfer not only to researchers but also to policymakers and managers. Elasmobranchs are highly threatened, and there is increasing effort to improve area-based protection to combat population declines (Hyde et al., 2022). A key step in doing so is identifying areas where these animals aggregate to carry out vital functions (Hyde et al., 2022). Our proposal contributes to this effort by offering standardized criteria by which to identify aggregations and their locations. Furthermore, determining the mechanisms driving aggregations offers greater predictive power into when, where, and at what scale they may form. It will also shed light on the evolutionary benefit of such co-occurrence behaviours, thus contributing to our assessment of elasmobranch population and social dynamics. Additionally, aggregations can influence a population’s growth rate and response to exploitation (Dobson and Poole, 1998). This information is critical to mitigating anthropogenic impacts that are often exacerbated by aggregation formation, such as fishing pressure, incidental capture, habitat destruction, and climate change (Wearmouth and Sims, 2008; Mucientes et al., 2009; Jacoby et al., 2012; Villegas-Rios et al., 2022; Palacios et al., 2023). Notably, the importance of aggregations to conservation efforts will be species- or population-specific. For instance, smaller aggregations of highly threatened species may warrant more consideration for spatial protection than more abundant species in aggregations of similar size. Regardless, considering aggregation behaviour will permit tailored management strategies to account for the vulnerability exhibited by elasmobranchs when gathering at specific locations and times (Mucientes et al., 2009; Jacoby et al., 2012; Palacios et al., 2023). From a different perspective, there is also emerging evidence to suggest that elasmobranch aggregations offer an alternative economic incentive to harvesting, such as via ecotourism (Jacoby et al., 2012; Zemah-Shamir et al., 2019). For example, tourist activities with mobulids at aggregation sites have been shown to contribute substantially to both local and global economies (O'Malley et al., 2013; Palacios et al., 2023). Consequently, a more structured approach to assessing aggregation events, such as we have proposed here, will be beneficial to various conservation pathways in the future.
In conclusion, we recognize that shifting a common paradigm within a given field, such as we propose here, can be a substantial change. Nonetheless, similar endeavours (e.g. Heupel et al., 2007) show that clearly defining widespread concepts of animal behaviour can have powerful, applied impacts (e.g. Kinney and Simpfendorfer, 2009). By standardizing terminology, researchers can compare their results across studies, clearing a potential bottleneck as larger volumes of data are collected and analysed. Our reporting recommendations also add breadth to this subfield of elasmobranch science by establishing a consistent set of baseline information, which can be collected to help fill in existing knowledge gaps and assess long-term patterns of elasmobranch aggregations. As the populations of many elasmobranch species continue to decline, there is an urgent need to first understand how such dynamics influence species distribution and abundance, and then to pair this understanding with management strategies.
Acknowledgement
TKC would like to thank JCH Cornapple. AGM thanks Damien Caillaud for inspiring exploration into these concepts, and the Irish Basking Shark Group for offering opportunities for field-based observations. All authors thank J. Mourier and an anonymous reviewer for the insightful comments that improved our work.
Author contributions
AGM and TKC conceived of the initial concepts for the manuscript, with further refinement by MC. JB created the tables, and JMS and KCN produced the figures. All authors contributed with insights and writing.
Data availability
No data were created or analysed in this study.
Conflicts of Interest
The authors declare no conflicts of interest.
Funding
This study was supported in part by the CICOES Postdoctoral program, which funded AGM. MC was supported by the Marine Mammal Research Program Fund, the Jungers Faculty Development and Research Fund, the Marine Studies Initiative, and the College of Agricultural Sciences at Oregon State University. KCN received funding from Oregon Sea Grant NA22OAR4170102 (CFDA No. 11.417).
